
Official websites use .gov
A .gov website belongs to an official government organization in the United States.
Secure .gov websites use HTTPS
A lock (
) or https:// means you’ve safely connected to the .gov website. Share sensitive information only on official, secure websites.

Topics
Data & Maps
Surveys & Programs
Resource Library
Story Map – An Aging World: 2020
Story Map – An Aging World: 2020
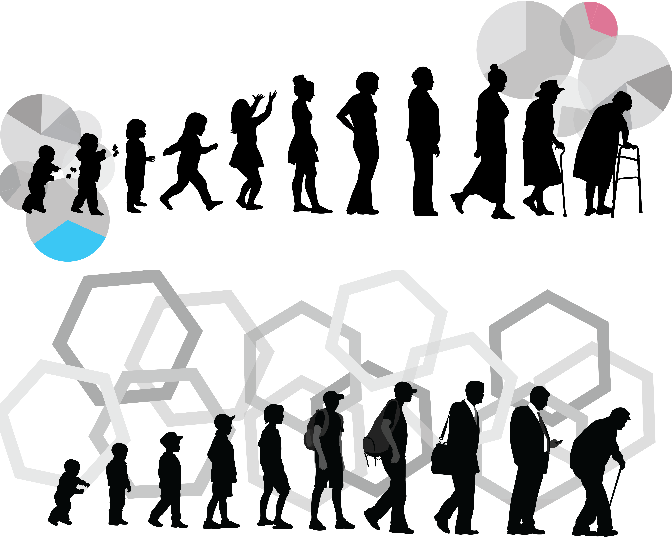

Click on the image or Here to view the Story Map
The An Aging World: 2020 Story Map walks through our aging world and explores how our world looks now and how it may change over the next 30 years. It guides users through a data-driven narrative using map series, text, and infographics. The Story Map illustrates the variation in proportion of 65 and older in all countries of the world; explains the process of population aging by a generalized model called the Demographic Transition; demonstrates changes in the main drivers of population aging – fertility decline and mortality decline; and exhibits differences in older dependency ratio, sex ratio, and healthy life expectancy. As the story of population aging and its challenges continue to unfold throughout the world, societies will choose to respond in similar and diverse ways.
Page Last Revised - August 24, 2023
✕
Is this page helpful?
 Yes
Yes
 No
No
 Yes
Yes
 No
No✕
NO THANKS
255 characters maximum
 255 characters maximum reached
✕
Thank you for your feedback.
Comments or suggestions?

Comments or suggestions?