
Census.gov > Library > Infographics & Visualizations > 2013 > Synthetic Work-Life Earnings by Field of Bachelor’s Degree and Occupation Group for Full-Time, Year-Round Workers Whose Highest Attainment is a Bachelor’s Degree
Library
Synthetic Work-Life Earnings by Field of Bachelor’s Degree and Occupation Group for Full-Time, Year-Round Workers Whose Highest Attainment is a Bachelor’s Degree
April 4, 2013

A bachelor’s degree holder can expect to earn about $2.4 million over his or her work life. However, not everyone with the same college major and level of education earns the same amount. Engineering majors make the most of any college major, at $3.5 million, but this varies widely between engineering majors who work in service occupations ($1.4 million) and those who work in management occupations ($4.1 million). Education majors make the least, at $1.8 million, and no occupation for education majors provides higher earnings than the average for bachelor’s degree holders. For more information on the classification of fields of degree and occupations, see www.census.gov/library/publications/2012/acs/acsbr11-04.html.
For related graphics see the series of infographics showing Pathways After a Bachelor’s Degree see: www.census.gov/library/visualizations/2012/comm/pathways-series.html
SOURCE: Julian, Tiffany, "Work-Life Earnings by Field of Degree and Occupation for People With a Bachelor’s Degree: 2011," American Community Survey, U.S. Census Bureau, October 2012, available at www.census.gov/library/publications/2012/acs/acsbr11-04.html.
NOTE: Colors represent statistical difference from the average for all bachelor’s degree holders—2.4 million. Synthetic work-life earnings represent expected earnings over a 40-year time period for the population aged 25-64 who maintain full-time, year-round employment the entire time. Calculations are based on median annual earnings from a single point in time for eight 5-year age groups multiplied by five. Not all fields of degree and occupations are shown here. Data based on sample. For information on confidentiality protection, sampling error, nonsampling error, and definitions, see www.census.gov/programs-surveys/acs/.
Recent Data Visualizations
 Population Without Health Insurance
 Population Bracketology
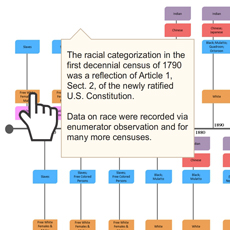 Measuring Race and Ethnicity Across the Decades: 1790-2010
 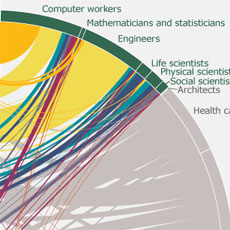 Where do college graduates work?
 Story Maps Illustrate Population Change
 HIV/AIDS Impact in Africa
 Distribution of Hispanic or Latino Population by Specific Origin: 2010
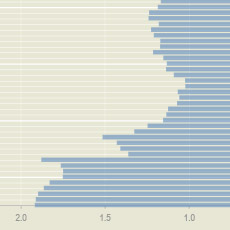 A Century of Population Change in the Age and Sex Composition of the Nation
 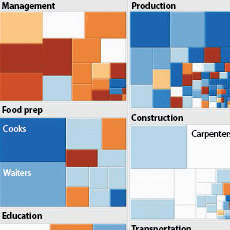 Shifting Occupational Shares
 Metro Area Density
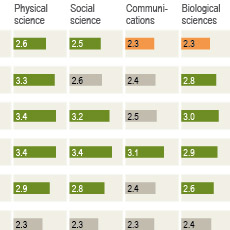 Work-Life Earnings
 Census Flows Mapper
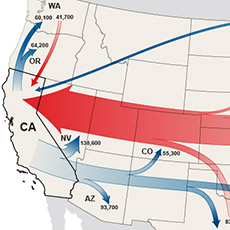 Migration Between Calif. & Other States
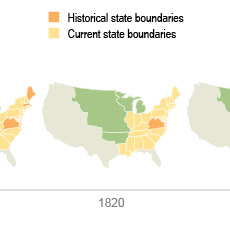 U.S. Territory and Statehood Status
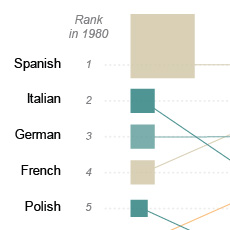 Spoken Languages Other than English
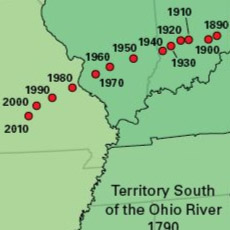 Center of Population, 1790-2010
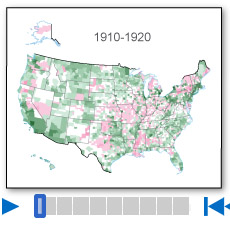 Population Change by Decade
 Without A High School Education
 A Decade of State Population Change
 State-to-State Migration for States of 8 Million or More
 Population Under 5 Years Old by Congressional District
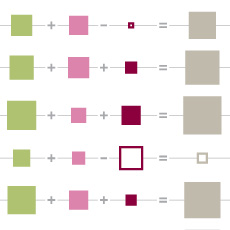 Components of Metro Area Change
 Blooming States
 Coastline County Population
 Coastline County Population
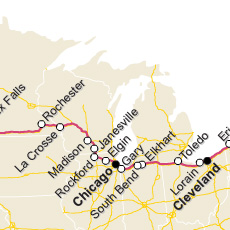 I-90 Population Density Profile, 2010
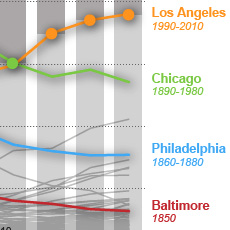 Second Cities: Keeping Pace with a Booming New York
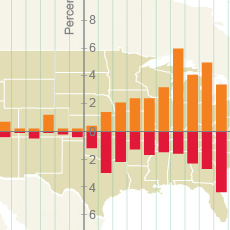 By the Grid: Population Shift to the West and South
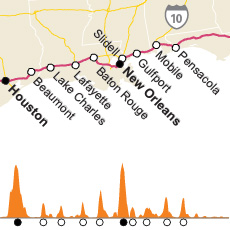 I-10 Population Density Profile, 2010
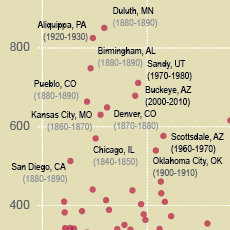 Booming Cities Decade-to-Decade, 1830-2010
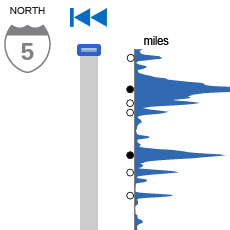 I-5 Population Density Profile, 2010
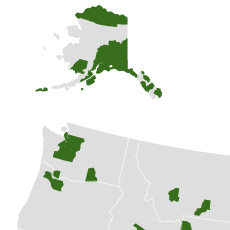 Islands of High Income
 The Great Migration, 1910 to 1970
 Following the Frontier Line, 1790 to 1890
 Changing Ranks of States by Congressional Representation
 Cartograms of State Populations in 1890, 1950, and 2010
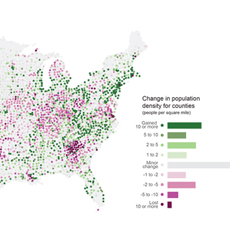 Before and After 1940: Change in Population Density
 From Physical to Political Geography
 Differential City Growth Patterns
 I-95 Population Density Profile
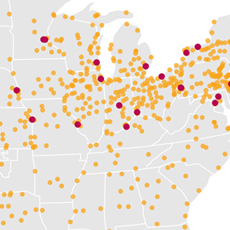 Increasing Urbanization
 Gaining and Losing Shares
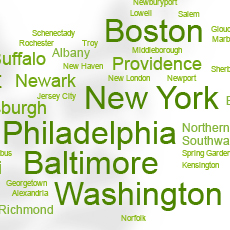 Top 20 Cities

