
Census.gov > Library > Infographics & Visualizations > 2013 > Center of Population and Territorial Expansion, 1790-2010
Library
Center of Population and Territorial Expansion, 1790-2010
February 7, 2013
The mean center of population is the place where an imaginary, flat, weightless, and rigid map of the United States would balance perfectly if all residents were of equal weight. Historically, the movement of the center of population has reflected the expansion of the country, the settling of the frontier, waves of immigration and migration west and south. Since 1790, the center of population has moved steadily westward, angling to the southwest in recent decades.
SOURCE: Geography Division, "Centers of Population Computation for the United States 1950-2010," issued March 2011, available at www.census.gov/geo/www/2010census/centerpop2010/COP2010_documentation.pdf. Consulted for historical reference: Historical Atlas of the United States, National Geographic Society, 1988.
NOTE: The Proclamation Line of 1763 limited British settlement to areas east of the Appalachian Mountains. Alaska and Hawaii were not included in the calculation of the mean center of population until 1950. Puerto Rico was not included in any decade. For more information on the mean center of population, an animated map, and other resources, see www.census.gov/geo/www/2010census/centerpop2010/centerpop2010.html. This graphic is adapted from the "Census Atlas of the United States" published by the Census Bureau in 2007. More information about this publication is available at www.census.gov/population/www/cen2000/censusatlas/.
Recent Data Visualizations
 Population Without Health Insurance
 Population Bracketology
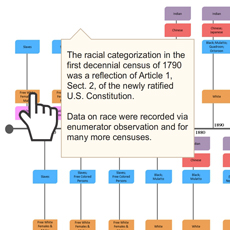 Measuring Race and Ethnicity Across the Decades: 1790-2010
  Where do college graduates work?
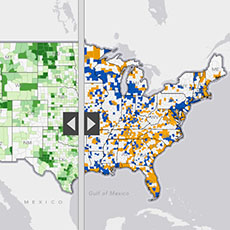 Story Maps Illustrate Population Change
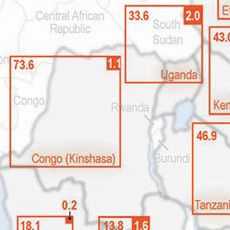 HIV/AIDS Impact in Africa
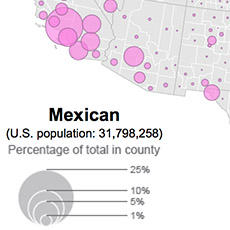 Distribution of Hispanic or Latino Population by Specific Origin: 2010
 A Century of Population Change in the Age and Sex Composition of the Nation
 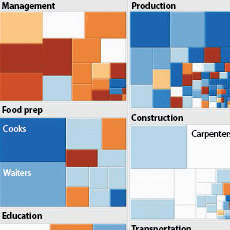 Shifting Occupational Shares
 Metro Area Density
 Work-Life Earnings
 Census Flows Mapper
 Migration Between Calif. & Other States
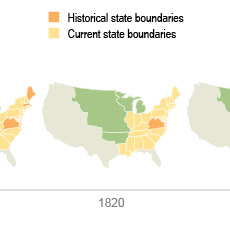 U.S. Territory and Statehood Status
 Spoken Languages Other than English
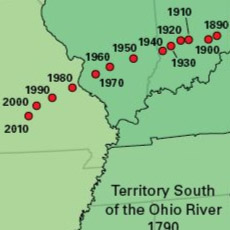 Center of Population, 1790-2010
 Population Change by Decade
 Without A High School Education
 A Decade of State Population Change
 State-to-State Migration for States of 8 Million or More
 Population Under 5 Years Old by Congressional District
 Components of Metro Area Change
 Blooming States
 Coastline County Population
 Coastline County Population
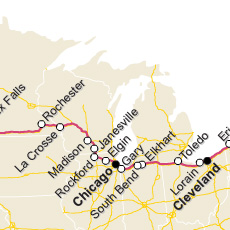 I-90 Population Density Profile, 2010
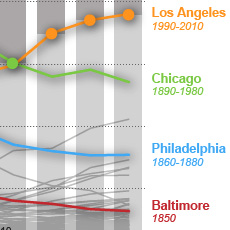 Second Cities: Keeping Pace with a Booming New York
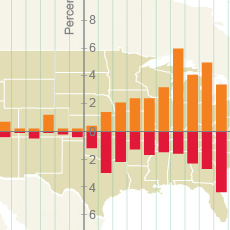 By the Grid: Population Shift to the West and South
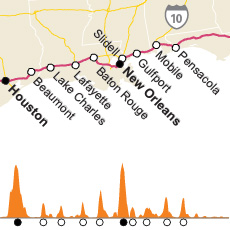 I-10 Population Density Profile, 2010
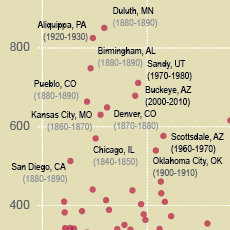 Booming Cities Decade-to-Decade, 1830-2010
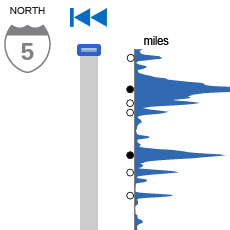 I-5 Population Density Profile, 2010
 Islands of High Income
 The Great Migration, 1910 to 1970
 Following the Frontier Line, 1790 to 1890
 Changing Ranks of States by Congressional Representation
 Cartograms of State Populations in 1890, 1950, and 2010
 Before and After 1940: Change in Population Density
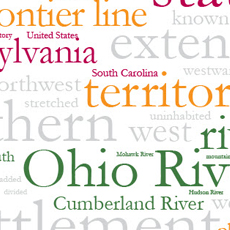 From Physical to Political Geography
 Differential City Growth Patterns
 I-95 Population Density Profile
 Increasing Urbanization
 Gaining and Losing Shares
 Top 20 Cities

