
Official websites use .gov
A .gov website belongs to an official government organization in the United States.
Secure .gov websites use HTTPS
A lock (
) or https:// means you’ve safely connected to the .gov website. Share sensitive information only on official, secure websites.

Topics
Data & Maps
Surveys & Programs
Resource Library
1990 Population Distribution in the United States
1990 Population Distribution in the United States
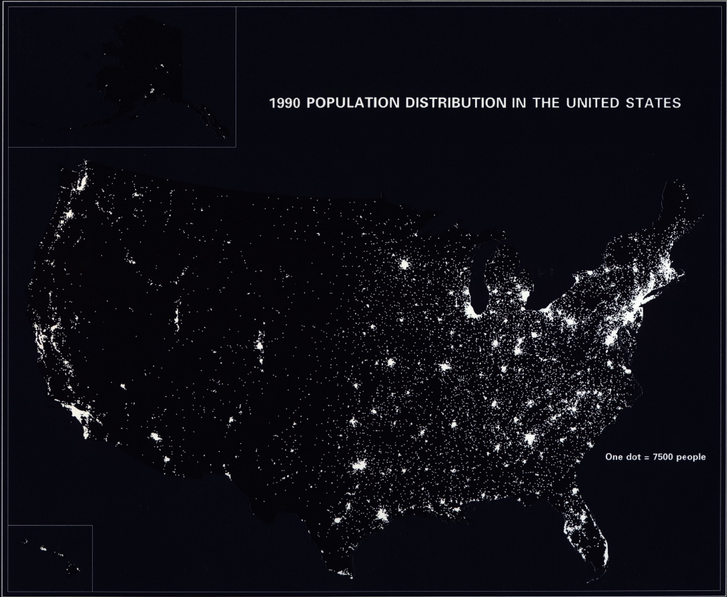
The U. S. Census Bureau has produced a 1990 Population Distribution in the United States map (also referred to as the "Nighttime Map") as part of the GE-90 map series (GE-90 No. 5). In this map series Alaska and Hawaii, shown in the upper left and lower left map corners respectively, are closer to their actual locations relative to the conterminous U.S. than in earlier map series.
The 1990 version of the Population Distribution of the United States map reflects population data from the 1990 Decennial Census. The U.S. land area is shown in black against a midnight blue background in which the population locations are shown as if lights were visible during the night sky. White dots coalesce to form the urban population concentrations. Each white "dot" represents 7,500 people.
Map Scale:
- Conterminous United States - 1:7,500,000
- Alaska - 1:16,375,000
- Hawaii - 1:9,995,000

Related Information
Page Last Revised - January 14, 2022
✕
Is this page helpful?
 Yes
Yes
 No
No
 Yes
Yes
 No
No✕
NO THANKS
255 characters maximum
 255 characters maximum reached
✕
Thank you for your feedback.
Comments or suggestions?

Comments or suggestions?