Child Poverty Rates Dropped in 8 States While Poverty Rates for Older Population Rose in 10 States
Poverty rates for both the youngest and oldest populations changed in many states in 2023, according to American Community Survey (ACS) data released today.
Child poverty rates decreased in eight states and poverty rates for the 65 and older population increased in 10 states. No state experienced both a decrease in the child poverty rate and an increase in the poverty rate for the 65 and older population in 2023.
While the poverty rate for those age 65 and over remained lower than the poverty rate for children in 2023, it rose 0.3 percentage points while the child poverty rate decreased by 0.3 percentage points from 2022.
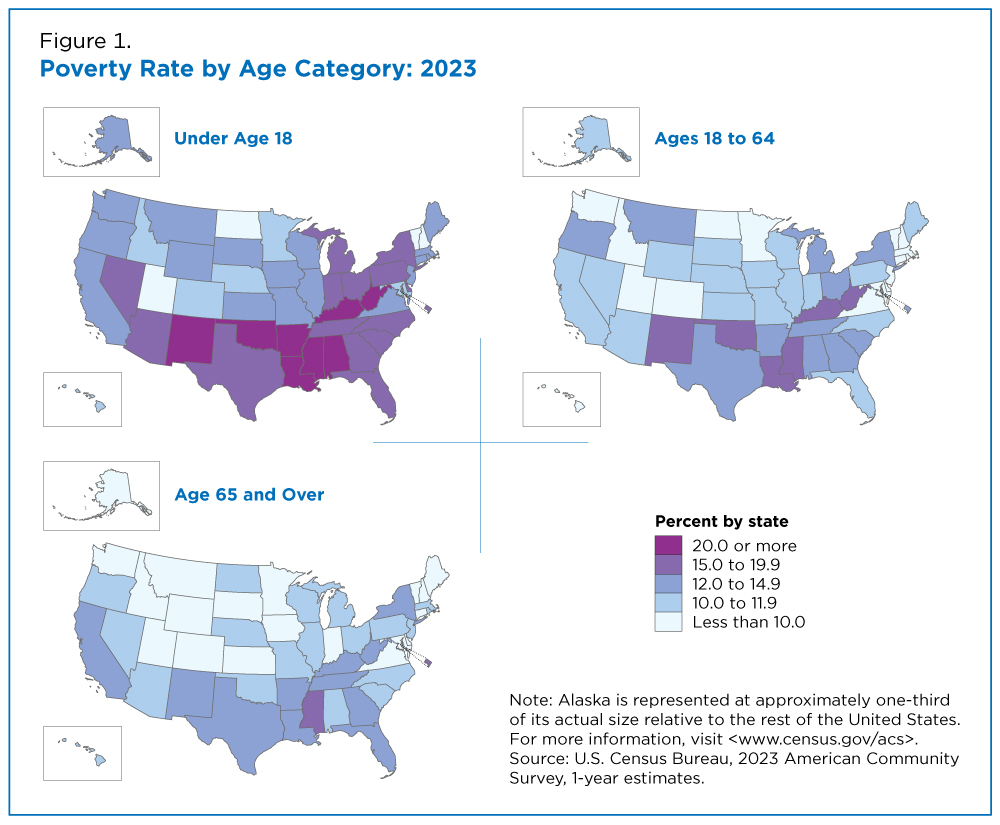
The three maps below show the difference in state poverty rates when using the same poverty rate categories for all three age groups.
New Hampshire, Vermont and Utah were in the lowest poverty category for all three age groups. Five other states (North Dakota, Minnesota, Maryland, Colorado and Idaho) were in the lowest poverty map category for two age groups and the next lowest for the third.
While no state was in the highest poverty category for each age group, Mississippi was in the highest poverty category for one age group and the second highest for the other two.
The U.S. poverty rate in the ACS was 12.5% in 2023, but the rate was significantly higher for the nation’s youngest populations and lower for the oldest (Figure 1).
The child (defined as people under age 18) poverty rate was 16.0% in 2023, 3.5 percentage points higher than the overall rate.
But the poverty rate for those age 65 and over was 11.3%, 1.2 percentage points lower than the overall rate. The poverty rate for those ages 18 to 64 was 11.5%, also lower than the overall rate.
While the poverty rate for those age 65 and over remained lower than the poverty rate for children in 2023, it rose 0.3 percentage points while the child poverty rate decreased by 0.3 percentage points from 2022.
This is the second year in a row that the annual poverty rates changed in opposite directions for these two groups at the national level. However, examining state estimates provides important context.
How Poverty is Measured
Poverty status is determined by comparing annual income to a set of dollar values (called poverty thresholds) that vary by family size, number of children, and the age of the householder.
If a family’s pretax money income is less than the dollar value of their threshold, that family and every individual in it are in poverty. For people not living in families, poverty status is determined by comparing the individual’s income to their poverty threshold.
The poverty measure excludes children under the age of 15 who are not related to the householder, people living in institutional group quarters, and people living in college dormitories or military barracks.
Child Poverty by State and Region
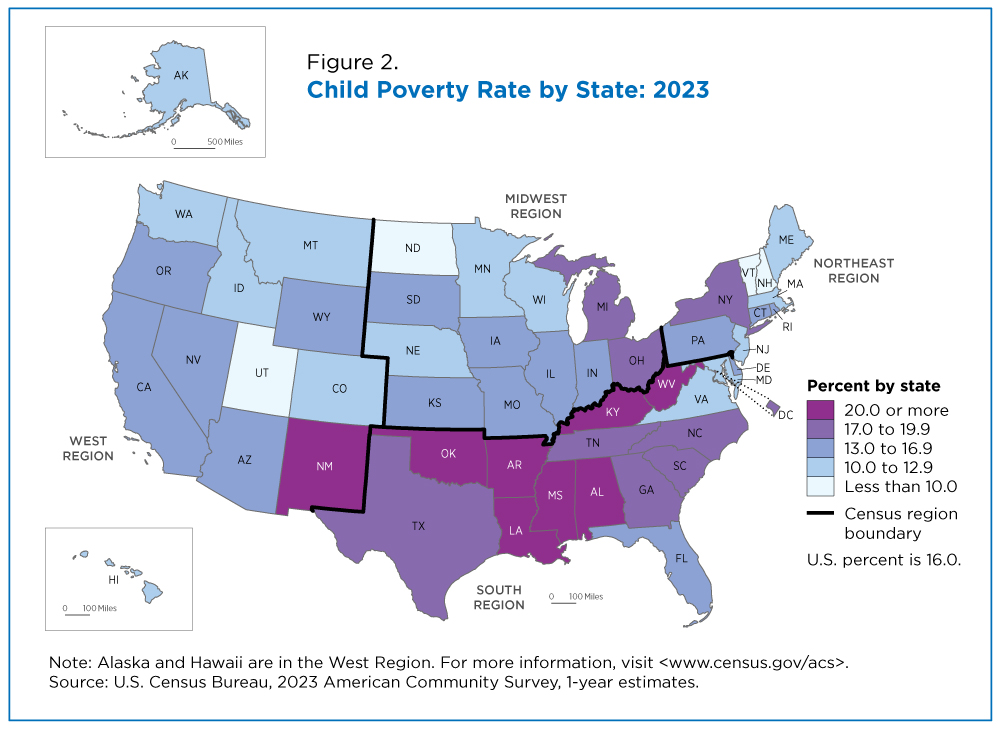
The national child poverty rate in the ACS was 16.0% but there was considerable variation among states, ranging from 8.0% to 25.3%.
Figure 2 illustrates the uneven geographic distribution of child poverty in every state and the District of Columbia. This map, though similar to the “Under Age 18” map in Figure 1, just focuses on spatial differences in child poverty.
Figure 1 used joint poverty categories for all age groups to highlight differences in poverty rates while in both Figure 2 and Figure 3, states are compared to each other, specifically showing state variations in child poverty (and elderly poverty in Figure 3).
More than three-quarters of states (13 of 17) in the South region had child poverty rates of 17.0% or more.
The Midwest, Northeast and West regions each had only two states or fewer with child poverty rates of 17.0% or more.
Both the Northeast and the West had more than half of their states with poverty rates 12.9% or lower corresponding to the two lowest map categories for child poverty.
Child poverty rates by state:
- Among the lowest were in New Hampshire (8.0%), North Dakota (8.7%), Vermont (9.0%), and Utah (9.5%). (These estimates are not significantly different from one another.)
- Among the highest were in New Mexico (25.3%), Louisiana (25.0%), and Mississippi (23.2%). (These estimates are not significantly different from one another.)
- Child poverty rates decreased in eight states from 2022 to 2023: Florida, Illinois, Mississippi, Missouri, Nebraska, North Dakota, Texas and West Virginia.
- Child poverty rates increased in two states from 2022 to 2023: Georgia and Tennessee.
Poverty Rate Among People Age 65 and Over
In 2023, the national ACS poverty rate for people age 65 and over was 11.3%, significantly lower than the rate for all people and the child poverty rate. However, this was an increase from 10.9% in 2022, the third year in a row (using standard data products) that poverty rates increased for the oldest age group.
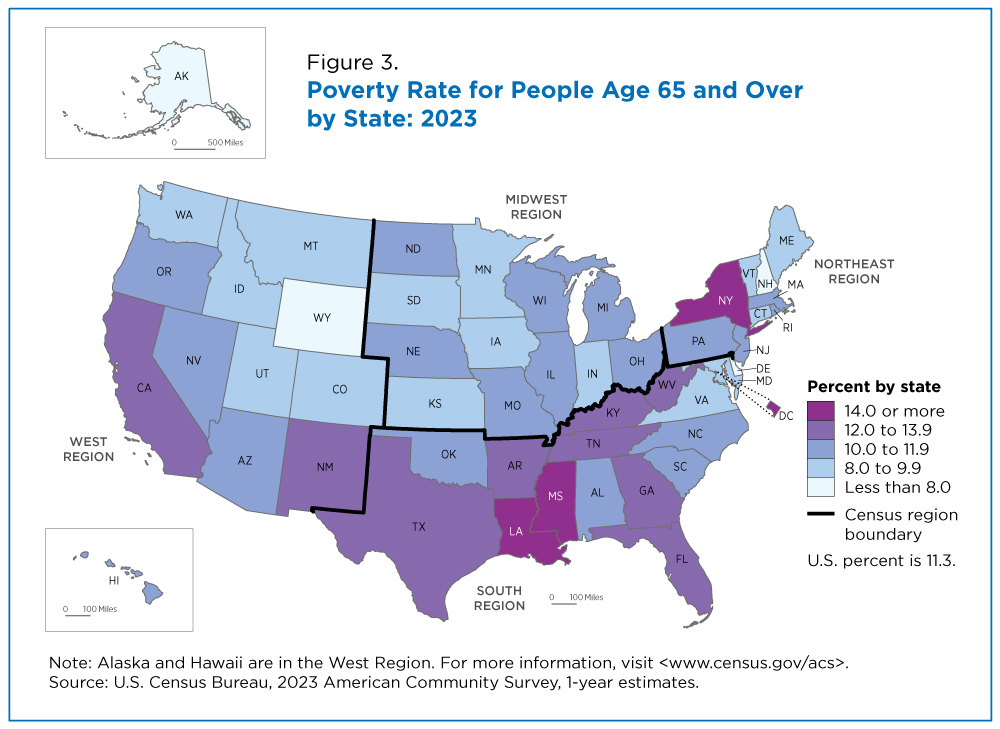
There were geographic variations in these poverty rates but not as pronounced as for the child poverty rate. The poverty rates for the older population ranged from 7.2% to 17.7% (Figure 3).
The South had nine states and the District of Columbia (more than one-half of states in the southern region) with poverty rates of 12.0% or more. The West (53.8%), Northeast (44.4%), and Midwest (41.7%) regions all had at least 40% of their states in the two lowest poverty map categories. Midwestern states all had elderly poverty rates between 8.8% and 10.9%.
Poverty rates for oldest age group by state:
- Among the lowest were Alaska (7.2%), Wyoming (7.4%), New Hampshire (7.6%), Delaware (7.9%), and Utah (8.2%). (These estimates are not significantly different from one another.)
- Among the highest were the District of Columbia (17.7%) and Mississippi (15.8%). (These estimates are not significantly different from one another.)
- Poverty rates for people age 65 and over decreased in four states from 2022 to 2023: Alaska, Montana, South Dakota and Wyoming.
- Poverty rates for people age 65 and over increased in ten states from 2022 to 2023: Arizona, Colorado, Georgia, Hawaii, Iowa, Michigan, New York, Tennessee, Vermont and Virginia.
In Figures 2 and 3, one state, New Hampshire, was in the lowest poverty category for both child and age 65 and over poverty, while two states, Louisiana and Mississippi, were in the highest poverty category for these two age groups.
Additional poverty data from the 2023 release are available on the poverty topics page, including links to poverty estimates from other surveys like the Current Population Survey Annual Social and Economic Supplement (CPS ASEC) and the Survey of Income and Program Participation (SIPP).
Related Statistics
Subscribe
Our email newsletter is sent out on the day we publish a story. Get an alert directly in your inbox to read, share and blog about our newest stories.
Contact our Public Information Office for media inquiries or interviews.
-
Rental HousingLargest Annual Real Increase in Gross Rental Costs Since 2011September 12, 2024Despite an increase in the cost of rent and utilities, most states saw no significant change in the share of renters’ income spent on rent.
-
Health InsuranceHealth Coverage for Working-Age Adults Rose in Every State Since 2013September 12, 2024A brief, infographic and working paper from the American Community Survey estimates out today show changes in health coverage rates by age and state 2013-2023.
-
Income and PovertyPersistent Poverty: Identifying Areas With Long-Term High PovertyMay 22, 2023U.S. Census Bureau research introduces a proposed expanded definition of persistent poverty at subcounty levels.
-
EmploymentThe Stories Behind Census Numbers in 2025December 22, 2025A year-end review of America Counts stories on everything from families and housing to business and income.
-
Families and Living ArrangementsMore First-Time Moms Live With an Unmarried PartnerDecember 16, 2025About a quarter of all first-time mothers were cohabiting at the time of childbirth in the early 2020s. College-educated moms were more likely to be married.
-
Business and EconomyState Governments Parlay Sports Betting Into Tax WindfallDecember 10, 2025Total state-level sports betting tax revenues has increased 382% since the third quarter of 2021, when data collection began.
-
EmploymentU.S. Workforce is Aging, Especially in Some FirmsDecember 02, 2025Firms in sectors like utilities and manufacturing and states like Maine are more likely to have a high share of workers over age 55.


