By 2060, Less Than 60% of Non-Hispanic White Population and About 65% of Non-Hispanic Multiracial Population Will Be Working Age
The nation as a whole is getting older, but not all race and Hispanic origin groups are aging at the same pace, a pattern that promises to alter the makeup of the U.S. working-age population for decades to come.
About two-thirds of the total U.S. population was working age (ages 15 to 64) in 2022 and about 17% were 65 and older.
But the non-Hispanic multiracial population, for example, had the smallest share (about 6%) of its population age 65 and older and the non-Hispanic White population the largest share (about 22%) in 2022, clear evidence that while the nation as a whole is becoming older, not all race and Hispanic origin groups are aging at the same rate.
Most race and Hispanic origin groups are projected to experience a decline in the working-age share of their populations from 2022 to 2060. However, some groups are projected to experience a larger decline in the absence of high immigration.
In this article, we use population projections to examine how the age composition of the United States would change under various immigration scenarios for different race and Hispanic origin groups.
From 2010 to 2019, the U.S. working-age population grew by only 3.1% while the 65 and older population grew by 34%. Aging baby boomers, who will all be 65 or older by 2029, and declining fertility rates are expected to contribute to a continued rise in the median age of the U.S. population.
An increasing older population and a shrinking working-age population have implications for the health care system, informal caregiving, social security programs and the economy. But increases in fertility and immigration can help mitigate the impact because a greater share of immigrants are of working age than the native-born population, and fertility rates are higher among foreign-born women than native-born women.
Age structures and immigration levels, however, differ by race and Hispanic origin, so aging may affect some groups more than others.
Last November, the Census Bureau released the 2023 National Population Projections, which project the U.S. population to 2100 based on four immigration scenarios:
- The main series, considered the most likely immigration scenario, assumes that future international immigration trends will mirror the latest trends.
- The high immigration scenario assumes a 50% increase in international immigration.
- The low immigration scenario assumes a roughly 50% decrease in international immigration.
- The zero immigration scenario assumes no international immigration and is considered a baseline for evaluating the overall contribution of immigration to population change.
The projections include demographic characteristics. Race and Hispanic origin are projected until 2060 but other characteristics like age, sex and nativity are projected to 2100.
Shrinking Working-Age Populations Projected in All Race Alone Groups
Figures 1 through 5 use the 2023 National Population Projections to show the age distribution of various race and Hispanic origin groups in 2022 and in 2060 under the four immigration scenarios.
These race and Hispanic origin groups include non-Hispanic Whites, non-Hispanic Blacks, non-Hispanic Asians, non-Hispanic Two or More Races (or multiracial) and Hispanics.
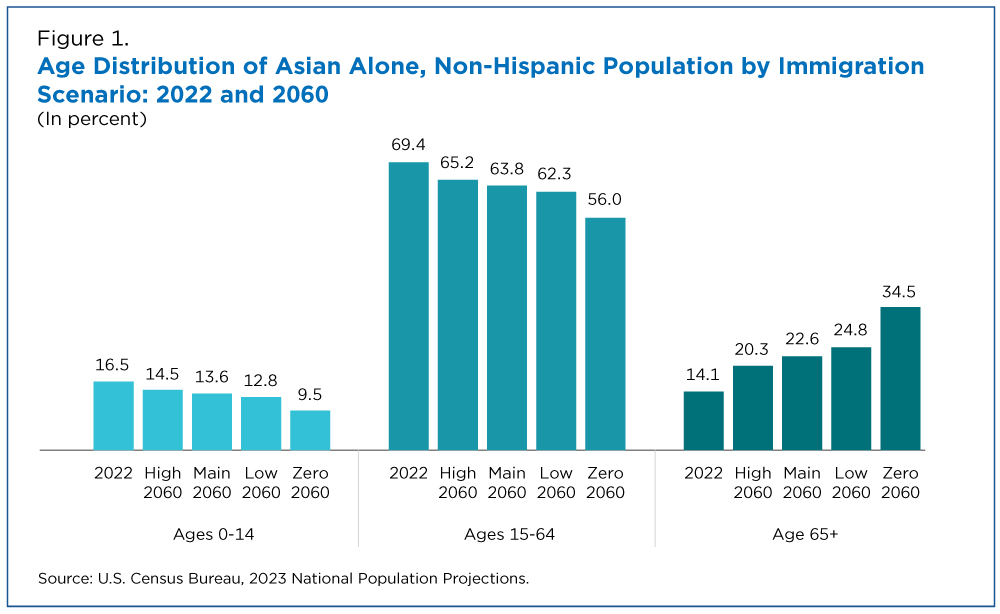
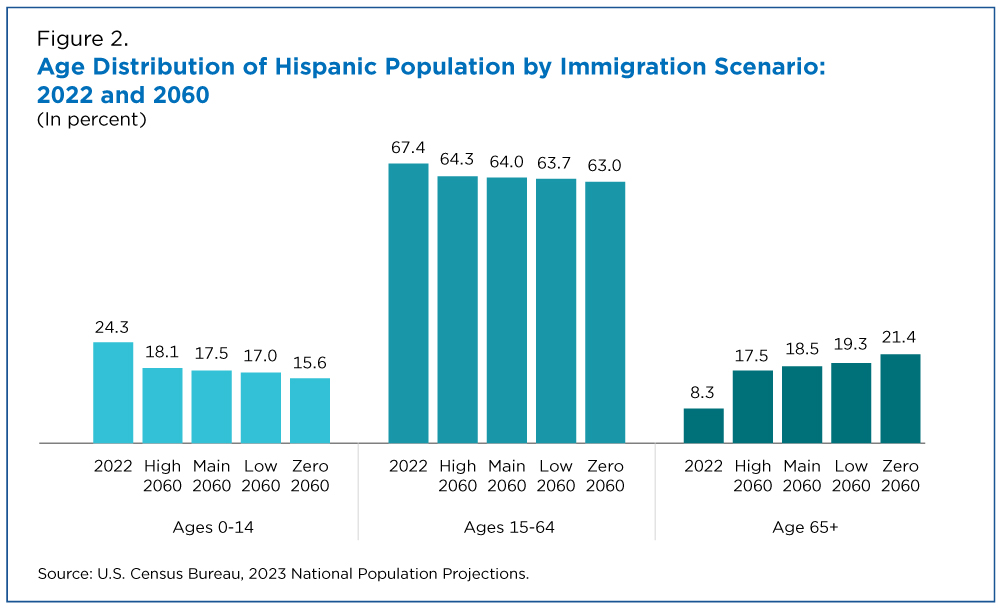
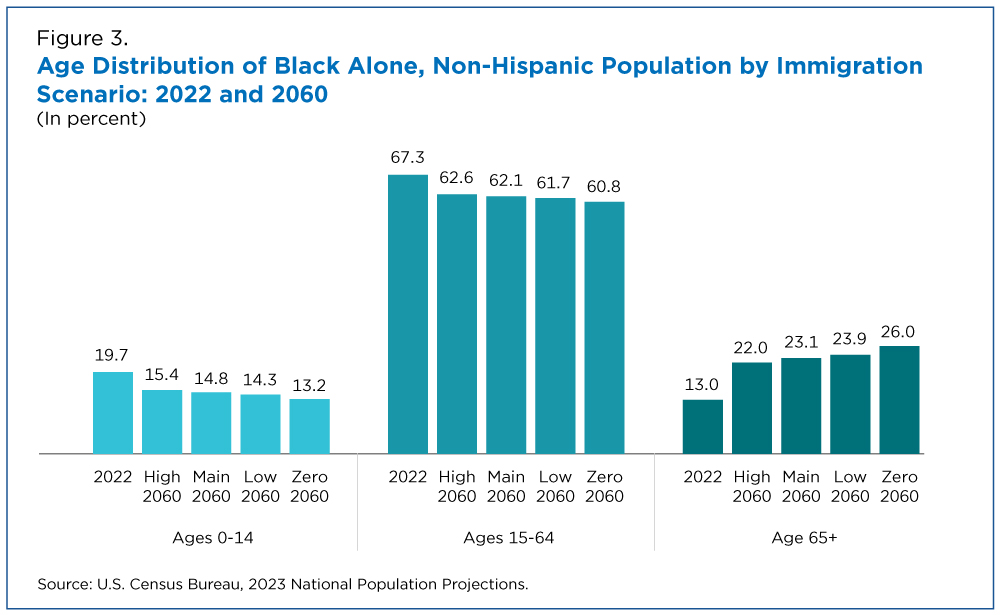
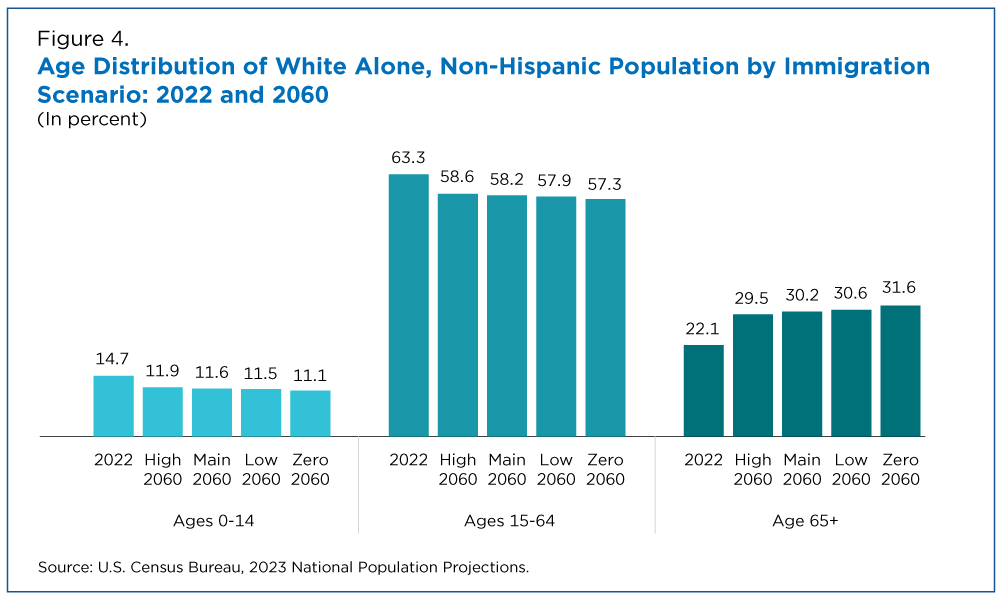
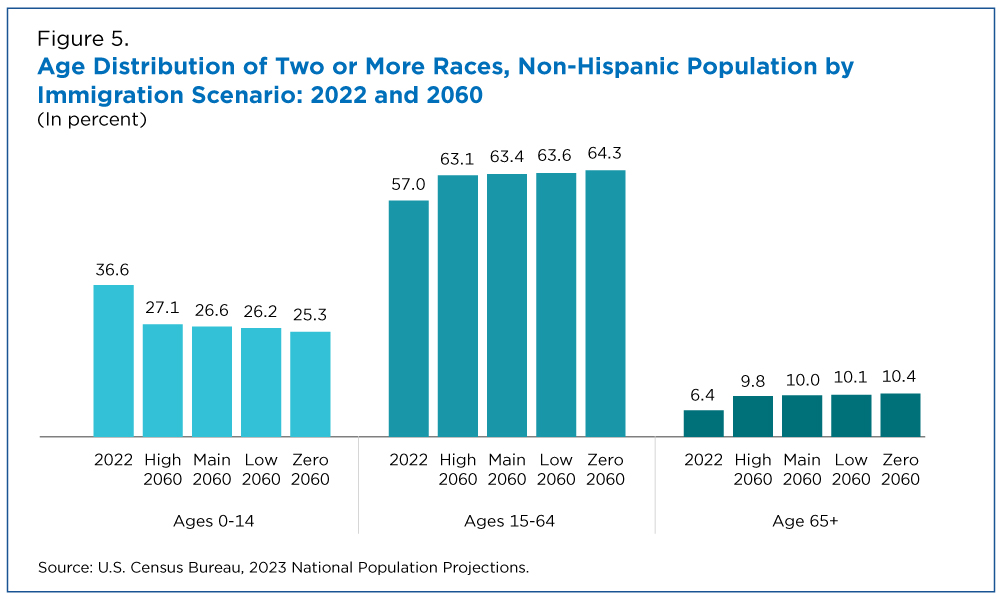
In 2022, the greatest share (70%) of the non-Hispanic Asian population was working age (Figure 1), followed by the Hispanic (Figure 2) and non-Hispanic Black populations, each with 67% (Figure 3); the non-Hispanic White population with 63% (Figure 4); and the non-Hispanic multiracial population with 57% (Figure 5).
In 2022, 22% of the non-Hispanic White population was age 65 or older, followed by the non-Hispanic Asian (14%), non-Hispanic Black (13%), Hispanic (8%) and non-Hispanic multiracial (6%) populations.
Most race and Hispanic origin groups are projected to experience a decline in the working-age share of their populations from 2022 to 2060. However, some groups are projected to experience a larger decline in the absence of high immigration.
According to the projections, future immigration flows will particularly impact the non-Hispanic Asian population’s age structure.
With high immigration, the non-Hispanic Asian working-age population would decline from almost 70% to about 65%, while the 65 and older group would increase from 14% to about 20%.
Under the low immigration scenario, the working-age population would decrease even more to 62%, and the share of older adults would go up to about 25%. Without any Asian immigration — a very unlikely scenario — the share of the working-age population for this group would drop to about 56% and the share of those 65 and older would rise to about 35%.
Other race and Hispanic origin groups are projected to follow similar patterns, but with smaller differences. The impact of immigration on the working-age and older Asian populations may be greater because such a large number of immigrants to the United States have been arriving from Asian countries, particularly China and India; Asians now outnumber Hispanics in terms of new immigrant arrivals.
Non-Hispanic Multiracial Population Only Group Projected to Have Working-Age Population Increase
Unlike other race and Hispanic origin groups, the working-age share of the multiracial population is expected to increase in each immigration scenario from 57% in 2022 to about 63% in 2060 under both the main series and high immigration scenarios, and to about 64% under the low and zero immigration scenarios.
In 2020, the multiracial population was the youngest of all race groups with a median age of 29.5 (the most common age was 12). It is projected that by 2060, over 60% of this population will be working age.
The multiracial population consisted of a just 2.4% of the foreign-born population in 2018. As a result, future immigration trends will likely have a nominal effect on the working-age share of its population.
Because the non-Hispanic multiracial population was so young, its 65 and older population is expected to remain at around 10% in 2060 — the smallest percentage of all race and Hispanic origin groups.
Projected Old-Age Dependency Ratios by Race and Hispanic Origin
One way to assess the potential “economic burden” of an aging population on the working-age population is through old-age dependency ratios: the ratio of the population age 65 and older to the population ages 15-64.
Higher old-age dependency ratios indicate a greater number of people 65 and older who, in theory, need to be supported economically by the working-age population. Table 1 shows the old-age dependency ratios by race and Hispanic origin in 2022, as well as the projected dependency ratios in 2060 for the three alternative immigration scenarios.
In 2022, the non-Hispanic White population had the highest old-age dependency ratio at 34.9. That means that every 100 people who were of working-age supported about 35 people age 65 and older. The non-Hispanic Asian population had the next highest old-age dependency ratio at 20.3, followed by the non-Hispanic Black (19.3), Hispanic (12.3) and the non-Hispanic multiracial (11.2) populations.
Although the non-Hispanic White population had the largest old-age dependency ratio in 2022, all race and Hispanic origin groups are projected to experience an increase in 2060. But future immigration will affect some groups more than others.
For example, immigration is expected to have less of an impact on the non-Hispanic multiracial population than on other race and Hispanic origin groups. For the non-Hispanic multiracial population, the old-age dependency ratio is projected to increase at a much slower pace from 11.2 in 2022. By 2060, it is projected to increase to 15.6 under the high scenario; 15.8 in the main series; 15.9 in the low scenario; and 16.2 in the zero immigration scenario.
In other words, under each immigration scenario, every 100 non-Hispanic multiracial working-age people would support about 16 people age 65 and older by 2060.
The projected old-age dependency ratios for the non-Hispanic Asian population are most affected by expected immigration levels. For this group, old-age dependency ratios are projected to increase from 20.3 in 2022 to 31.2 under the high scenario; 35.4 in the main series; 39.9 in the low scenario; and 61.5 in the zero scenario.
For this group, high immigration would lessen the economic burden on the working-age population the most, while low and zero immigration would result in the greatest economic burden on the working-age population.
The old-age dependency ratios in 2060 are also projected to increase with less immigration for all other groups:
- Non-Hispanic White population – 50.4 in the high immigration scenario; 51.8 in the main series; 52.9 in the low immigration scenario; and 55.2 in the zero immigration scenario.
- The non-Hispanic Black population is projected to have lower old-age dependency ratios than non-Hispanic White population – 35.2 in the high scenario; 37.2 in the main series; 38.8 with low immigration; and 42.7 with zero immigration.
- The Hispanic population is projected to have lower old-age dependency ratios than all race groups except the non-Hispanic multiracial population – 27.2 in the high scenario; 28.9 in the main series; 30.2 in the low scenario; and 33.9 in the zero immigration scenario.
More details about the 2023 National Population Projections are available in the method statement.
Related Statistics
Subscribe
Our email newsletter is sent out on the day we publish a story. Get an alert directly in your inbox to read, share and blog about our newest stories.
Contact our Public Information Office for media inquiries or interviews.
-
Population2020 Census: 1 in 6 People in the United States Were 65 and OverThe U.S. population age 65 and over grew from 2010 to 2020 at fastest rate since 1880 to 1890 and reached 55.8 million, a 38.6% increase in just 10 years.
-
PopulationAn Aging U.S. Population With Fewer Children in 2020The age profiles of states and communities don’t always mirror the national picture.
-
PopulationHispanic Population is Younger But Aging FasterThe Hispanic population was younger than the non-Hispanic population in 2020 and accounted for a quarter of all children under 18 in the United States.
-
Business and EconomyEconomic Census Geographic Area Statistics Data Now AvailableApril 07, 2025A new data visualization based on the 2022 Economic Census shows the changing business landscape of 19 economic sectors across the United States.
-
Income and PovertyWhat Sources of Income Do People Rely On?April 02, 2025A new interactive data tool shows income sources for hundreds of demographic and economic characteristic combinations.
-
Business and EconomyBig Improvements to the Annual Integrated Economic Survey (AIES)March 26, 2025The Census Bureau is making several changes and enhancements to capture 2024 economic data based on feedback from last year’s survey.
-
PopulationOnly 50 U.S. Counties Had Populations Over a Million in 2024March 17, 2025A new data visualization highlights U.S. counties between 1970 and 2024 whose populations ever surpassed a million.


