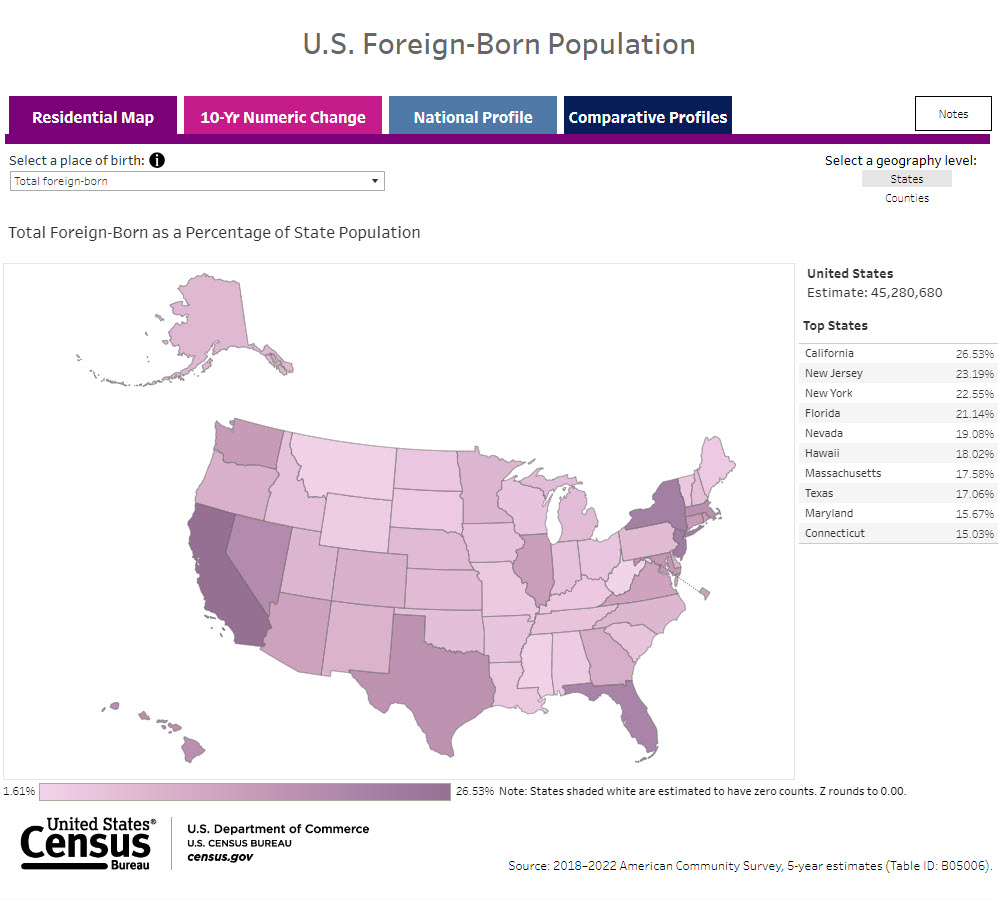
How Immigrants Have Dispersed Throughout the Country
The number of foreign-born people in the United States rose by more than 5 million over 10 years to 45.3 million or 13.7% of the nation's population, according to the 2018-2022 5-year American Community Survey (ACS) estimates.
Immigrants made up over a fifth of the population in four states: California (26.5%), New Jersey (23.2%), New York (22.6%) and Florida (21.1%).
We compare estimates for the 2018-2022 period to the 5-year ACS period a decade earlier (2008-2012) when there were 39.8 million foreign-born people, or 12.9% of the population.
A new Census Bureau visualization explores where immigrants lived in the United States and how it changed between the two five-year periods at the national, state and county level.
It also features select indicators of socio-cultural and economic integration at the national level. Data users can look at the foreign-born population overall or select a specific place of birth, including regions (e.g., Africa), sub regions (e.g., Eastern Africa) and countries (e.g., Ethiopia).
The foreign-born population consists of anyone living in the United States who was not a U.S. citizen at birth, including naturalized U.S. citizens, lawful permanent residents (immigrants), temporary migrants such as foreign students, humanitarian migrants such as refugees and asylees, and unauthorized migrants. Estimates in the data visualization exclude those born at sea.
Highlights of the foreign-born population in 2018-2022 compared to 2008-2012:
- Immigrants made up over a fifth of the population in four states: California (26.5%), New Jersey (23.2%), New York (22.6%) and Florida (21.1%). Their numbers grew in all four states over the 10-year span.
- California, Florida, New Jersey and Texas had the largest increases, with Florida and Texas each gaining more than 850,000 foreign-born people.
- New Mexico was the only state whose foreign-born population decreased during that period.
- Harris County, Texas, had the largest increase, followed by Miami-Dade County, Florida, and King County, Washington.
- The top 10 states where immigrants lived did not change, led by California, Texas and Florida in 2018-2022.
- Nine of the top 10 counties did not change, with Broward County, Florida, joining the group and Maricopa County, Arizona, leaving.
- Almost half (49.1%) of all immigrants in the United States entered the country before 2000.
- More than half (52.3%) were naturalized U.S. citizens.
- Nearly a quarter of the foreign-born population 25 years and older had a bachelor’s (18.7%) or graduate or professional degree (14.9%), compared to 21.4% and 13.1% for the native-born population.
- An estimated 63.5% were employed, with over a third of the civilian employed foreign-born population (16 years and older) in management, business, science and arts occupations.
Note: Select the image to go to the interactive data visualization.
Subscribe
Our email newsletter is sent out on the day we publish a story. Get an alert directly in your inbox to read, share and blog about our newest stories.
Contact our Public Information Office for media inquiries or interviews.
-
EmploymentThe Stories Behind Census Numbers in 2025December 22, 2025A year-end review of America Counts stories on everything from families and housing to business and income.
-
Families and Living ArrangementsMore First-Time Moms Live With an Unmarried PartnerDecember 16, 2025About a quarter of all first-time mothers were cohabiting at the time of childbirth in the early 2020s. College-educated moms were more likely to be married.
-
Business and EconomyState Governments Parlay Sports Betting Into Tax WindfallDecember 10, 2025Total state-level sports betting tax revenues has increased 382% since the third quarter of 2021, when data collection began.
-
EmploymentU.S. Workforce is Aging, Especially in Some FirmsDecember 02, 2025Firms in sectors like utilities and manufacturing and states like Maine are more likely to have a high share of workers over age 55.


