
Official websites use .gov
A .gov website belongs to an official government organization in the United States.
Secure .gov websites use HTTPS
A lock (
) or https:// means you’ve safely connected to the .gov website. Share sensitive information only on official, secure websites.

Topics
Data & Maps
Surveys & Programs
Resource Library
More Than a Quarter of People Who Live in Counties Along U.S. Southern Border Are Considered High-Risk
A significantly lower percentage of people living along the U.S.-Mexico border are living with zero risk factors than those in the nation as a whole, according to the U.S. Census Bureau’s Community Resilience Estimates (CRE).
The CRE looks at various risk factors, from income to age and health insurance coverage, to measure how resilient and how at-risk communities are to the impacts of disasters.
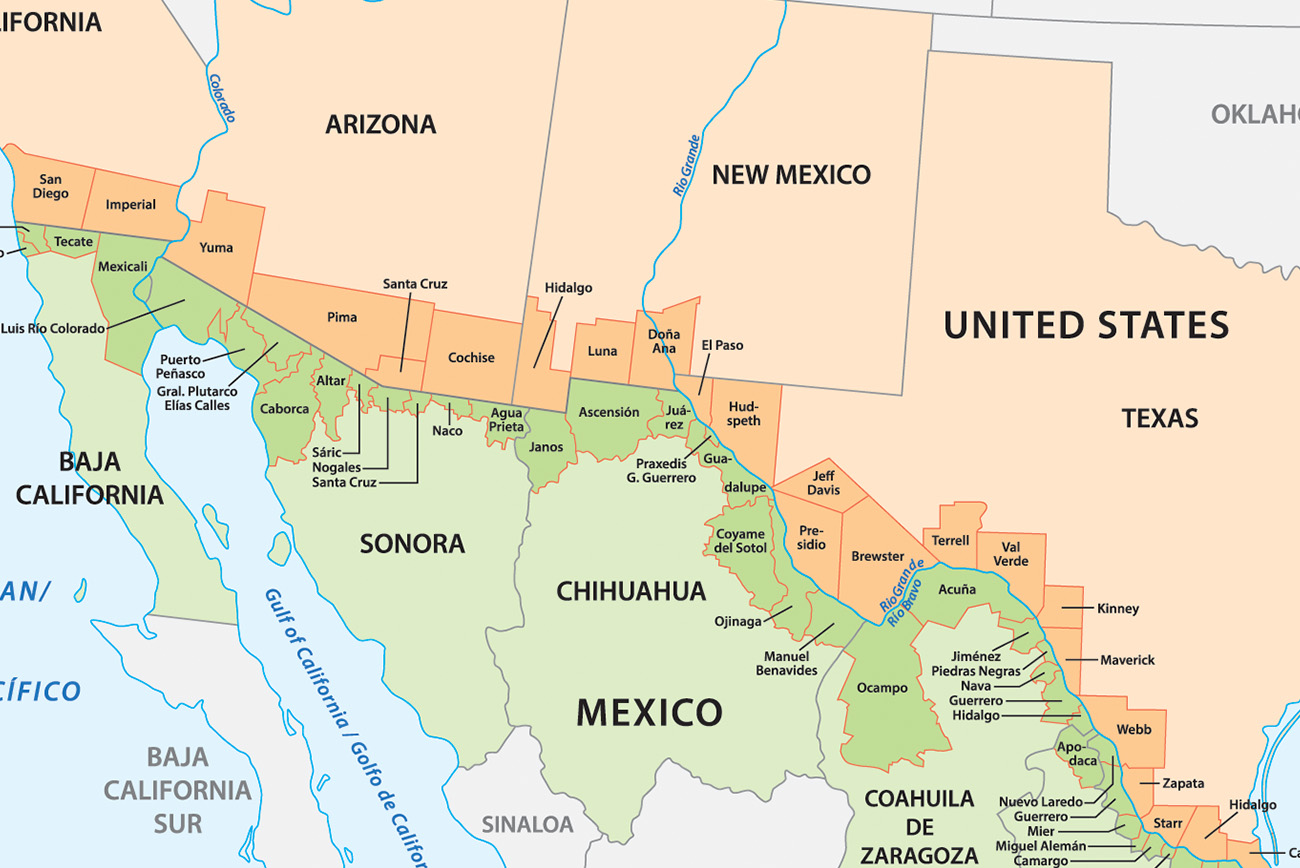
In this story, we use the Department of Health and Human Services’ U.S. Mexico Border Health Commission (USMBHC)’s definition of border.
Established by a binational executive agreement in 2000, the USMBHC was created “to identify and evaluate current and future health problems affecting the population in the United States-Mexico Border Area, and to encourage and facilitate actions to address those problems.” (Examples of this work can be found in the 2020 Healthy Border report [PDF].)
A quarter of people living in border counties are considered high-risk and the rate is higher in Texas than in two other border states – California, Arizona.
The Census Bureau launched the CRE in summer 2020 in response to the COVID-19 pandemic to provide a snapshot measurement of the risk and resilience of every neighborhood in the United States.
A quarter of people living in border counties are considered high-risk and the rate is higher in Texas than in two other border states – California, Arizona. (The rate between Texas and New Mexico was not statistically different.)
The national discussion of areas along the U.S.-Mexico border often treats these communities as monolithic. However, each area is unique with different strengths and weaknesses – variability in socio-economic profiles that can help shape health services and other policy decisions.
The CRE shows there is great variation both in the selected 44 border counties and within the four states that make up the U.S. side of the region.
Using microdata from the American Community Survey (ACS), the CRE measures the presence of high-risk individuals within a given community using a score based on 10 pre-selected risk factors:
- Household Income-to-Poverty Ratio (total family income divided by the poverty threshold) of less than 130%).
- Single or zero caregiver household with one or no individuals ages 18-64.
- Unit-level crowding (less than 0.75 persons per room).
- Communications barrier (limited English-speaking household or no one in the household over 16 with a high school diploma).
- No one in the household is employed full-time, year-round. (This is not applicable if all household residents are ages 65 years or older.)
- Disability posing constraints to daily activity. (People who report any one or more of the following six disability types: hearing, vision, cognitive, ambulatory, self-care or independent living difficulties.)
- No health insurance coverage.
- Ages 65 or older.
- Households without a vehicle.
- Households without broadband internet access.
CRE groups individuals within risk categories by the number of associated risk factors: low-risk (0), medium-risk (1-2) and high-risk (3+).
The risk estimates enable us to look at characteristics for communities down to the tract level, including those along the southern border.
The CRE provides a unique new tool for measuring this dynamic region and identifying the health concerns of all border residents.
CRE Border Counties
Based on the CRE, approximately one out of four (25.3%) people living in border counties in 2019 were considered high-risk with three or more risk factors (Figure 1).
However, this was not significantly different than the 21.6% considered to be at high-risk in the other counties in the four border states or the 21.5% share of the national population considered high-risk.

Border and non-border populations within border states shared similar estimated proportions for medium risk (48.5% vs. 48.6%), and low risk (26.1% vs. 29.8%). However, compared to all inner U.S. counties, the proportion of low-risk border residents was statistically lower (26.1%) than for the non-border residents (34.8%).
Border Counties by State
The estimated percentage of Texas border residents at high risk (34.7%) was higher than for border populations reported by Arizona (24.0%) and California (18.3%). (The difference between Texas and New Mexico’s 26.9% share of high-risk residents was not statistically significant.)
The high-risk rate for people who live in border counties in Texas was:
- 1.4 times higher than in Arizona.
- 1.9 times higher than in California.
The estimated medium-risk border population rates were comparable in Arizona (47.6%), California (50.7%), New Mexico (47.8%), and Texas (46.4%).
However, Texas had fewer people in border counties with zero risk factors: 19.0% compared to 28.4% in Arizona and 31.0% in California. (The 25.3% share in New Mexico was not statistically significant from Texas).

About CRE
Using ACS microdata, the CRE presents risk factor profiles in an easily understood metric that can be used to make informed, data-driven decisions. The most recent version of the CRE is based on the 2019 ACS with data available at the nation, state, county, and census tract levels.
This article was filed under:
-
America Counts StoryARIZONA: 2020 CensusAugust 25, 2021The Grand Canyon State’s population grew 11.9% to 7,151,502 from 2010 to 2020.
-
America Counts StoryCALIFORNIA: 2020 CensusAugust 25, 2021The Golden State’s population was 39,538,223 in 2020, a 6.1% increase since 2010 but slower than its 10% gain in the previous decade.
-
America Counts StoryNEW MEXICO: 2020 CensusAugust 25, 2021The Land of Enchantment State’s population was 2,117,522 in 2020, up 2.8% from 2010.
-
America Counts StoryTEXAS: 2020 CensusAugust 25, 2021The Lone Star State, the nation’s second-most populous after California, grew 15.9% to 29,145,505 from 2010 to 2020.
Related Statistics
-
Stats for StoriesGeography Awareness Week: November 13-17, 2023The County Business Patterns counted 992 U.S. Geophysical Surveying and Mapping establishments with 6,907 employees and a $622.6M annual payroll in 2021.
-
Program Survey Landing PageCommunity Resilience EstimatesThe Census Bureau’s CRE provide an easily understood metric for how socially vulnerable every neighborhood in the United States is to the impacts of disasters.
Subscribe
Our email newsletter is sent out on the day we publish a story. Get an alert directly in your inbox to read, share and blog about our newest stories.
Contact our Public Information Office for media inquiries or interviews.
Related America Counts Stories
-
America Counts StoryCensus Data Tool Helps FEMA Better Understand Disaster VulnerabilityMarch 15, 2022The U.S. Census Bureau’s Community Resilience Estimates (CRE) tool helps FEMA better understand “at-risk” populations during a natural disaster.
-
America Counts StoryMeasuring Communities’ Resilience in the Face of AdversitySeptember 07, 2021The Census Bureau’s Community Resilience Estimates moves from the experimental phase to a regularly published data product that will be continually updated.
-
Business and EconomyEconomic Census Geographic Area Statistics Data Now AvailableApril 07, 2025A new data visualization based on the 2022 Economic Census shows the changing business landscape of 19 economic sectors across the United States.
-
Income and PovertyWhat Sources of Income Do People Rely On?April 02, 2025A new interactive data tool shows income sources for hundreds of demographic and economic characteristic combinations.
-
Business and EconomyBig Improvements to the Annual Integrated Economic Survey (AIES)March 26, 2025The Census Bureau is making several changes and enhancements to capture 2024 economic data based on feedback from last year’s survey.
-
PopulationOnly 50 U.S. Counties Had Populations Over a Million in 2024March 17, 2025A new data visualization highlights U.S. counties between 1970 and 2024 whose populations ever surpassed a million.
Page Last Revised - March 12, 2025
✕
Is this page helpful?
 Yes
Yes
 No
No
 Yes
Yes
 No
No✕
NO THANKS
255 characters maximum
 255 characters maximum reached
✕
Thank you for your feedback.
Comments or suggestions?

Comments or suggestions?