Supplemental Poverty Measure That Accounts For Additional Government Benefits Lowest on Record at 7.8%
The U.S. official poverty rate was 11.6% in 2021, while the Supplemental Poverty Measure (SPM) dipped to 7.8%, its lowest point on record, according to U.S. Census Bureau data released today.
Each year, the Census Bureau releases two poverty estimates to provide a snapshot of economic well-being in the United States: the official poverty measure and the SPM. In 2021, the official poverty rate was not statistically different from 2020. The 2021 SPM rate, however, was 1.4 percentage points lower.
The difference in estimates shows how taxes and noncash government programs can help lift more people out of poverty.
The official poverty measure defines resources as pretax money income, which includes income sources such as earnings and social insurance programs like Social Security [PDF], Supplemental Security Income (SSI) and unemployment benefits.
The total impact of government assistance using the SPM: 45.4 million fewer people in poverty in 2021.
The SPM expands this definition by including income and payroll taxes, tax credits, stimulus payments, other noncash government benefits like the Supplemental Nutritional Assistance Program (SNAP) and housing subsidies. Necessary expenses such as child support paid, work, child care and medical expenses are deducted.
As a result, it is possible to estimate the effect of government programs on each of the measures and compare how different benefits affect poverty rates.
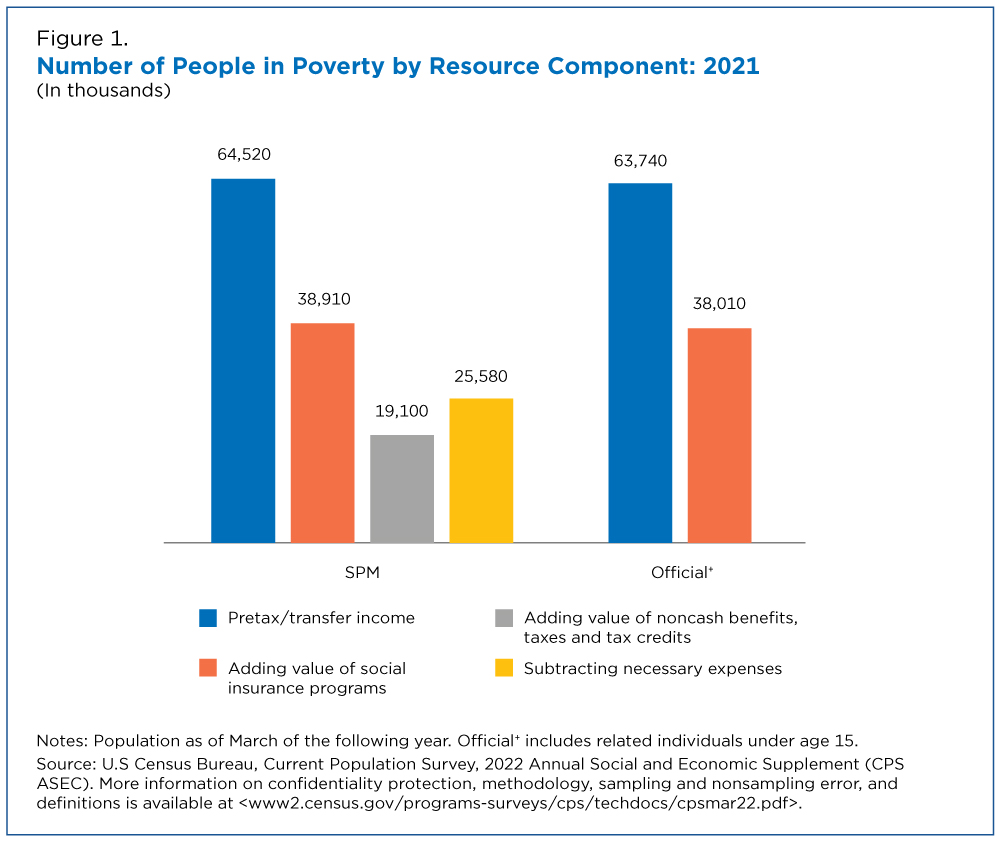
The impact of these programs on the number of people in poverty in 2021 varies (Figure 1). Both measures are shown with consistent universes that include unrelated individuals under age 15.
When focusing solely on pretax and transfer income prior to social insurance programs like Social Security, 63.7 million people were in poverty using the official poverty measure. But based on the SPM, 64.5 million people were in poverty.
This comparison shows the effect of the SPM’s broader family definition and poverty thresholds that vary geographically. This infographic provides full details on the differences between the measures.
When Social Security, SSI, and other social insurance programs are added to a family’s resources, the number of people lifted out of poverty using the SPM and official poverty measures is not statistically different: Approximately 25.6 million fewer people were in poverty using the SPM and 25.7 million fewer were in poverty using the official poverty measure. This would bring the number in poverty down to 38.9 million and 38.0 million for SPM and official poverty, respectively.
However, when the value of noncash benefits, taxes and tax credits were added to resources measured by SPM, the number in poverty dropped by half to 19.1 million.
The total impact of government assistance using the SPM: 45.4 million fewer people in poverty in 2021.
Changes Over Time
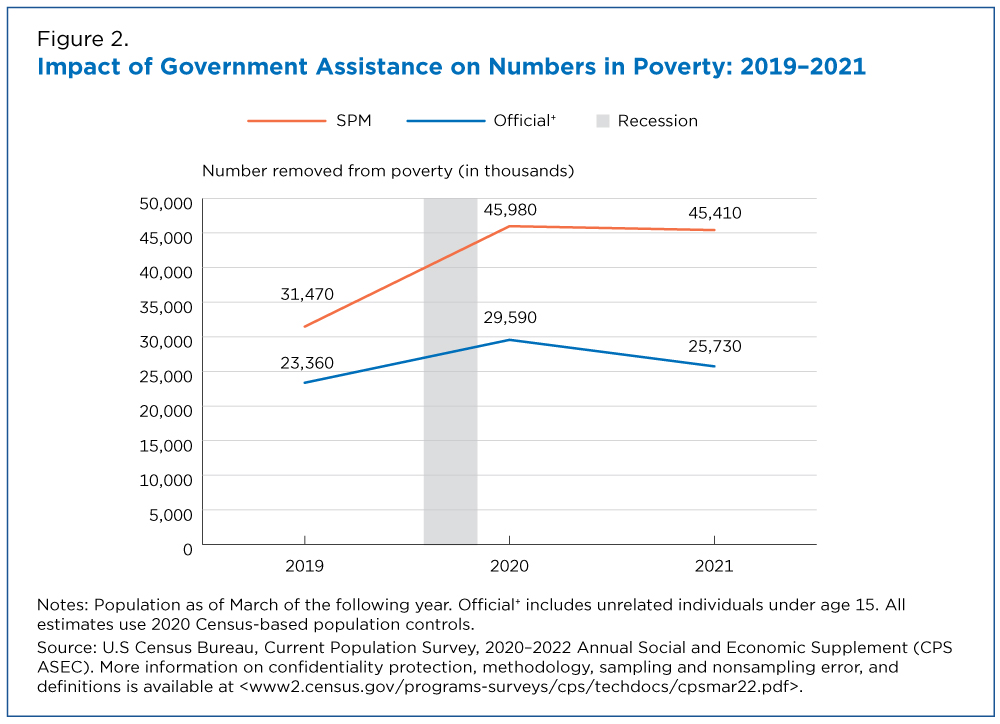
The effect of government assistance on poverty rates changed from 2019 to 2021 (Figure 2).
In 2019, government assistance helped lift 23.4 million people out of official poverty and 31.5 million people out of SPM poverty.
In 2020, the first year of the COVID-19 pandemic, government assistance removed 29.6 million people from official poverty, 6.2 million more people than in 2019. This reflects expanded unemployment benefits in response to the recession in 2020. The number of people kept out of official poverty by government assistance fell to 25.7 million in 2021.
The SPM captured the additional effect of stimulus payments, refundable tax credits and expanded school lunch and Pandemic Electronic Benefit Transfer (P-EBT) programs.
Using the SPM, 46.0 million people were lifted out of poverty in 2020, a year-over-year increase of 14.5 million people. The number of people kept out of poverty by government assistance as measured by the SPM (45.4 million) in 2021 was not statistically different from 2020.
Poverty in the United States: 2021 provides more information on the official and Supplemental Poverty Measure. Definitions and more information on confidentiality protection, methodology and sampling and nonsampling error [PDF] are available.
Related Statistics
-
Stats for StoriesNational Poverty in America Awareness Month: January 2025The Current Population Survey Annual Social and Economic Supplement reports the official poverty rate in 2023 was 11.1%, not statistically different from 2022.
-
Current Population Survey (CPS)The CPS is a monthly survey sponsored by the Bureau of Labor Statistics and conducted by the U.S. Census Bureau.
Subscribe
Our email newsletter is sent out on the day we publish a story. Get an alert directly in your inbox to read, share and blog about our newest stories.
Contact our Public Information Office for media inquiries or interviews.
-
America Counts Story2021 Income Inequality Increased for First Time Since 2011September 13, 2022U.S. Census Bureau’s income data released today show widening income inequality from 2020 to 2021.
-
America Counts StoryChild Poverty Fell to Record Low 5.2% in 2021September 13, 2022In 2021, child poverty rates measured by Supplemental Poverty Measure were the lowest since 2009 for all race and Hispanic origin categories examined.
-
America Counts StoryUninsured Rate of U.S. Children Fell to 5.0% in 2021September 13, 2022A 1.2 percentage point increase in Medicaid and CHIP coverage drove drop in children’s uninsured rate between 2020 and 2021.
-
America Counts StoryFull-Time, Year-Round Workers More Likely to be Uninsured in 2021September 13, 2022The uninsured rate of those who worked less than full time, year-round dropped 1.2 percentage points from 2020 to 2021 as public coverage increased.
-
Business and EconomyEconomic Census Geographic Area Statistics Data Now AvailableApril 07, 2025A new data visualization based on the 2022 Economic Census shows the changing business landscape of 19 economic sectors across the United States.
-
Income and PovertyWhat Sources of Income Do People Rely On?April 02, 2025A new interactive data tool shows income sources for hundreds of demographic and economic characteristic combinations.
-
Business and EconomyBig Improvements to the Annual Integrated Economic Survey (AIES)March 26, 2025The Census Bureau is making several changes and enhancements to capture 2024 economic data based on feedback from last year’s survey.
-
PopulationOnly 50 U.S. Counties Had Populations Over a Million in 2024March 17, 2025A new data visualization highlights U.S. counties between 1970 and 2024 whose populations ever surpassed a million.


