
Official websites use .gov
A .gov website belongs to an official government organization in the United States.
Secure .gov websites use HTTPS
A lock (
) or https:// means you’ve safely connected to the .gov website. Share sensitive information only on official, secure websites.

Topics
Data & Maps
Surveys & Programs
Resource Library

New Digital Equity Act Population Viewer Shows Broadband Access and Demographic Characteristics
Who in the United States has internet access, suitable devices and digital skills — and who doesn’t — is at the heart of digital equity.
In response to the Digital Equity Act of 2021, the U.S. Census Bureau today released its Digital Equity Act Population Viewer, an interactive map that shows broadband availability and use alongside demographics in every state.
The map shows the number of people who are members of the “covered populations” in the United States as defined by the Digital Equity Act, as well as the percentage of the population that lives in places where fixed broadband is unavailable, lives in households that lack a computer or broadband, and the percentage not using the internet, a PC or tablet.
This map and the underlying data are the product of a collaboration between the Census Bureau and the National Telecommunications and Information Administration (NTIA).
Understanding who the commonly underserved populations are and where they live can help fill the void in digital services.
The Census Bureau is working with NTIA to bridge the digital divide by providing federal data to inform the funding of programs to promote digital equity.
Understanding who the commonly underserved populations are and where they live can help fill the void in digital services.
Digital Equity Act of 2021
This Digital Equity Act of 2021 requires NTIA to establish grant programs to promote digital equity, support digital inclusion activities, and build capacity for state-led efforts to increase adoption of broadband by people in their communities.
The law was established by the Infrastructure Investment and Jobs Act. The State Digital Equity Planning Grant Program is the first of three Digital Equity Act programs that will be administered by NTIA.
Under the legislation, NTIA will allocate awards to participating areas, including the 50 states, the District of Columbia, and Puerto Rico based on their populations, demographics and availability and adoption of broadband.
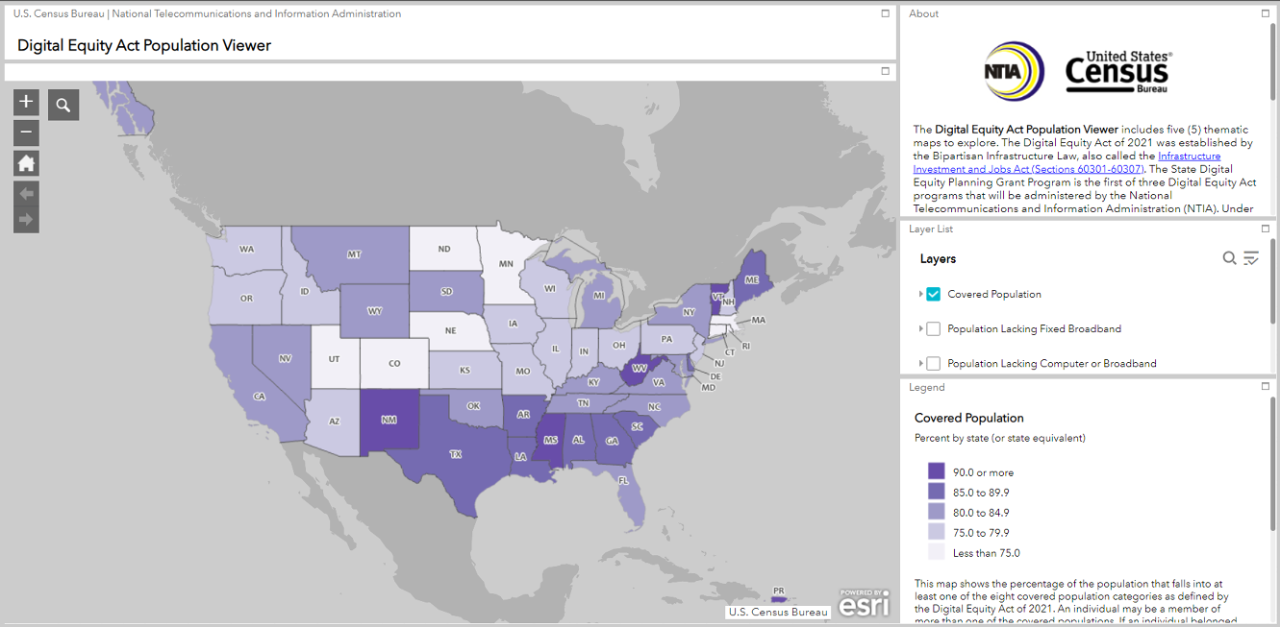
Digital Equity Act Population Viewer
This map viewer depicts the data used in NTIA’s funding allocation formula.
Twenty-five percent of the total grant amount will be based on the number of individuals in the covered populations in the eligible state in proportion to the total number of individuals in the covered populations in all eligible states.
This makes the Census Bureau’s original covered population estimates vital to the operation of this program.
The data viewer displays the factors used to determine the share of funds available to each state in the related Notice of Funding Opportunity.
Interact with the live application by clicking on the map below.
The covered population totals include individuals who fall into one or more of eight demographic categories.
These categories tend to be associated with lower levels of digital inclusion. They may lack reliable broadband services, internet-ready devices or the skills needed to connect and ensure online privacy and cybersecurity.
The eight categories are:
- Individuals living in households with incomes at or below 150% of the poverty line.
- Individuals 60 years of age or older.
- Veterans.
- Individuals living with one or more disabilities.
- Individuals with barriers to the English language (including English language learners and those with low literacy).
- Members of racial and ethnic minority groups.
- Individuals residing in rural areas.
- Individuals incarcerated in a nonfederal correctional facility.
The Census Bureau derived all but one of these estimates from the 2019 American Community Survey (ACS) 1-year estimates. If an individual belonged to at least one of these categories, they were counted as part of the population covered for funding.
The ACS does not measure levels of literacy, which required us to derive an estimate using external data. The Census Bureau generated this estimate using the Program for the International Assessment of Adult Competencies (PIACC) State and County Indicators of Adult Literacy and Numeracy.
The map displays the covered population, as well as the share of the population belonging to each of the eight constituent categories. For more details on how these estimates were generated, please consult the Technical Specification document.
Navigating the Map
To learn about the covered population in your state, view the first map labeled “Covered Population.” You will see the percentage of the population that falls into at least one of the eight covered-population categories by state as defined by the Digital Equity Act of 2021.
For example, if you live in the District of Columbia, zoom in and click on ‘DC’ and you will see a menu with numbers for:
- The total population (705,749).
- Members of the covered populations (518,700).
- The percentage of the total population who are 60 or over (17).
- Those who live in a household with income below 150% of the poverty line (18.6).
- Those who are incarcerated in a state or local correctional facility (0.4).
- Veterans (3.5).
- People who have a disability (11.6).
- Those with a language barrier (18.9).
- English learners (5.2).
- People who have low literacy (22.3).
- Racial or ethnic minorities (62.7).
- Those who live in rural areas (0).
Additionally, the tool shows other factors used in the funding formula, including the percentage of people in households lacking fixed broadband availability (2.0), in households lacking computer or broadband subscriptions (10.8), not using the Internet (14.2), and the percentage not using a PC or tablet (24.2).
This information can be found for every state and Puerto Rico. There is also a downloadable file that includes the upper and lower bounds for the estimates.
For more information on these tools, email Bethany.DeSalvo@census.gov.
This article was filed under:
Related Statistics
-
American Community Survey (ACS)The American Community Survey is the premier source for information about America's changing population, housing and workforce.
-
National Telecommunications and Information AdministrationThe CRE team is working with NTIA to gather and analyze federal data to identify underserved populations in each State.
Subscribe
Our email newsletter is sent out on the day we publish a story. Get an alert directly in your inbox to read, share and blog about our newest stories.
Contact our Public Information Office for media inquiries or interviews.
-
America Counts StoryRural and Lower-Income Counties Lag Nation in Internet SubscriptionDecember 06, 2018Nationally, 78 percent of households subscribe to the internet but households in both rural and lower-income counties lag behind.
-
America Counts StoryThe Opportunity Project Helps Streamline the Sharing of COVID ResultsMay 06, 2021The Census Bureau and Department of Health and Human Services led a technology “sprint” to create tools to capture and securely transmit COVID-19 tests data.
-
America Counts StoryMore Than Two-Thirds Access Internet on Mobile DevicesAugust 08, 2018A U.S. Census Bureau report out today shows that revised questions on computer and internet use better capture mobile access.
-
PopulationWhich States Had the Highest Shares of Newcomers?April 29, 2025Many states with the highest share of recent movers from out-of-state in 2023 had relatively small populations.
-
Business and EconomyEntertainment, Travel, and Recreation Industries ReboundingApril 23, 2025A look at which selected travel, entertainment and recreation-related industries hit hard by the pandemic rebounded.
-
Income and PovertyNew Snapshots From the Survey of Income and Program ParticipationApril 21, 2025New Census Bureau product offers mobile-friendly fact sheets on who receives income from various sources.
-
PopulationU.S. Metro Areas Experienced Population Growth Between 2023 and 2024April 17, 2025New Census Bureau population estimates show 88% of U.S. metro areas gained population between 2023 and 2024.
Page Last Revised - May 22, 2024
✕
Is this page helpful?
 Yes
Yes
 No
No
 Yes
Yes
 No
No✕
NO THANKS
255 characters maximum
 255 characters maximum reached
✕
Thank you for your feedback.
Comments or suggestions?

Comments or suggestions?