
Quarterly Services Survey Shows Pandemic Had Greater Effect on Some Health Care Services
The World Health Organization (WHO) declared COVID-19 a pandemic on March 11, 2020. After that, many doctors in the U.S. delayed elective medical procedures and Medical and Diagnostic Laboratories developed a variety of COVID-19 tests.
Did those changes have uneven economic impacts on health care operations?
They did, according to an analysis of the Census Bureau’s Quarterly Services Survey (QSS) data on doctor visits, lab and diagnostic testing, and hospital visits.
The data show that some health care industries that normally follow similar economic patterns diverged in some quarters during the pandemic.
All revenue data contained in this article are seasonally adjusted, but hospital inpatient days and discharges data are not.
The data show that some health care industries that normally follow similar economic patterns diverged in some quarters during the pandemic.
For example, before the pandemic, visiting the doctor and getting lab tests were commonly linked (Figure 1). But during the pandemic, lab testing surged higher than visits to doctors’ offices — a shift known as divergence.

While the revenue of both Offices of Physicians and Medical and Diagnostic Laboratories fell significantly in the second quarter of 2020 — down 14.9% and 10.9% respectively from the first quarter of 2020 — there was some divergence afterward.
In the third quarter of 2020, revenue for Medical and Diagnostic Laboratories increased 41.1% from the previous quarter. Nationwide COVID-19 testing was a central factor.
Revenue for the Offices of Physicians also rebounded in the third quarter of 2020, but the 12.6% quarter-to-quarter change was not as pronounced as the increase for Medical and Diagnostic Laboratories.
A Tale of Two Recoveries
By the fourth quarter of 2020 and first quarter of 2021, the percentage changes had decreased compared to the spikes in the third quarter of 2020 for both industries. However, it’s notable that revenue of Medical and Diagnostic Laboratories remained much higher than before COVID-19 (Figure 2).

Total revenue of Medical and Diagnostic Laboratories increased 9.4% from $16.8 billion in the third quarter to $18.4 billion in the fourth quarter of 2020. But it fell 4.3% to $17.6 billion in the first quarter of 2021.
Importantly, total revenue in the first quarter of 2021 was higher than the $13.4 billion in the first quarter of 2020.
The QSS estimates show that total revenue levels for Medical and Diagnostic Laboratories remain elevated during widespread COVID-19 testing in the United States. In fact, the Centers for Disease Control (CDC) Data Tracker tallied more than 375 million COVID-19 RT-PCR tests by the end of the first quarter of 2021.

In contrast, total revenue for Offices of Physicians was approximately $129.5 billion in the first quarter of 2020 and $126.7 billion in the first quarter of 2021 — a year-over-year change that is not significant (Figure 3).
This implies that the volume of routine office visits in the first quarter of 2021 weren’t much different from when the pandemic began in the first quarter of 2020. One February 2021 study by The Harris Poll found that 27% of 1,093 U.S. adults polled had delayed annual check-ups in the prior three months.
Hospital Services and Tax Breakouts
The Coronavirus Aid, Relief, and Economic Security (CARES) Act was signed into law March 27, 2020 in response to the economic uncertainties created by the COVID-19 pandemic. Subsequently, the U.S. Department of Health and Human Services (HHS) established the Provider Relief Fund program. Relief funds were distributed to the nation’s Hospitals, tax-exempt and taxable alike.
It is important to note that the QSS collects revenue differently between tax-exempt and taxable firms on its hospital survey forms.
The QSS asks tax-exempt firms to include nonoperating grant revenue in the calculation of total revenue as it’s generally a routine source of revenue for tax-exempt hospitals. However, the QSS asks taxable firms to exclude nonoperating grant revenue in the calculation of total revenue as it’s generally not a routine source of revenue for taxable hospitals.
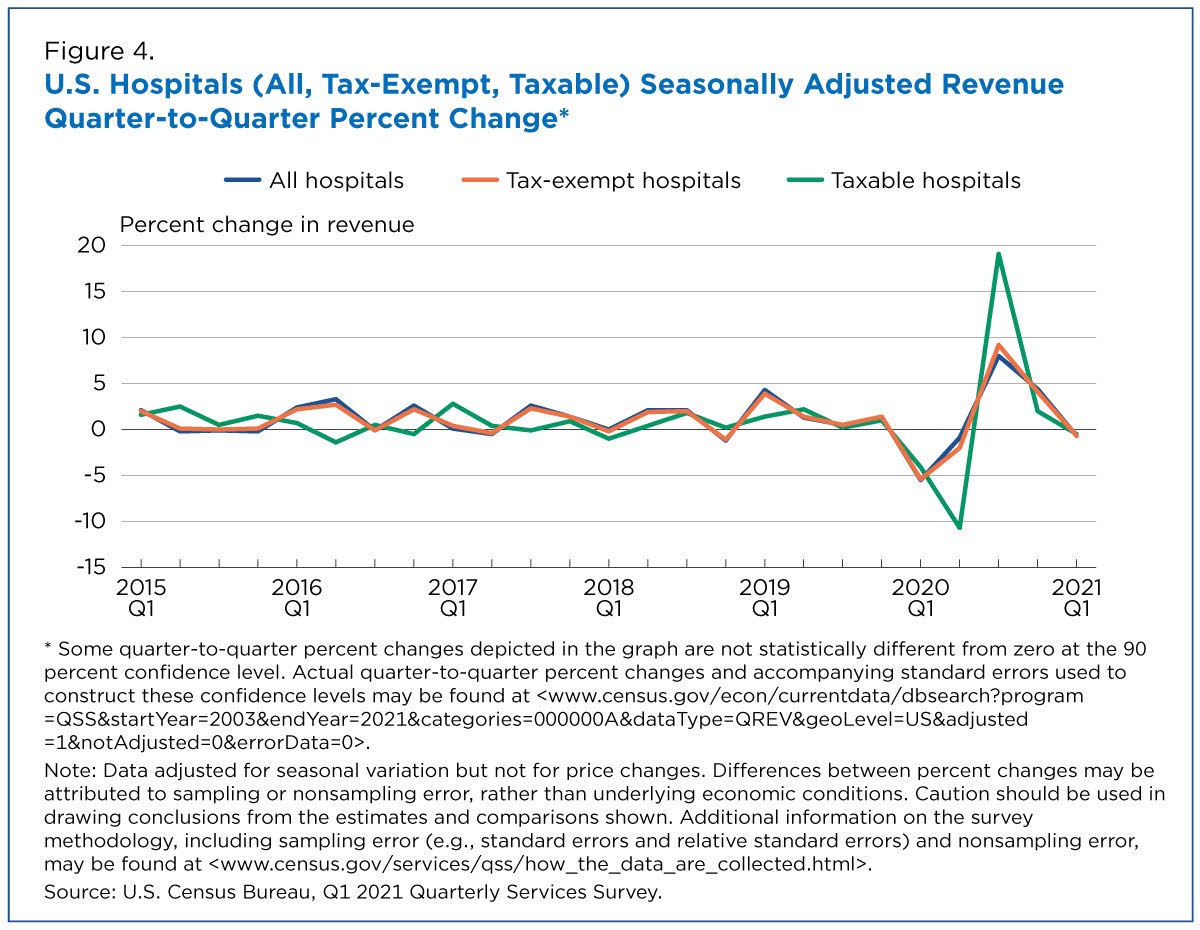
The quarter-to-quarter percentage changes for the hospital industry closely mirror its largest subset: tax-exempt hospitals that make up approximately 88% of the industry (Figure 4).
The QSS data show that revenue for tax-exempt hospitals dropped 5.5% in the first quarter of 2020. Revenue for taxable hospitals dropped 4.1% in the first quarter and another 10.7% in the second quarter of 2020.
Hospital revenue increased significantly in the third quarter of 2020 with taxable hospitals up the most with a 19.1% increase from the second quarter of 2020. By the first quarter of 2021, total revenue for the hospital industry was up 10.6% compared to the first quarter of 2020.
Hospital Inpatient Days and Discharges
Based on the revenue growth, one might think that year-over-year percentage increases in revenue would mean more volume for America’s hospitals. The QSS data tell a different story.
For QSS, inpatient days measure the length of a hospital stay during which services were provided to inpatients. A discharge is the formal release of the patient (including those admitted and discharged on the same day).
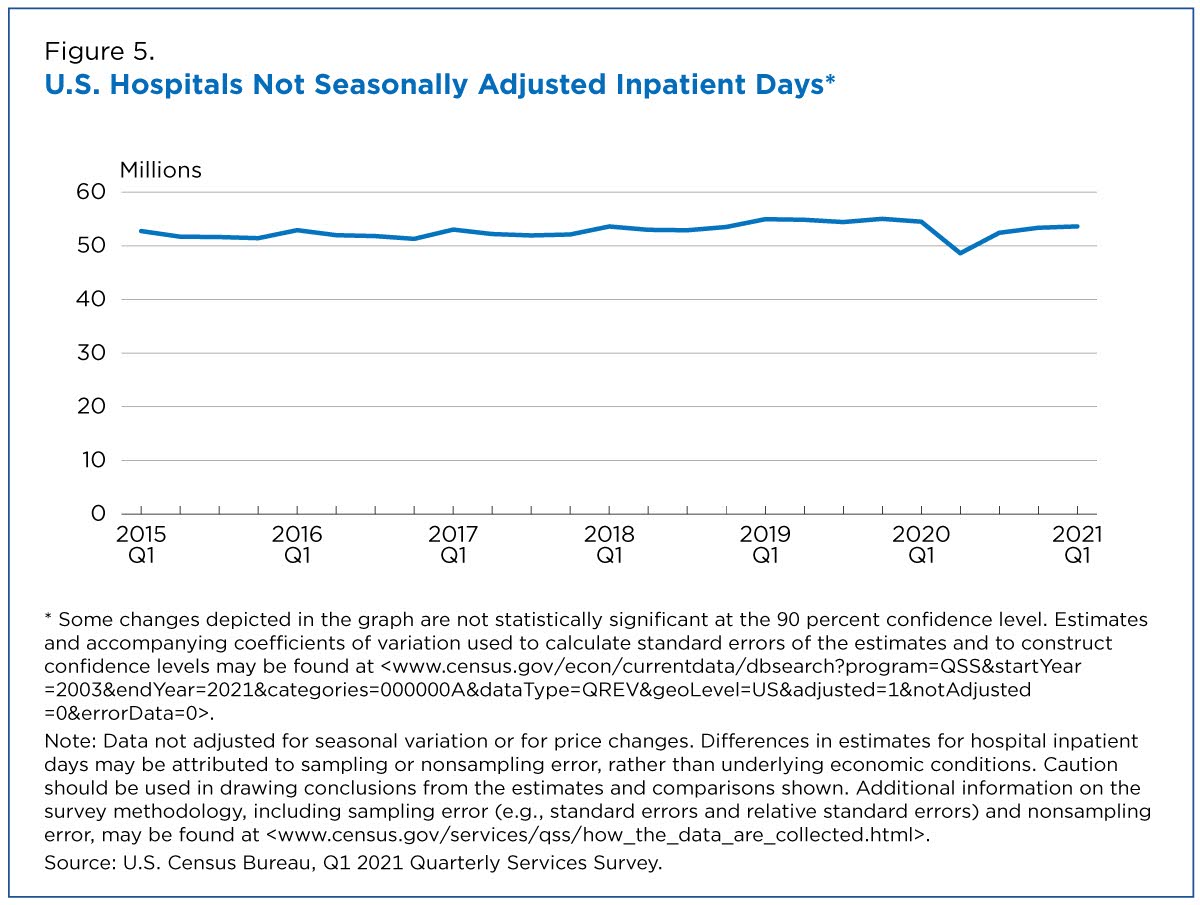
Hospital inpatient days dropped from approximately 54.5 million in the first quarter of 2020 to 48.6 million in the second quarter of 2020 – a decrease of 10.8%. The decline could be due to fewer elective surgeries being scheduled during the early part of the pandemic as recommended by the Centers for Medicare & Medicaid Services (CMS).
By the first quarter of 2021, inpatient days were 53.6 million (Figure 5).
Hospital discharges dropped 15.9% from approximately 9.5 million in the first quarter of 2020 to 8.0 million in the second quarter of 2020. By the first quarter of 2021, there were 8.7 million discharges (Figure 6).

QSS data indicate that hospital revenue percentage change was up in the first quarter of 2021 from the first quarter of 2020. However, hospital inpatient days and discharges show that volume wasn’t significantly different year-over-year. Some private sector reports support this result as hospital volume metrics, particularly emergency room visits, continued to lag.
The health care industries above demonstrate how the COVID-19 pandemic has unevenly affected a key sector in the U.S economy — a sector facing one of its greatest public health challenges in decades.
Justin Jarrett is a survey statistician in the Census Bureau’s Economic Indicators Division.
Subscribe
Our email newsletter is sent out on the day we publish a story. Get an alert directly in your inbox to read, share and blog about our newest stories.
Contact our Public Information Office for media inquiries or interviews.
-
America Counts StoryHealth Care Still Largest U.S. EmployerOctober 14, 2020The 2018 County Business Patterns show that health care employs the most but Professional, Scientific, and Technical Services saw the largest payroll increase.
-
America Counts StoryWho Had Medical Debt in the United States?April 07, 2021Detailed tables from the Census Bureau’s Survey of Income and Program Participation provide a snapshot of households more likely to have medical debt in 2017.
-
America Counts StoryNot All Industries Experienced Declines During the PandemicJune 08, 2021Estimates from the Census Bureau’s Quarterly Services Survey show that some industries grew despite the pandemic while others saw declining revenue.
-
Small BusinessCensus Bureau Data Tell the Small Business StoryMay 04, 2026The 63rd Annual Small Business Week recognizes small businesses’ contribution to the nation’s economy.
-
Families and Living ArrangementsOver a Third of Partners in Opposite-Sex Couples Were the Same AgeApril 27, 2026A new interactive data visualization explores characteristics of opposite-sex married and unmarried couples who lived together in 2025.
-
PopulationEight of the Nation’s Top 15 Last Names Stayed the Same Since 1790April 14, 2026Newly released names data from the 2020 Census show which first and last names are the most popular across the nation.
-
AgeU.S. Population Aging as Nation Turns 250April 09, 2026New population estimates show women still outnumbered men at older ages, but the gap is narrowing due to lower mortality rates and historical factors.