
Official websites use .gov
A .gov website belongs to an official government organization in the United States.
Secure .gov websites use HTTPS
A lock (
) or https:// means you’ve safely connected to the .gov website. Share sensitive information only on official, secure websites.

Topics
Data & Maps
Surveys & Programs
Resource Library
Growth in the Desert Southwest Mirrors the Nation in Some Economic Sectors but Is Quite Different in Others
The Desert Southwest region has long set a dizzying pace for population growth, expanding by at least twice the national average every decade from 1950 and 2010.
Does business growth in this region mirror this population change? In a word — yes.
Driven by big, growing counties and fueled by industries such as health care and information, the Desert Southwest outpaced national averages for adding businesses and employees from 2015 to 2019, according to the Census Bureau’s 2019 County Business Patterns (CBP) program.
Health care — the region’s second largest employer with 723,263 workers — was one of the driving forces behind business growth in the Desert Southwest.
Population Growth in The Desert Southwest
The Desert Southwest region includes 40 counties spanning five states: California, Arizona, Nevada, New Mexico and Texas. Like the population, businesses in this region are concentrated in a small number of key counties, including:
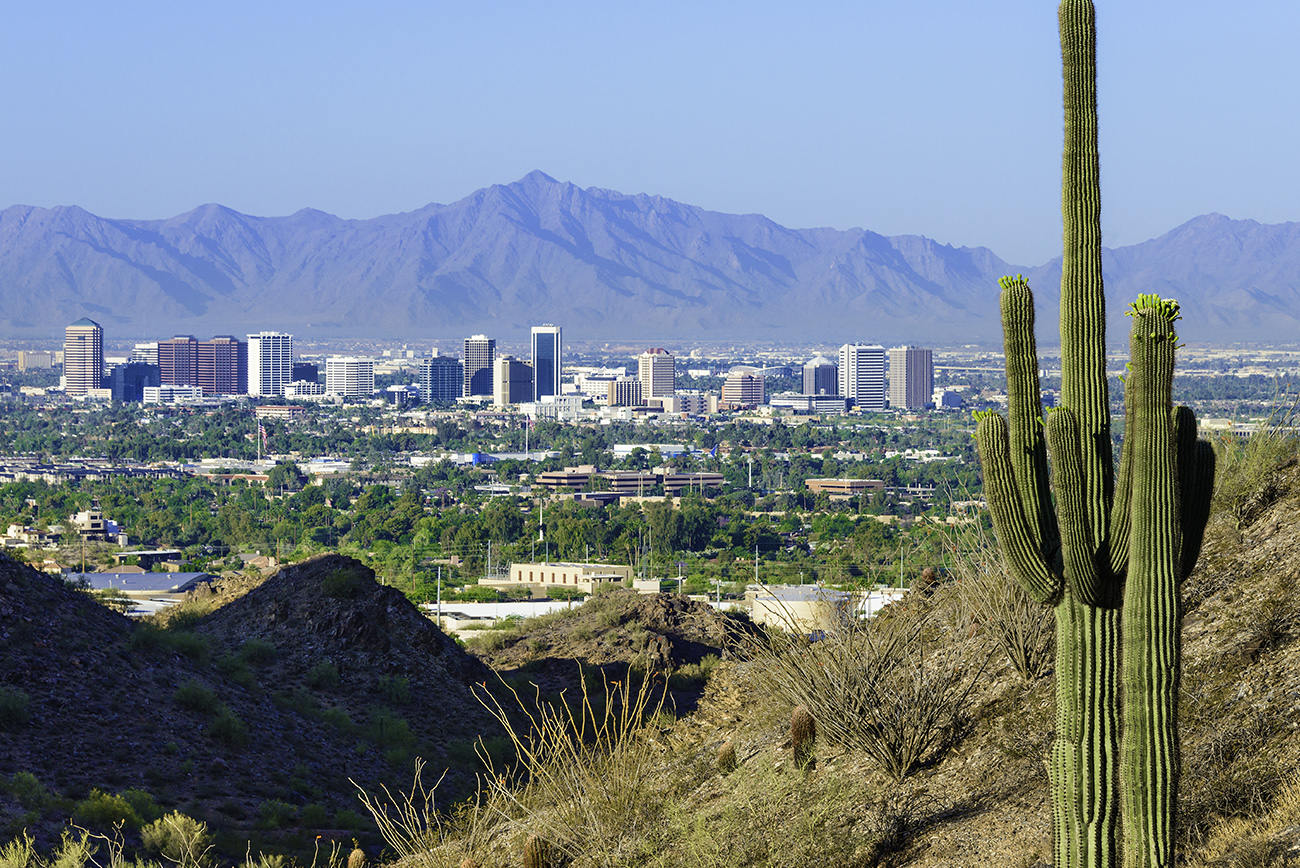
- Maricopa County, Arizona, home to Phoenix.
- Clark County, Nevada, which includes Las Vegas.
- Riverside County, California, which includes Riverside and resort cities such as Palm Springs.

These cities and counties all experienced tremendous population growth from 2010 to 2020, according to the 2020 Census. Recently released 2020 Census redistricting data shows that Phoenix, a driving force in the region, was the fastest growing big city, leapfrogging Philadelphia to become the fifth-largest city in the nation.
Maricopa’s population increased by 15.8%, Clark County grew by 16.1%, and Riverside County grew by 10.4% over the decade.
Business Growth in The Desert Southwest
Census data can be used to better understand business growth in the region, too.
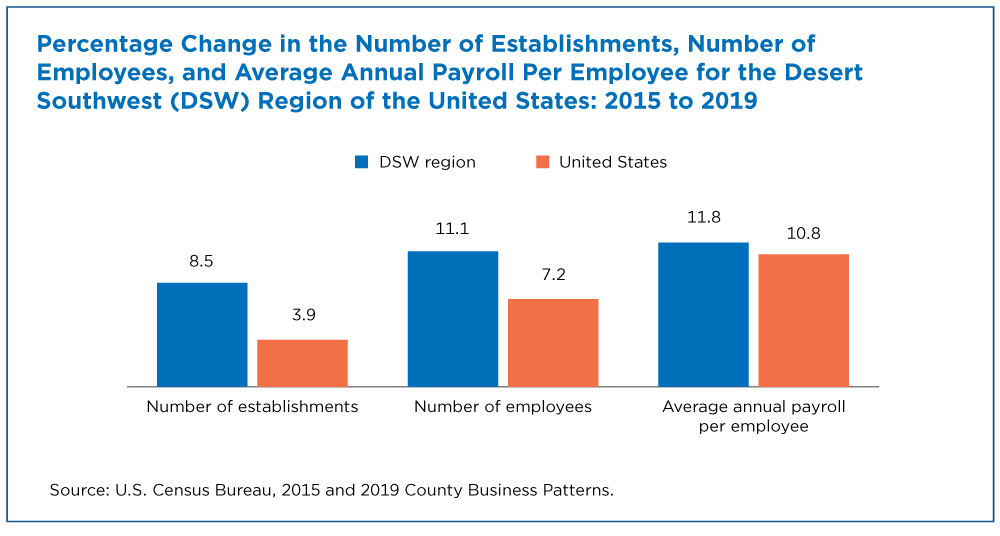
According to 2019 County Business Patterns data, 287,381 employer businesses (those with one or more paid employees) called the Desert Southwest (DSW) home in 2019 — 8.5%, or 22,537 establishments more than four years earlier. During the same period, the number of establishments in the U.S. rose 3.9%.
Published annually, CBP covers employer businesses in nearly every two- to six-digit North American Industry Classification System (NAICS) code. It includes data down to the county and ZIP Code levels, and breakouts by business size and legal form of organization.
These data show that employment growth in this region was also higher than the national average. Desert Southwest businesses employed 4.9 million workers in 2019, up 492,433 or 11.1% since 2015; U.S. employment grew 7.2% during the same period.
The growth in the average annual payroll per employee for l businesses in this region was also slightly higher than the national average. Workers in this region earned an average of $47,019 annually in 2019, up $4,963 (11.8%) from 2015. The U.S. average annual payroll per employee went up 10.8% from 2015 to 2019.
Business Growth Does Not Always Mean Large Salary Gains
Most of the businesses in the Desert Southwest, and business growth, were concentrated in five key counties. But these same counties did not have the highest average salaries or salary growth.
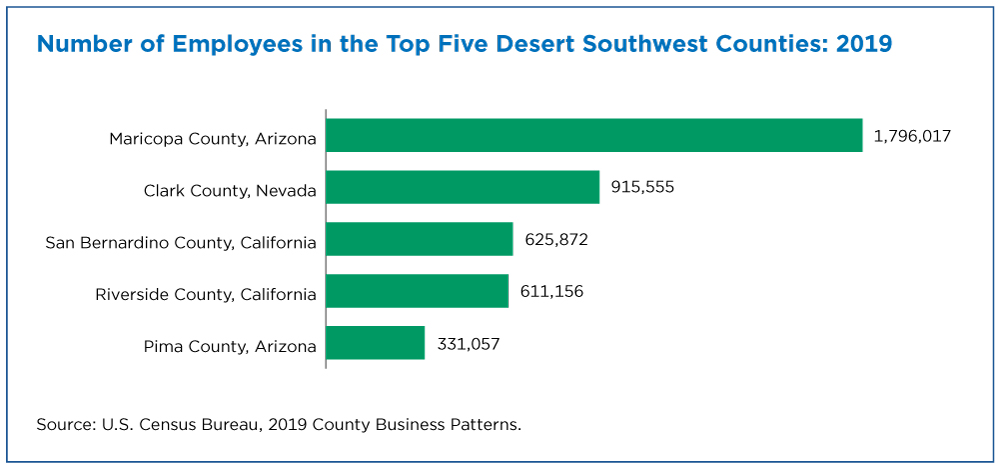
The majority of employer establishments in the Desert Southwest (243,431 or 84.7% of 287,381) in 2019 were in five key counties: Maricopa and Pima in Arizona, Clark in Nevada, San Bernardino and Riverside in California. That’s up from 84.1% in 2015.
These top five counties also dominated the region in total employment with nearly 4.3 million employees, 86.7% of the region total. The region’s share of employees inched up from 86.1% in 2015.
Maricopa County added the most establishments (9,070 or up 10.2%) and employees (224,704 or up 14.3%) in the region from 2015 to 2019.
But the region’s top five counties were not its top payers in 2019. Only Maricopa County’s average annual payroll per employee ($53,032) was above the region average of $47,019.
In contrast, the 184 business establishments in Winkler County, Texas, reported a higher average annual payroll per employee of $85,025 in 2019.
Businesses in Culberson County, Texas, reported larger increases in average annual payroll per employee in both dollar amount ($26,525) and percentage (96.0%).
Top Economic Sectors in the Region
Health care — the region’s second largest employer with 723,263 workers — was one of the driving forces behind business growth in the Desert Southwest. (Health care was the nation’s biggest employer in 2019.)
This sector saw the region’s biggest increase in employment, up 94,975 (11.4%) from 628,288 in 2015 to 723,263 in 2019.
It also added the most establishments (3,707) in the region during this period, although not every county in the region gained businesses in this sector — 11 counties experienced a decrease.
Maricopa County added the most health care businesses (1,605), which represents 43.3% of the total region increase. Maricopa also gained the most health care workers (35,094) or 37.0% of the total increase.

The Information sector is another key employer:
- This sector saw the greatest percentage increase in the number of establishments in the region, up 22.9% from 3,975 in 2015 to 4,887 in 2019. In comparison, this sector grew by 14.2% for the nation.
- Ten counties in the region saw increases of at least 30% in the number of Information sector establishments. Among them: El Paso County, Texas, 67 establishments (up 37.2%); Maricopa County, 374 establishments (up 26.7%); and Clark County, 176 (up 21.2%).
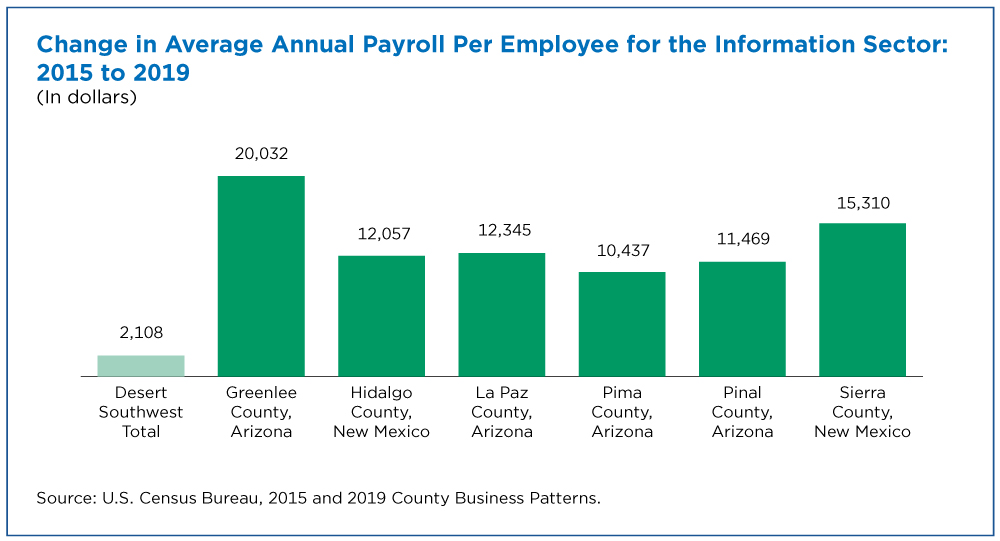
- This sector had a modest increase in average annual payroll per employee, $2,108 or 3.2% from 2015 to 2019. Six counties in this region (of the published counties) saw average annual payroll per employee increases of more than $10,000 in this sector, with information sector workers in Greenlee County, Arizona, gaining an average $20,032.
Other key industries in the region:
- Accommodation and Food Services was the region’s No. 1 employer with 790,668 workers. The top five counties listed above accounted for over 82.9% of the region’s employment in this sector. Clark and Maricopa counties had 276,059 and 207,957 workers, respectively, in this sector alone.
- The Retail Trade sector ranked second in the number of establishments in this region (36,218).
- Construction had the region’s highest percentage increase in employment, up 25.6% from 282,820 in 2015 to 355,158 in 2019. Cochise County, Arizona, had the highest percentage increase in construction workers (up 50.6% or 570 workers), and Maricopa County had the largest numeric gain, up 30,284 (30.7%).
- The Utilities sector reported the region’s highest average annual payroll ($107,918) per employee. Utilities businesses in Ector County, Texas, had one of the highest reported average annual payroll ($121,879) per employee in the region.
- Management of Companies and Enterprises was ranked second in average annual payroll per employee at $83,450. It was the nation’s top-paying sector at $114,474.
2019 and Beyond
While much of the business growth in this region was concentrated in larger counties, some smaller and more rural counties (like Winkler County, Texas) stand out in percentage change.
The comparisons between the U.S. and this region become even more interesting when we consider the business mix in the region versus the nation. Some sectors (like health care) in this region mirror national trends while others (like Construction) differ.
Census Bureau surveys like the Small Business Pulse Survey and Business Formation Statistics provide a glimpse of the coronavirus pandemic’s effect on businesses in this region. But users will have to wait until more detailed data by industry and county are available to gauge its full impact.
(Please note some estimates provided in this article may exclude counties whose data were suppressed due to nonsampling error and/or disclosure avoidance methods used to protect the confidentiality of the data. As a result, data users should exercise caution when using and interpreting these estimates.)
Andrew W. Hait is a survey statistician/economist at the Census Bureau.
This article was filed under:
Subscribe
Our email newsletter is sent out on the day we publish a story. Get an alert directly in your inbox to read, share and blog about our newest stories.
Contact our Public Information Office for media inquiries or interviews.
-
America Counts StoryFast Growth in the Desert Southwest ContinuesFebruary 11, 2019One of the most arid parts of the country has enjoyed population growth of more than 40 percent in three different decades since 1950.
-
America Counts StoryMore Than Half of U.S. Counties Were Smaller in 2020 Than in 2010August 12, 2021The U.S. Census Bureau today released the first 2020 Census population counts for counties, metropolitan and micropolitan statistical areas, and cities.
-
America Counts StoryEconomic Census: Measuring a Changing AmericaFebruary 04, 2020Results from the 2017 Economic Census are being released on a flow basis. A new interactive map helps tracks state and sector data released so far.
-
Business and EconomyEconomic Census Geographic Area Statistics Data Now AvailableApril 07, 2025A new data visualization based on the 2022 Economic Census shows the changing business landscape of 19 economic sectors across the United States.
-
Income and PovertyWhat Sources of Income Do People Rely On?April 02, 2025A new interactive data tool shows income sources for hundreds of demographic and economic characteristic combinations.
-
Business and EconomyBig Improvements to the Annual Integrated Economic Survey (AIES)March 26, 2025The Census Bureau is making several changes and enhancements to capture 2024 economic data based on feedback from last year’s survey.
-
PopulationOnly 50 U.S. Counties Had Populations Over a Million in 2024March 17, 2025A new data visualization highlights U.S. counties between 1970 and 2024 whose populations ever surpassed a million.
Page Last Revised - April 8, 2024
✕
Is this page helpful?
 Yes
Yes
 No
No
 Yes
Yes
 No
No✕
NO THANKS
255 characters maximum
 255 characters maximum reached
✕
Thank you for your feedback.
Comments or suggestions?

Comments or suggestions?