
Official websites use .gov
A .gov website belongs to an official government organization in the United States.
Secure .gov websites use HTTPS
A lock (
) or https:// means you’ve safely connected to the .gov website. Share sensitive information only on official, secure websites.

Topics
Data & Maps
Surveys & Programs
Resource Library

Does Bank Revenue Come Mostly From Fees or Interest? The 2017 Economic Census’ Miscellaneous Subjects Answer This and Other Intriguing Questions
One of the more obscure parts of the 2017 Economic Census — the Miscellaneous Subjects reports — may be one of the most intriguing, providing nuggets of data not available anywhere else like the number of full-service restaurants in every state that use e-menus (13,026).
Miscellaneous Subjects reports are among the last on the Economic Census’ rolling data release schedule, which is why users are more familiar with the state and local area information that’s released first and is at the core of the survey.
Of the 5,027 full-service restaurants in Colorado in 2017, for example, 379 (7.5%) offered electronic devices their customers could use to order or pay their tab.
But this lesser-known section provides interesting statistics on dozens of topics for nearly every sector of the economy.
The U.S. Census Bureau started releasing the Miscellaneous Subjects tables late last year on data.census.gov and all tables will be published by this September.
We mined the tables for some of the most interesting gems.
Self-Service E-Menus
Miscellaneous Subjects include statistics on electronic devices in restaurants that allow customers to order their own meals.
This technology has been especially popular during the pandemic because it allows diners to minimize their contact with restaurant staff. However, these devices are not new; in 2017, 13,026 of the 250,843 or 5.2% of the nation’s Full-Service Restaurants offered this convenience. These restaurants employed 452,067 workers and generated $24.3 billion in sales.
Of the 5,027 full-service restaurants in Colorado in 2017, for example, 379 (7.5%) offered electronic devices their customers could use to order or pay their tab.

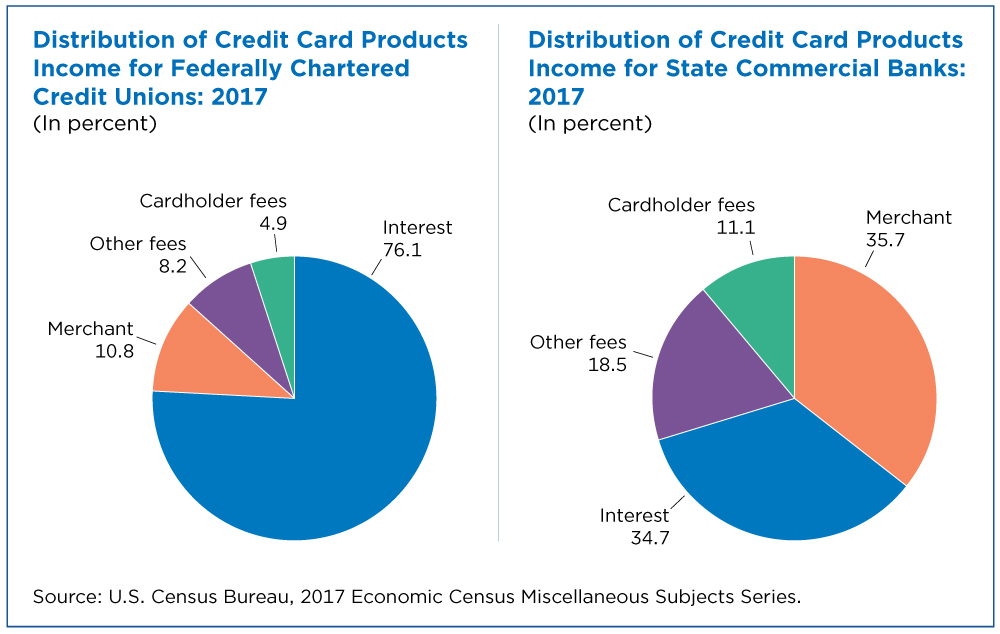
Credit Card Income
Want to know how much credit card income contributes to the total revenue of banks and financial organizations?
In 2017, 76.1% of the total revenue of Federally Chartered Credit Unions came from interest they earned on credit cards they issued. But only about a third (34.7%) of the revenue of State Commercial Banks came from credit card interest.
Fees from merchants, cardholders and others made up a much larger share of revenue for state commercial banks than credit unions.
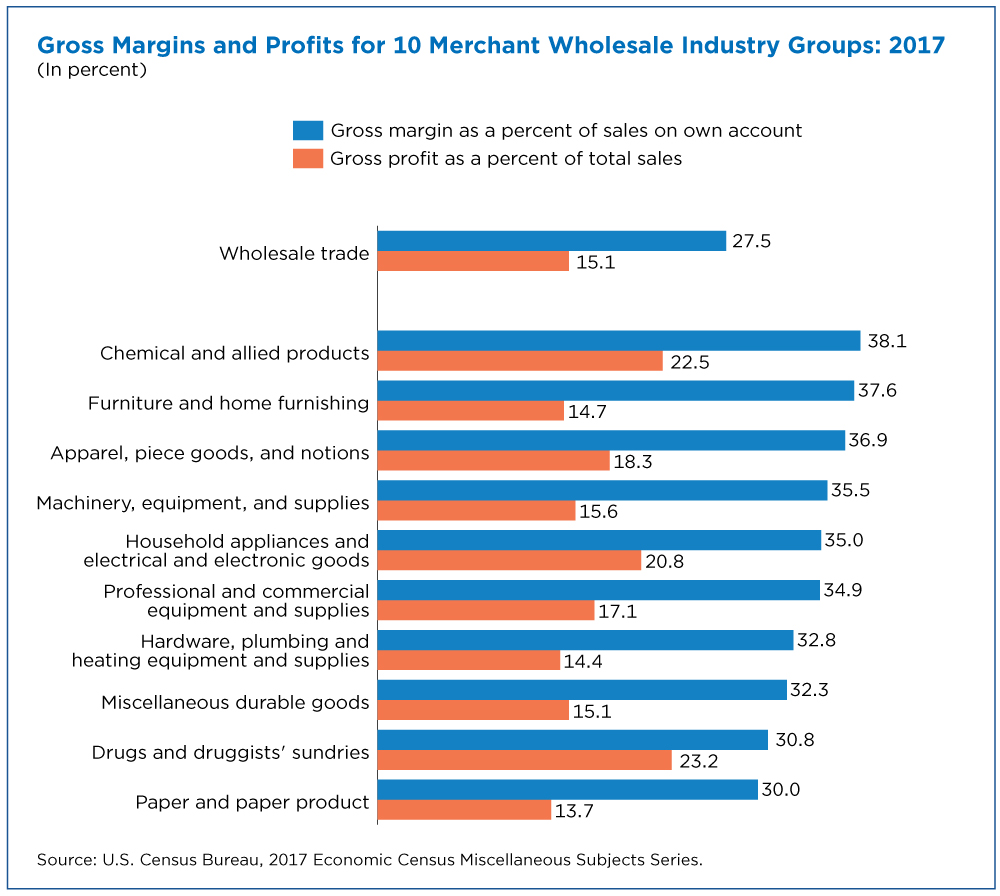
Profits and Margins
Miscellaneous Subjects tables are among the few Census Bureau sources that provide data on profits and margins — sales minus the cost of producing goods or providing services.
U.S. merchant wholesalers (excluding manufacturers’ sales branches and offices) had total sales of $5,701.0 billion and gross profit of $862.9 billion (15.1% of total sales) in 2017. They sold $5,688.5 billion of goods they own, and their gross margin was $1,563.7 billion (27.5% of sales).
Among the four-digit 2017 North American Industry Classification System (NAICS) industries in this merchant wholesalers category, Drugs and Druggists’ Sundries Merchant Wholesalers had the highest percentage of gross profit as a percent of total sales (23.2%). Chemical and Allied Products Merchant Wholesalers had the highest percentage of gross margin as a percent of own-account sales (38.1%).
Miscellaneous but Interesting Facts
- From which types of patient care do health care businesses get their revenue?
- More than half (53.3%) of the revenue of Offices of Physicians came from visits and consultations in 2017, while only 33.9% of the total revenue of Outpatient Care Facilities came from visits and consultations (and the rest from surgical and nonsurgical interventions and other types of patient care).
- Despite advances in online news media, 84.5% of the total revenue of Newspaper Publishers in 2017 still came from sales of print subscriptions.
- Only 69.1% of the revenue of Periodical Publishers came from print subscriptions (and the rest from online and other dissemination media subscriptions).
- U.S. businesses often have revenue from U.S. and international customers. The 2,649 Scientific Research and Development Services establishments that are subject to federal income tax reported $12.7 billion in revenue from exported services in 2017.
- This accounts for 38.6% of the $32.8 billion in total sales of the businesses in this industry that reported exported services.
- How important are online courses (and other modes of instruction) to training businesses?
- Computer Training businesses got 18.5% of their revenue from online courses and self-paced study modules (like correspondence courses). An additional 12.8% came from instructor-led, real-time online learning.
- Who are the various customers critical to different types of businesses?
- In 2017, federal government agencies, for example, made up 37.6% of the revenue of Hazardous Waste Treatment and Disposal businesses and 53.8% came from other business firms and farms.
- The amount of money businesses charge their customers to cover their labor costs (versus other costs of doing business) varies widely by type of business.
- Labor costs made up 86.9% of the revenue of Car Washes, for example, but only 34.2% of the revenue of Automotive Glass Replacement Shops.
These Miscellaneous Subjects tables can be invaluable to businesses trying to grow their markets because they allow them to compare to other similar businesses.
They can also be useful to chambers of commerce and other economic development organizations trying to gauge the impact of businesses in their community on other businesses and their local economy as a whole.
Note: Comparative statements made in the text of this article have not undergone statistical testing since measures of statistical error were not calculated for estimates on these reports. Therefore, they should be interpreted with caution. Differences between estimates may be attributed to sampling or nonsampling error, rather than to differences in underlying economic conditions. Caution should be used in drawing conclusions from the estimates and comparisons shown. Additional information on the survey methodology, including sampling error and nonsampling error, may be found on the economic census website.
Andrew W. Hait is a survey statistician/economist at the Census Bureau.
Subscribe
Our email newsletter is sent out on the day we publish a story. Get an alert directly in your inbox to read, share and blog about our newest stories.
Contact our Public Information Office for media inquiries or interviews.
-
America Counts StoryEarly COVID Impact on U.S. Economy More Widespread Than on MortalityMarch 08, 2021Census Bureau research shows the pandemic initially had a more widespread impact on the economy than on mortality rates.
-
America Counts StoryNot All Industries Experienced Declines During the PandemicJune 08, 2021Estimates from the Census Bureau’s Quarterly Services Survey show that some industries grew despite the pandemic while others saw declining revenue.
-
America Counts StoryVideo Game Consoles: From Manufacturing to Players’ HandsJuly 14, 2021Census Bureau’s Economic Indicators data capture earliest measurements of newest generation video game console supply chain.
-
Business and EconomyEconomic Census Geographic Area Statistics Data Now AvailableApril 07, 2025A new data visualization based on the 2022 Economic Census shows the changing business landscape of 19 economic sectors across the United States.
-
Income and PovertyWhat Sources of Income Do People Rely On?April 02, 2025A new interactive data tool shows income sources for hundreds of demographic and economic characteristic combinations.
-
Business and EconomyBig Improvements to the Annual Integrated Economic Survey (AIES)March 26, 2025The Census Bureau is making several changes and enhancements to capture 2024 economic data based on feedback from last year’s survey.
-
PopulationOnly 50 U.S. Counties Had Populations Over a Million in 2024March 17, 2025A new data visualization highlights U.S. counties between 1970 and 2024 whose populations ever surpassed a million.
Page Last Revised - April 8, 2024
✕
Is this page helpful?
 Yes
Yes
 No
No
 Yes
Yes
 No
No✕
NO THANKS
255 characters maximum
 255 characters maximum reached
✕
Thank you for your feedback.
Comments or suggestions?

Comments or suggestions?