
Around the World, Living Longer and Healthier Depends Largely on Gender and Countries' Income
People are living longer today than they did in past generations but now the question is: Are those extra years lived in good health?
As life expectancy at age 60 (LE60) has become increasingly longer in recent decades, measuring how healthy these extra years are has become even more crucial.
While regional trends are useful, countries within a region can have dramatic variations in life expectancy and healthy life expectancy because of differences in factors like income levels, national health policies and cultural practices.
Healthy life expectancy at 60 (HALE60), or the expected number of years of healthy life after 60, provides significant insight into the potential quality of life for older adults.
A new Census Bureau infographic, Healthy Life Expectancy at Age 60: 2000 to 2016, shows the life expectancy and healthy life expectancy for adults beyond age 60.
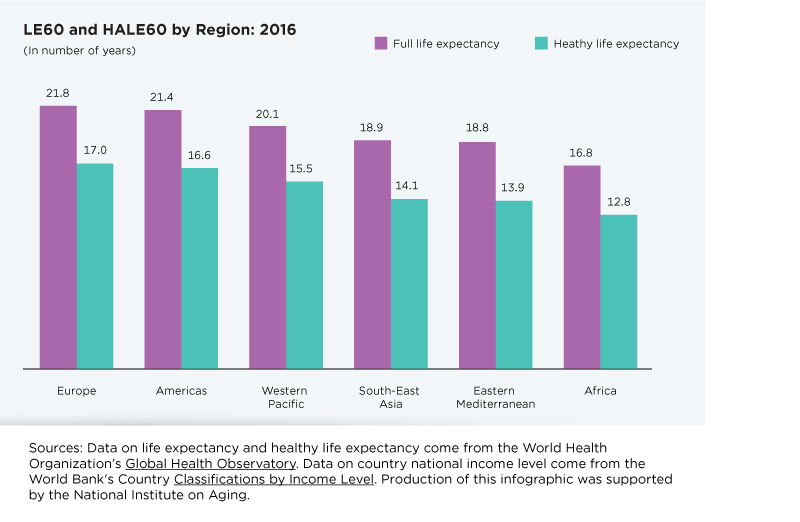
In all world regions, HALE60 was about one quarter shorter than LE60, according to World Health Organization (WHO) data on Life expectancy and Healthy life expectancy.
Global Differences by Region
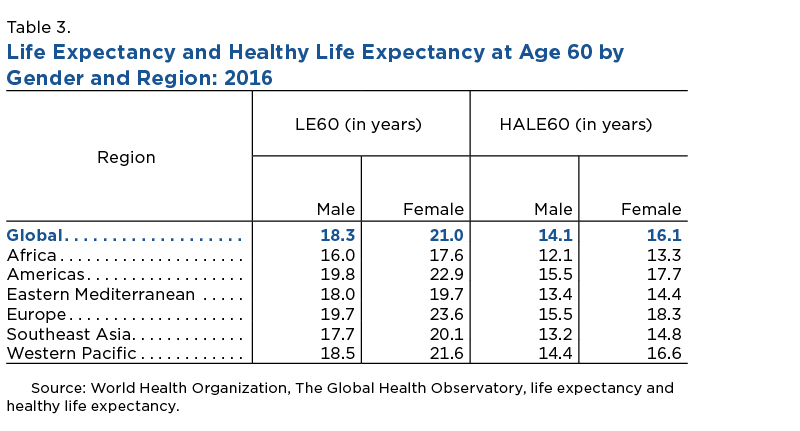
The exact numbers varied between WHO-defined regions. At one extreme is Africa, where people at age 60 were expected to live another 16.8 years. At the other is Europe, where LE60 was 21.8 years. The Americas and Western Pacific also had among the highest LE60 and HALE60.
While regional trends are useful, countries within a region can have dramatic variations in life expectancy and healthy life expectancy because of differences in factors like income levels, national health policies and cultural practices.
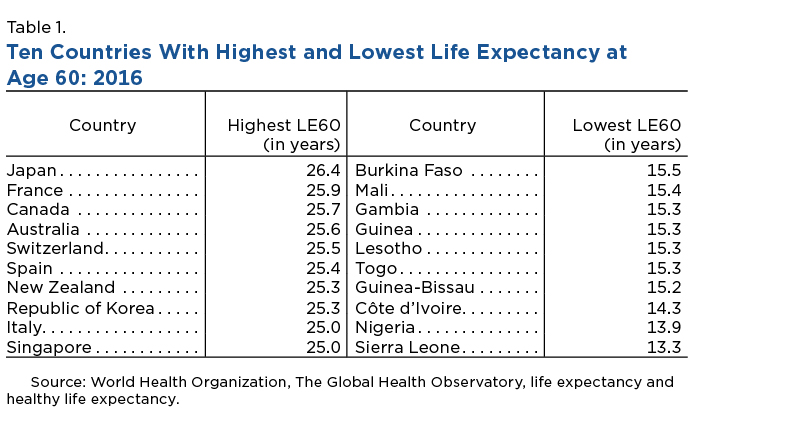
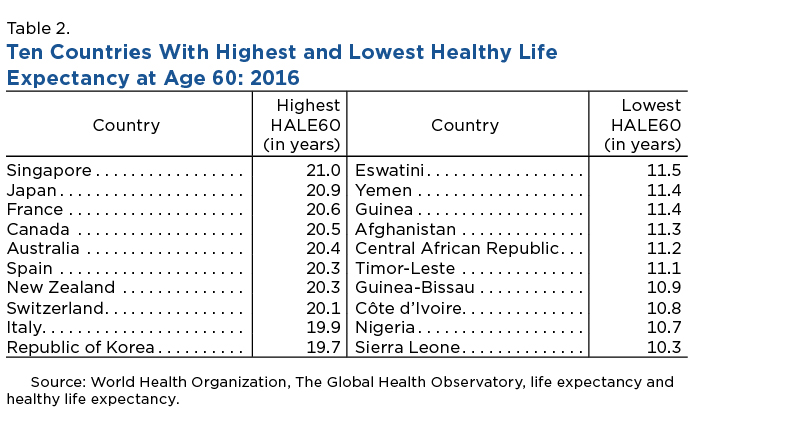
The countries with the highest and lowest LE60 and HALE60 generally mirrored regional trends. Japan and Singapore, both in the Western Pacific, topped the list in both categories.
However, there was a substantial 9.6-year difference in life expectancy and an 8.7-year gap in healthy life expectancy at age 60 between these two highest-scoring countries and Laos, the lowest-scoring country in the Western Pacific region in both metrics.
The 10 lowest LE60 countries and seven of the lowest HALE60 countries were all in Africa but there were substantial variations within the region. Sierra Leone was lowest in both measures there: Its LE60 was 8.6 years shorter than in top-scoring Algeria and its HALE60 was 5.6 years shorter than in Mauritius, where it was highest.
Does Income Affect Life and Healthy Expectancies?
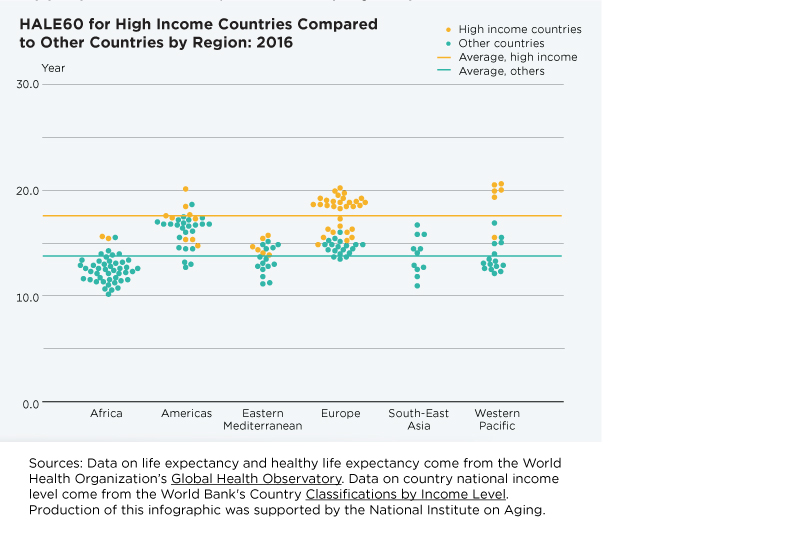
Following the World Bank country income level classifications WDI - Classifying countries by income, a clearer pattern emerges.
High income (HI) countries, represented by the yellow dots in the chart below, had mostly longer HALE60. In fact, the initial regional differences started to disappear when HI countries were not included, as illustrated by the teal dots in the chart below. Africa still lags though.
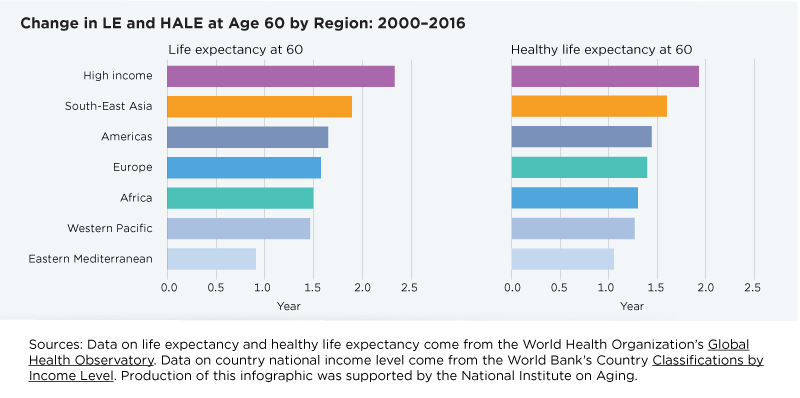
Income disparity between countries also impacted improvements in health and life expectancies between 2000 and 2016. High-income countries were the clear leaders in gains in LE60 (2.3 years) and HALE60 (1.9 years).
When HI countries were not included in the geographic regional estimates, Southeast Asia ranked higher than all other world regions in improvement in both indicators.
It is notable that despite trailing other regions in overall 2016 scores, Africa has made greater strides than Western Pacific and Eastern Mediterranean countries in both indicators and improved more than European countries in HALE60.
Differences Between Older Men and Women
There was a clear gender gap across LE60 and HALE60, reflecting the demographic pattern that women generally live longer than men.
Gender differences were most prominent in Europe, where women at age 60 were expected to live 3.9 years longer than men, and 2.9 years longer in full health. The female advantage started to diminish across the African and Eastern Mediterranean regions although women continued to lead across all indicators.
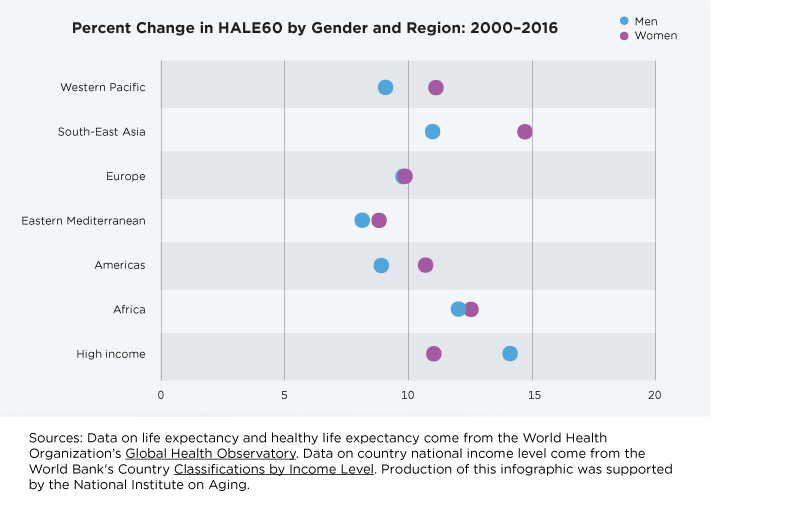
Older women also achieved greater gains than men in longevity and health between 2000 and 2016.
When high-income countries in each region were separated out, the HALE score for older women improved more than for men in every region, with Southeast Asia leading the way.
In contrast, high-income countries showed the opposite gender pattern than other regions: Older men in HI countries made greater strides and surpassed women in HALE60 improvement. When HI countries were removed, Europe had little gender gap improvement.
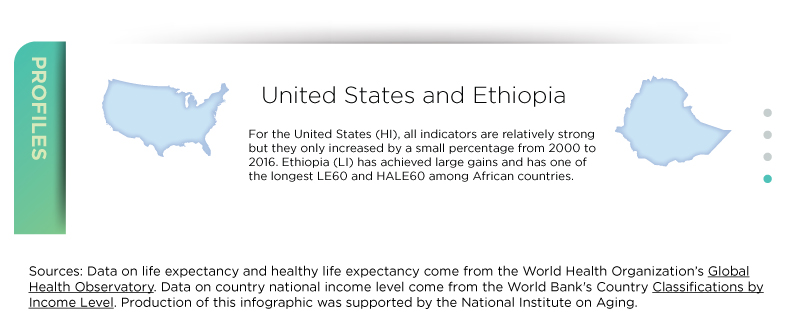
Where Does the United States Stand in World Rankings?
The United States ranked 31st in the world in both LE60 (23.3 years) and HALE60 (17.9 years), but fifth in both measures out of the 33 countries in the WHO-defined Americas region.
Older American men had the 31st-longest HALE60 in the world (16.7 years). Older American women ranked 33rd with 19.0 years.
However, the United States did not experience great gains in HALE60 from 2000 to 2016: regardless of gender, HALE 60 increased only by about one year.
Does a Long Life Mean Healthy Aging?
The life expectancy data showed that not all years after age 60 will be lived in full health. In fact, a quarter of the years beyond age 60 were estimated to be lived in illness or with injury.
All regions had greater life and healthy life expectancies from 2000 to 2016 but more years were added to the full life expectancy than to healthy life expectancy.
However, healthy life expectancy appeared to be catching up, growing at a faster pace in every region. In Eastern Mediterranean countries, for example, HALE60 outpaced the growth in LE60 by the largest margin — 8.5% and 5.2%, respectively.
If this trend continues, older adults can expect to not only live longer but also to live an increasingly healthier life.
Note: This research was supported in part by the National Institute on Aging.
Story Ideas and Statistics
-
Stats for StoriesNational Health Center Week: August 6-12, 2023The 2021 County Business Patterns program counted 54,642 outpatient care centers in the U.S. with 1,225,333 paid employees and an $84.1 billion annual payroll.
-
Stats for StoriesAmerican Heart Month: February 2024The American Community Survey estimates there were 733,169 physicians, 128,908 physician assistants, 18,299 radiologists and 51,238 surgeons in the U.S in 2022.
Subscribe
Our email newsletter is sent out on the day we publish a story. Get an alert directly in your inbox to read, share and blog about our newest stories.
Contact our Public Information Office for media inquiries or interviews.
-
America Counts StoryBy 2030, All Baby Boomers Will Be Age 65 or OlderDecember 10, 2019The 2020 Census will provide the most up-to-date information on the wave of an estimated 73 million aging baby boomers to policymakers.
-
America Counts StoryOld Housing, New NeedsJune 22, 2020Only 10% of homes in the U.S. are aging-ready, while a quarter of all older households have trouble using some of the features of their home.
-
America Counts StoryHow Older Workers With a Disability Navigate CommutesDecember 16, 2020A new U.S. Census Bureau report focuses on commuting behaviors of older workers, including those with disabilities.
-
Families and Living ArrangementsOver a Third of Partners in Opposite-Sex Couples Were the Same AgeApril 27, 2026A new interactive data visualization explores characteristics of opposite-sex married and unmarried couples who lived together in 2025.
-
PopulationEight of the Nation’s Top 15 Last Names Stayed the Same Since 1790April 14, 2026Newly released names data from the 2020 Census show which first and last names are the most popular across the nation.
-
AgeU.S. Population Aging as Nation Turns 250April 09, 2026New population estimates show women still outnumbered men at older ages, but the gap is narrowing due to lower mortality rates and historical factors.
-
Business and EconomyState Lottery Ticket Sales Soar as Prizes Get LargerApril 08, 2026While sales nearly doubled to $104.7 billion from 2008 to 2024, state lottery prizes more than doubled to $70.2 billion in FY 2024.