
Official websites use .gov
A .gov website belongs to an official government organization in the United States.
Secure .gov websites use HTTPS
A lock (
) or https:// means you’ve safely connected to the .gov website. Share sensitive information only on official, secure websites.

Topics
Data & Maps
Surveys & Programs
Resource Library

Census Bureau Statistics Show Change in Retail Sales Year to Year, Season to Season
Whether shopping for big-ticket items like houses, cars, appliances and furniture or for birthdays, Mother’s Day or holiday presents, Census Bureau statistics are the gifts that keep on giving.
Of course, the biggest shopping season is during the holidays. What’s the next biggest? Back-to-school, according to the National Retail Federation.
The Census Bureau has retail trade statistics for all seasons, by quarter, year, month and even by week.
The Census Bureau has retail trade statistics for all seasons, by quarter, year, month and even by week. Annual numbers do not cover sales during the pandemic.
Annual Statistics
For a big picture, let’s look at the Annual Retail Trade Survey (ARTS) from 1998 to 2018. This shows retail sales by North American Industry Classification System (NAICS).

Note: The table above is modified from the full table to hide intervening years (1999-2007 and 2009-2017) and all the notes at the bottom.
From 1998 to 2018, total U.S. retail trade sales grew from $2,581.8 billion to $5,269.5 billion and the share of e-commerce soared from $5.0 billion to $519.6 billion.
The 2019 ARTS will be released during the first quarter of 2021.
Quarterly Statistics
The recently released Quarterly Financial Report (QFR) for the third quarter of 2020, shows recent sales and net income after tax for U.S. Retail Trade Corporations, assets $50 million and over.

Note: The table above is from the last page of Release Number: CB20-188 and is modified to hide all the notes at the bottom.
Quarterly retail e-commerce sales show estimated sales for the third quarter of 2020 were $209.5 billion, down 1.0% from the second quarter. Sales are adjusted for seasonal variation but not for price changes.
We’ll know more about holiday sales when preliminary estimates for the fourth quarter and revised estimates for the third quarter are released Feb. 19, 2021.
Monthly Statistics
What if you want retail sales month to month? The Advance Monthly Retail Trade Survey (MARTS) and Monthly Retail Trade Survey (MRTS) provide these estimates by types of business from clothing and electronics to food and beverage.
Note: The table above is modified from the full table to hide all rows showing 4- and 5-digit NAICS codes and all the notes at the bottom.
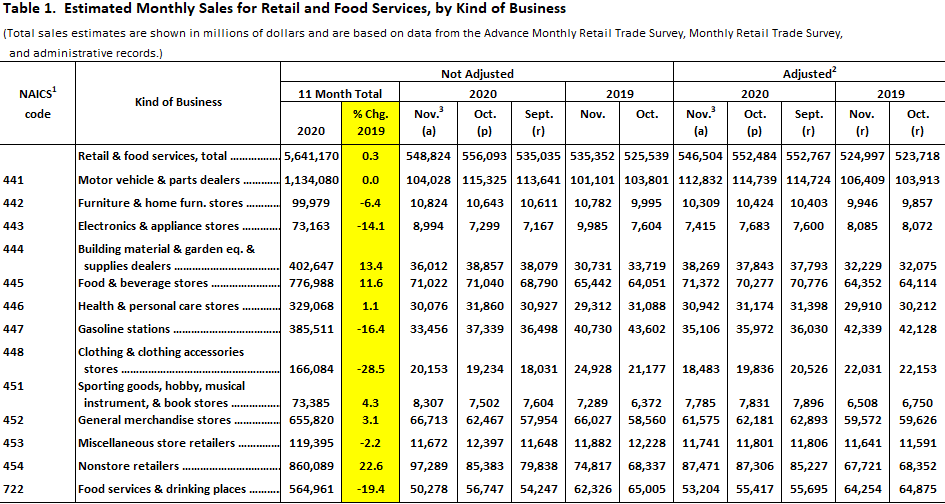
For this story, advance monthly sales for retail and food services are through November 2020, not adjusted. Table 1 compares the 11-month (January - November) totals for 2020 to the same 11 months in 2019, by percentage change.
Growing sectors include:
- Building materials, garden equipment and supplies dealers, up 13.4% (NAICS 444).
- Food and beverage stores, up 11.6% (NAICS 445).
- Nonstore retailers, up 22.6% (NAICS 454).
Declining sectors include:
- Gasoline stations, down 16.4% (NAICS 447).
- Clothing and clothing accessories stores, down 28.5% (NAICS 448).
- Food services and drinking places, down 19.4% (NAICS 772).
The December 2020 Advance Monthly Retail report is scheduled to be released on Jan. 15, 2021, at 8:30 a.m. EST. View the full schedule in the Economic Indicators Briefing Room.
Monthly data are also available at the state level, thanks to our new experimental data product, Monthly State Retail Sales (MSRS). This is a blended data product that uses Monthly Retail Trade Survey, administrative and third-party data.
Year-over-year percentage changes are also available for total retail sales excluding Nonstore Retailers and 11 NAICS retail subsectors, beginning with January 2019.
Weekly Statistics
Weekly data releases for retail trade are now coming from the Small Business Pulse Survey, an experimental data product that tracks the impact of the pandemic on small businesses. We began releasing Phase 3 results weekly Nov. 19 and will continue through Jan. 14, 2021.
We even have weekly data on early-stage business applications at the national, regional and state level from another experimental data product, Business Formation Statistics (BFS).
BFS use data from the Internal Revenue Service's Employer Identification Number Applications (Form SS-4) to create a time series on the number of business applications filed, by industry sectors and sub-sectors. Data are provided for each week in 2019 and 2020.
More Shopping-Related Statistics
To learn about consumers in the United States, check out the Consumer Expenditure Survey, which the Census Bureau conducts for the Bureau of Labor Statistics.
The survey, conducted since 1980, provides data on expenditures, income and demographic characteristics of consumers in the United States. The data are used for calculating the Consumer Price Index (CPI), our nation’s most important measure of inflation.
From the Census Bureau Newsroom, Stats for Stories (SFS) links you to newsworthy and timely stats about current events, observances, holidays and anniversaries. This past year, we released numerous SFS related to shopping:
Derick Moore is senior communications specialist at the Census Bureau.
Subscribe
Our email newsletter is sent out on the day we publish a story. Get an alert directly in your inbox to read, share and blog about our newest stories.
Contact our Public Information Office for media inquiries or interviews.
-
America Counts StoryShare of Online Retail Sales SoaringNovember 24, 2020The Census Bureau publishes data products that measure the changing retail economic landscape from brick-and-mortar stores to e-commerce.
-
America Counts StoryA Profile of the Retail WorkforceSeptember 08, 2020The nation’s 9.8 million retail workers accounted for 6.3% of the U.S. labor force.
-
America Counts Story2017 Economic Census Data Breaks Out Industry Growth, Changes By StateNovember 05, 2020State and local data from the Census Bureau’s 2017 Economic Census provide insight into the businesses that are vital to our economy.
-
Business and EconomyWhat Is the Nonemployer Marine Economy?April 09, 2025Thirty states had nonemployer businesses in marine economy sectors, including six states in the Midwest with receipts totaling nearly $11 billion in 2022.
-
Business and EconomyEconomic Census Geographic Area Statistics Data Now AvailableApril 07, 2025A new data visualization based on the 2022 Economic Census shows the changing business landscape of 19 economic sectors across the United States.
-
Income and PovertyWhat Sources of Income Do People Rely On?April 02, 2025A new interactive data tool shows income sources for hundreds of demographic and economic characteristic combinations.
-
Business and EconomyBig Improvements to the Annual Integrated Economic Survey (AIES)March 26, 2025The Census Bureau is making several changes and enhancements to capture 2024 economic data based on feedback from last year’s survey.
Page Last Revised - April 11, 2024
✕
Is this page helpful?
 Yes
Yes
 No
No
 Yes
Yes
 No
No✕
NO THANKS
255 characters maximum
 255 characters maximum reached
✕
Thank you for your feedback.
Comments or suggestions?

Comments or suggestions?