
Official websites use .gov
A .gov website belongs to an official government organization in the United States.
Secure .gov websites use HTTPS
A lock (
) or https:// means you’ve safely connected to the .gov website. Share sensitive information only on official, secure websites.

Topics
Data & Maps
Surveys & Programs
Resource Library

Most People Who Are Registered to Vote Actually Do Vote
With voting registration deadlines for the November election drawing near, statistics from previous elections tell us how people register and their likelihood of registering and voting.
In recent elections, more than one in four registered voters said they registered through their department of motor vehicles.
In recent elections, more than one in four registered voters said they registered through their department of motor vehicles.
Other common ways, including registering in person at local government offices or mailing in a form to the election office, have declined over the past three elections while online registration has doubled since 2014.

Registration Matters
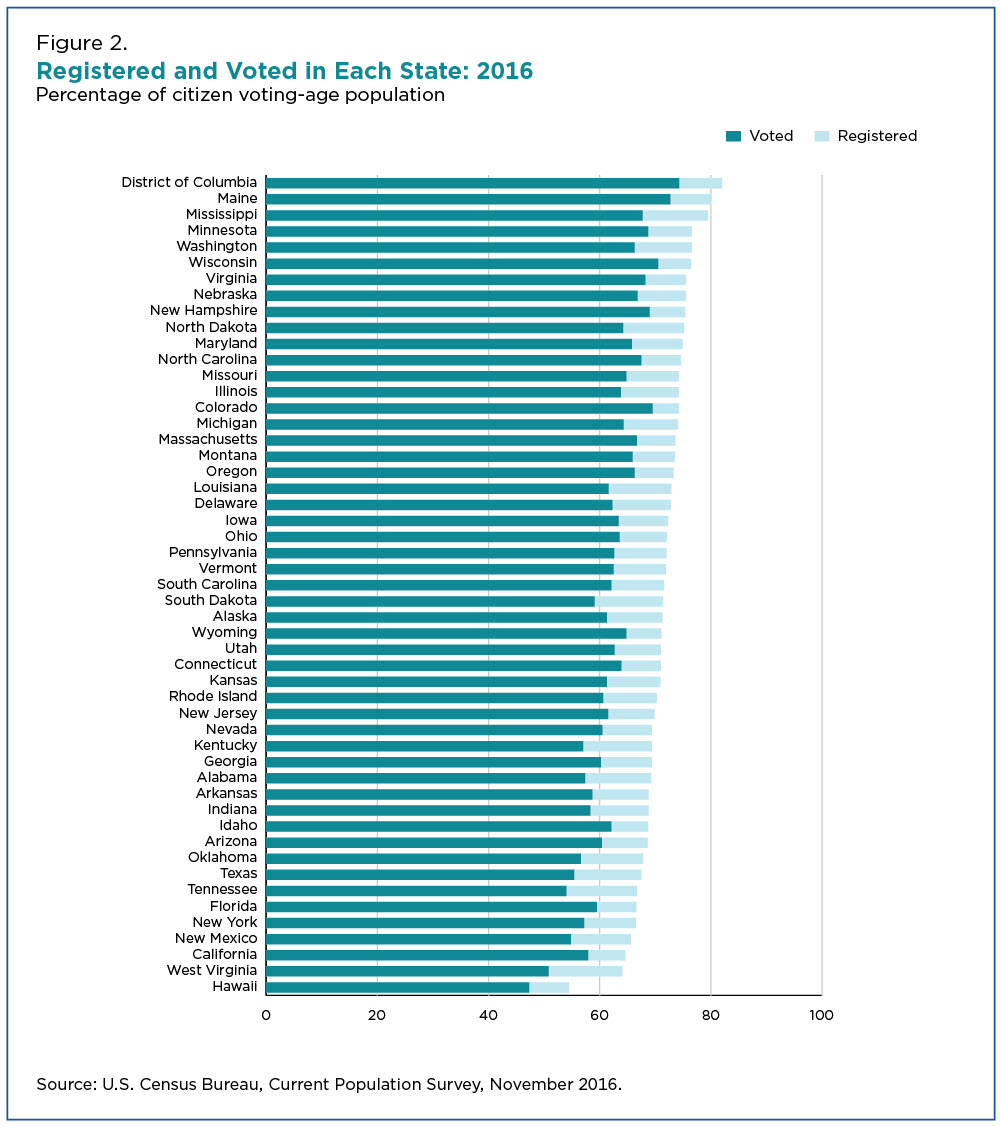
In the last presidential election, 70% of the voting-eligible population registered to vote. This varied by state.
Maine and Mississippi, at 80% and 79%, respectively, were among the states with the largest percentage of their population registered to vote. In Hawaii, more than half (54%) were registered.
Most registered voters vote. Nationally, 61% of the citizen voting-age population said they voted in 2016, ranging from a high of 73% in Maine to a low of 47% in Hawaii. That means, on average almost 9 in 10 registered voters cast a ballot.
Higher Turnout for Presidential Elections
Presidential elections typically have higher turnout than mid-term elections, according to the Current Population Survey.
Most recently, the midterm election of 2018 set record-breaking turnout for a congressional election, with a historic 11 percentage point increase from the last midterm election in 2014.
Voter turnout went up among all voting age and major racial and ethnic groups.

What 2018 Tells Us About the American Voter Today
In any election, demographic characteristics such as education level, income and age are all factors that may affect turnout at the polls.
Demographic characteristics of eligible voters in a congressional district can provide information and insight into voter turnout in elections.
The interactive graphic below uses Census Bureau population characteristics data from the American Community Survey and counts of votes cast from the Office of the Clerk, U.S. House of Representatives.
The combined data highlight variations across the nation in both the percentage of citizens who voted for congressional representatives in 2018 and the characteristics of the citizen voting-age population for each congressional district.
It shows:
- Two views of voting rates for congressional districts – a national-level perspective and a closer look at each state.
- Three views of the characteristics of the citizen voting-age population at the national level, at the state level and at the congressional district level.
Congressional District Voting Rates in the 2018 Election
- Minnesota’s 3rd Congressional District and Colorado’s 2nd Congressional District led the country with the highest percentage (about 70%) of citizens voting for a representative in 2018. Arizona’s 7th District had the lowest rate (29.0%).
- California had one of the widest ranges in voting rates across its 53 congressional districts, from 61.5% in the 18th District to 32.0% in the 21st District, a difference of nearly 30 percentage points.
- Seven states, plus the District of Columbia, have only one congressional district each.
Demographic Characteristics
Education:
- New York’s 12th District has the highest percentage (71.0%) of voting-age citizens with a bachelor’s degree or more.
- In contrast, a quarter of eligible voters in New York’s 15th, California’s 40th and Texas’ 29th districts lack a high school diploma.
- In most instances, districts where a large proportion of voting-age citizens lacked a high school diploma had the lowest voter turnout in 2018.
Gender:
- Most districts, about 4 in 5, have more citizen voting-age women than men, according to the American Community Survey.
- New York’s 8th District has the highest percentage (56.5%) of citizen voting-age women in the country. In contrast, California’s 21st and 51st districts and Alaska’s at-large district have among the lowest percentages (about 47%) of women.
In general, women are more likely than men to register and vote.
Age:
- Massachusetts’ 7th District, California’s 40th District and Arizona’s 7th District were among the youngest congressional districts in the country, with at least one-third of their citizen voting-age population under the age of 30.
- Three Florida congressional districts (11th, 17th, 19th) top the nation’s list for the largest percentage (about 40%) of 65 and older population.
Race and Hispanic Origin:
- In Hawaii’s 1st District, about half of the voting-age citizens are Asian, the highest percentage in the country.
- Hawaii’s 2nd District has 12.1% Native Hawaiian and other Pacific Islanders – the highest percentage in the country.
- Hispanics made up more than half of voting-age citizens in 24 congressional districts: Arizona (3rd), California (21st, 29th, 32nd, 35th, 38th, 40th, 41st, 44th, 46th and 51st), Florida (25th, 26th and 27th), Illinois (4th), New York (15th) and Texas (15th, 16th, 20th, 23rd, 28th, 29th, 34th, and 35th).
Across these heavily Hispanic districts, voting rates in 2018 ranged from 54.4% to 31.3%.
About the Data
This Census Bureau infographic shows all congressional districts for 2018. It combines the counts of votes cast for each congressional race, as collected by state election offices and reported nationally by the Office of the Clerk, U.S. House of Representatives, with estimates of the citizen voting-age population from the 2018 American Community Survey.
Voting rates are calculated by using the number of administratively counted ballots divided by the survey estimate of the citizen voting-age population.
Four congressional districts in Florida (10th, 14th, 21st and 24th) and one in North Carolina (9th) do not have computed voting rates because the states did not report vote totals for these districts. Florida state law prohibits candidates without an opponent from having their name printed on the ballot, and North Carolina’s Board of Elections ordered a new election for the 9th District in February 2019.

Note: Select the image to go to the interactive data visualization.
Jennifer Cheeseman Day is a demographer in the Census Bureau’s Communication Directorate.
Thom File is a senior sociologist in the Social, Economic and Housing Statistics Division.
Subscribe
Our email newsletter is sent out on the day we publish a story. Get an alert directly in your inbox to read, share and blog about our newest stories.
Contact our Public Information Office for media inquiries or interviews.
-
America Counts StoryBehind the 2018 U.S. Midterm Election TurnoutApril 23, 2019New Census Bureau data show that voting increased among all voting age and major racial and ethnic groups.
-
America Counts StoryExplore My Congressional District Data ToolMarch 27, 2019Interest in the My Congressional District tool peaked after the midterm elections and is expected to continue now that the new Congress is sworn in.
-
America Counts StoryVoter Turnout for Non-Hispanic Black Population DeclinesAugust 09, 2017For only the second time since 1980, the share of non-Hispanic white voters did not drop since the last presidential election.
-
PopulationWhich States Had the Highest Shares of Newcomers?April 29, 2025Many states with the highest share of recent movers from out-of-state in 2023 had relatively small populations.
-
Business and EconomyEntertainment, Travel, and Recreation Industries ReboundingApril 23, 2025A look at which selected travel, entertainment and recreation-related industries hit hard by the pandemic rebounded.
-
Income and PovertyNew Snapshots From the Survey of Income and Program ParticipationApril 21, 2025New Census Bureau product offers mobile-friendly fact sheets on who receives income from various sources.
-
PopulationU.S. Metro Areas Experienced Population Growth Between 2023 and 2024April 17, 2025New Census Bureau population estimates show 88% of U.S. metro areas gained population between 2023 and 2024.
Page Last Revised - November 5, 2024
✕
Is this page helpful?
 Yes
Yes
 No
No
 Yes
Yes
 No
No✕
NO THANKS
255 characters maximum
 255 characters maximum reached
✕
Thank you for your feedback.
Comments or suggestions?

Comments or suggestions?