
Official websites use .gov
A .gov website belongs to an official government organization in the United States.
Secure .gov websites use HTTPS
A lock (
) or https:// means you’ve safely connected to the .gov website. Share sensitive information only on official, secure websites.

Topics
Data & Maps
Surveys & Programs
Resource Library

Percentage of People With Public Health Insurance Up in 11 States, Down in Two
Across states, levels and types of health insurance coverage change over time because of economic conditions, the demographic composition of the population, and state and federal policies.
The 2018 American Community Survey (ACS) 1-year estimates show trends in health insurance coverage rates in each of the 50 states and the District of Columbia.
In 2018, 91.1% of people in the United States had health insurance to help cover their medical expenses but coverage varied by state. For example, health coverage rates ranged from 82.3% of people in Texas to 97.2% of people in Massachusetts.
In 2018, 91.1% of people in the United States had health insurance to help cover their medical expenses but coverage varied by state.
In 2018, for example, health coverage rates ranged from 82.3% of people in Texas to 97.2% of people in Massachusetts.
The large sample size of the ACS allows for an examination of types of coverage, including private coverage (employment-based, direct-purchase and TRICARE), public coverage (Medicare, Medicaid, CHAMPVA and VACARE) and the overall insured rate over time at the state level.
Some of the state-by-state findings using data from the 2013, 2017 and 2018 ACS 1-year estimates:
- In 2018, private coverage rates across states ranged from 54.3% to 79.7% (Figure 1).
- Between 2017 and 2018, the percentage of people with private health insurance coverage increased in four states and decreased in four states (Figure 2).
- Public coverage rates in 2018 ranged from 21.3% to 49.4% across states. (Figure 1).
- Between 2017 and 2018, the percentage of people with public health insurance coverage increased in 11 states and declined in two states (Figure 2).
- Medicaid coverage varied 22.6 percentage points across states, ranging from 10.3% to 32.9% (Figure 3).
- Compared with 2013, the year before several key provisions of the Affordable Care Act went into effect, uninsured rates were lower in all 50 states and the District of Columbia in 2018.
- Private coverage increased in 31 states, and public coverage rates increased in 46 states between 2013 and 2018 (Figure 2).
Private Coverage
In 2018, most people (67.5%) in the United States had private health insurance coverage, such as coverage through an employer, coverage purchased directly (including through a state or federal marketplace), and/or coverage through TRICARE.
While the majority of people in each state had private coverage, the percentage of people with private coverage varied.
New Mexico had among the lowest rate of private health insurance coverage at 54.3%. North Dakota had among the highest rates at 79.7% in 2018, a 25.4 percentage-point difference.
Two states had private coverage rates of 60.0% or less.
Figure 1
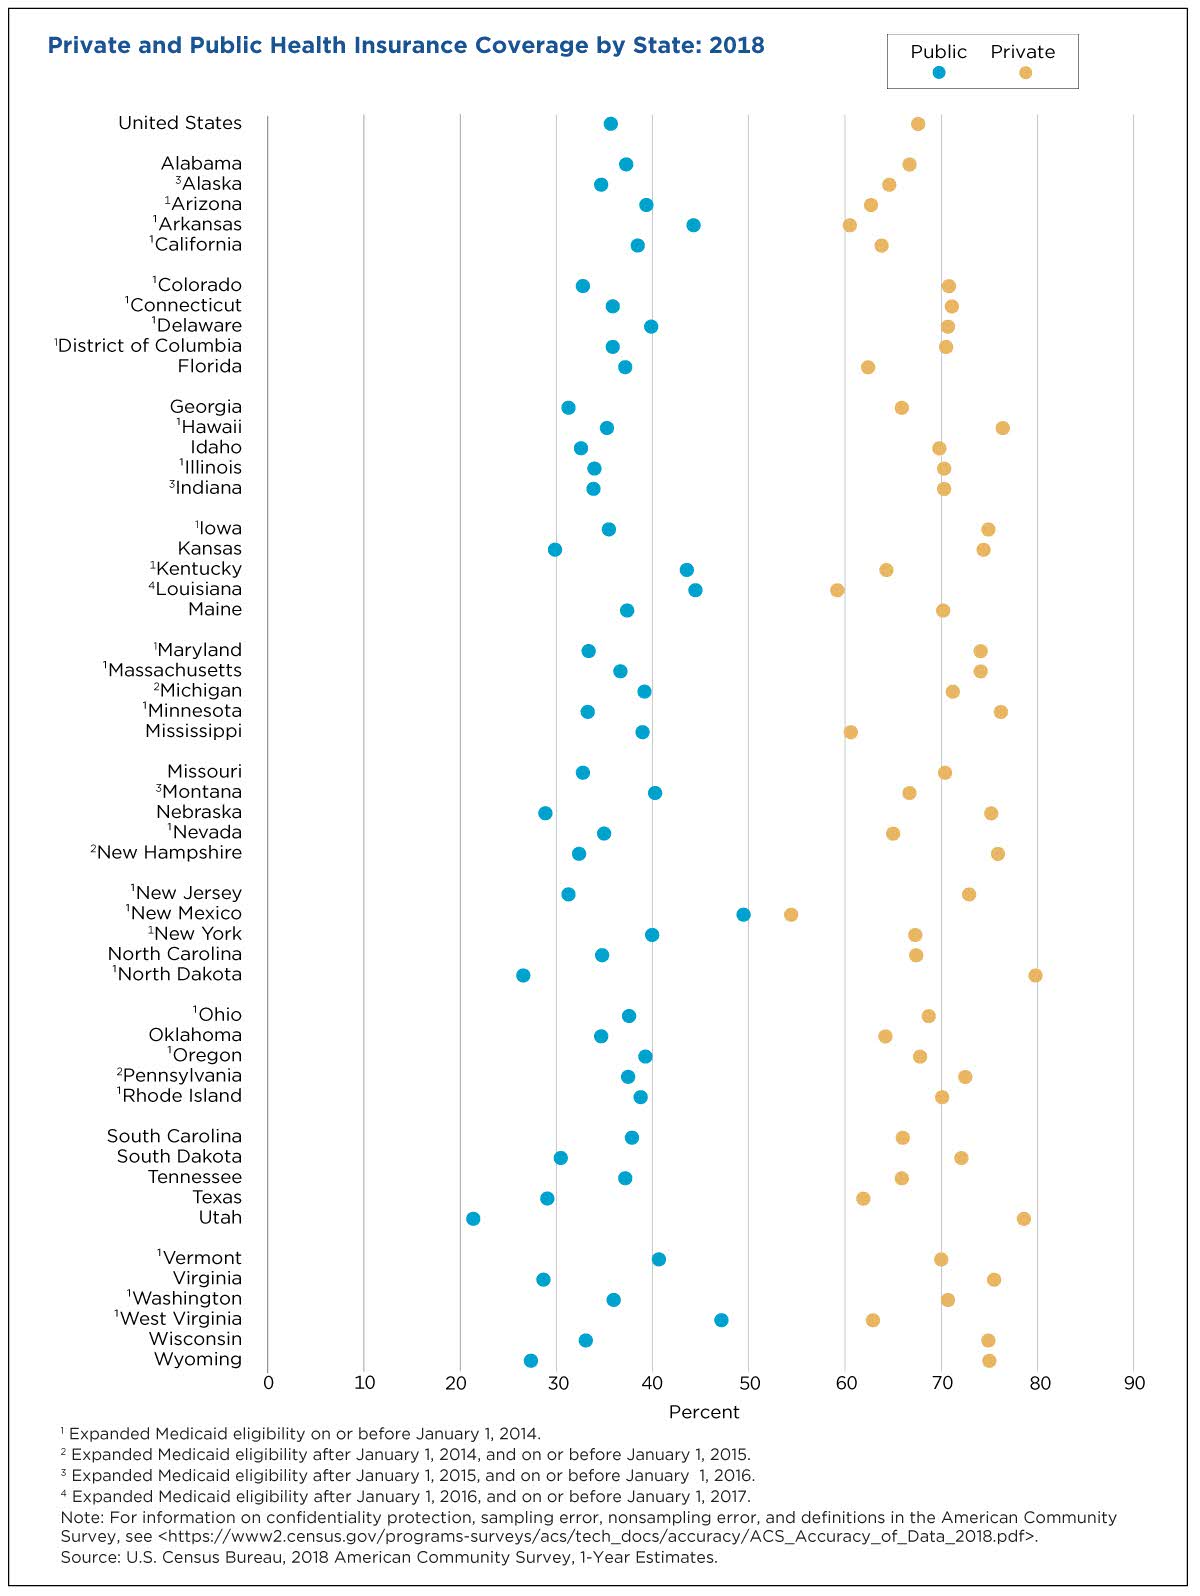
Figure 2

Figure 3

Public Coverage
In 2018, about 35.6% of people in the United States had public coverage.
Utah had the lowest public coverage rate at less than one-quarter (21.3%), while New Mexico had the highest at about one-half (49.4%).
Public coverage rates may vary depending on whether a state expanded Medicaid eligibility. In states that chose to do so, a higher percentage of people have public coverage.
Public coverage rates may be related to whether or not a state expanded Medicaid eligibility as part of the ACA. Thirty-one states and the District of Columbia elected to expand Medicaid eligibility on or before January 31, 2018 (“expansion states”), and 19 states did not (“non-expansion states”).
In 2018, 37.4% of people in expansion states had public coverage, which was 4.6 percentage points higher than the percentage of people with public coverage in non-expansion states (32.8%).
The uninsured rate in expansion states was also lower (6.6%) than the uninsured rate in non-expansion states (12.4%).
Subscribe
Our email newsletter is sent out on the day we publish a story. Get an alert directly in your inbox to read, share and blog about our newest stories.
Contact our Public Information Office for media inquiries or interviews.
-
HealthUninsured Rate for Children Up to 5.5 Percent in 2018September 10, 2019Overall, the uninsured rate for children rose in 2018, driven by a decline in the percentage of children with public coverage, such as Medicaid.
-
HealthYour Health Care Is in Women’s HandsAugust 14, 2019Since 2000, women’s participation and median earnings in high-education health care jobs are up while earnings in other health care jobs show little gains.
-
Business and EconomyWhat Is the Nonemployer Marine Economy?April 09, 2025Thirty states had nonemployer businesses in marine economy sectors, including six states in the Midwest with receipts totaling nearly $11 billion in 2022.
-
Business and EconomyEconomic Census Geographic Area Statistics Data Now AvailableApril 07, 2025A new data visualization based on the 2022 Economic Census shows the changing business landscape of 19 economic sectors across the United States.
-
Income and PovertyWhat Sources of Income Do People Rely On?April 02, 2025A new interactive data tool shows income sources for hundreds of demographic and economic characteristic combinations.
-
Business and EconomyBig Improvements to the Annual Integrated Economic Survey (AIES)March 26, 2025The Census Bureau is making several changes and enhancements to capture 2024 economic data based on feedback from last year’s survey.
Page Last Revised - October 3, 2024
✕
Is this page helpful?
 Yes
Yes
 No
No
 Yes
Yes
 No
No✕
NO THANKS
255 characters maximum
 255 characters maximum reached
✕
Thank you for your feedback.
Comments or suggestions?

Comments or suggestions?