
New Product Helps Us Understand Economic Performance By Industry
This week, the U.S. Census Bureau joins other agencies by posting important manufacturing content on the Manufacturing Day webpage.
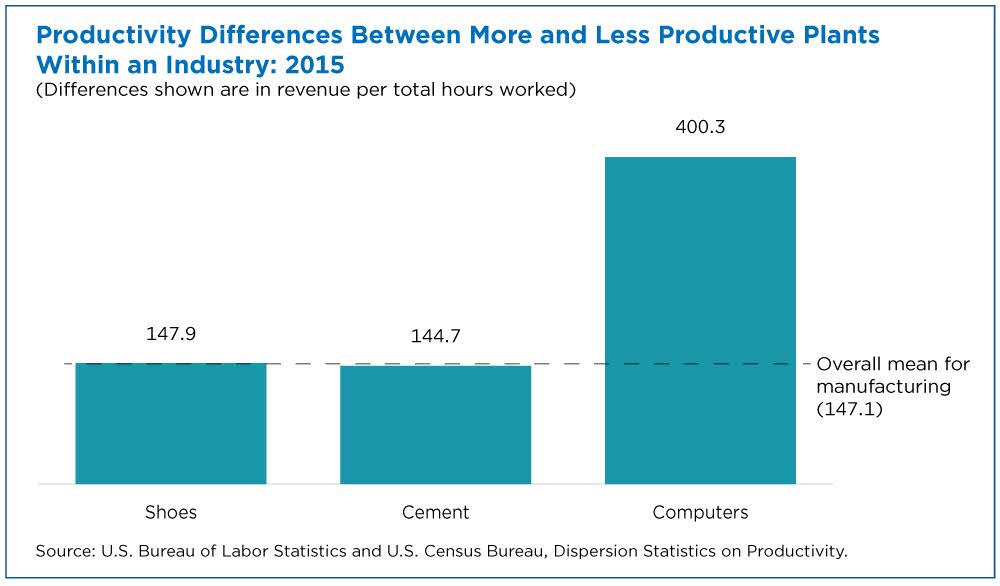
Why does one manufacturer generate more revenue per total hours worked by its employees than another manufacturer in the same industry?
Take the computer equipment industry. The more productive plants in that industry generate about 400% more real revenue per total hours worked than the less productive plants in it (Figure 1).
Other industries, such as shoes and cement, have smaller differences in productivity but those differences are still large.
There are essentially two drivers of industry-level productivity growth: Individual plants become more productive and more productive plants get larger by absorbing the resources of less productive plants that are getting smaller.
In fact, within the average manufacturing industry in 2015, the latest year for which data is available, plants exhibit enormous differences in real (adjusted for inflation) revenue per total hours worked.
More productive plants — at the 75th percentile of the productivity distribution — generate approximately 150% more real revenue per hour than less productive plants that are at the 25th percentile (Figure 1).
What drives these differences?
This is an open question and one that can be explored using the new statistical product recently released by the U.S. Census Bureau and the Bureau of Labor Statistics: the Dispersion Statistics on Productivity (DiSP).
Business Differences Matter
Producers within industries differ in many ways. They produce different products of varying quality and have different customers and markets. They use different technology and business practices to combine different amounts of materials and equipment to produce their products.
Some businesses are also larger and/or older than other businesses. Their ability to adjust their scale and mix of operations may vary due to these differences.
Experimenting with new products and processes can also contribute to productivity differences.
Businesses that have successfully adopted new technologies are likely to be more “productive” (as measured by these differences in revenue per hour) compared to businesses that have not yet adopted such technologies.
All of these factors can contribute to enormous variations in this measure of business performance.
In principle, as businesses make adjustments in their scale and mix of operations, these differences should be reduced. Highly productive businesses are more likely to expand, while less productive enterprises are more likely to contract and potentially go out of business.
Measuring Differences
As its name suggests, the new data product provides these measures of dispersion. The size of the dispersion measure can tell us important information about the changing business conditions within an industry.
For example, if it becomes harder for businesses to adjust their labor force in reaction to a change in business climate, we may see a rise in dispersion.
We may also see a rise in dispersion when there is a lot of experimentation and innovation within an industry.
These two examples highlight that high or low dispersion is not necessarily either good or bad but it is useful to know whether an industry has high or low dispersion. It’s a way to find out information about the many factors that can lead to productivity gaps between businesses within the same industry.
What Drives Productivity Growth in Industries?
There are essentially two drivers of industry-level productivity growth: Individual plants become more productive and more productive plants get larger by absorbing the resources of less productive plants that are getting smaller.
These two drivers are likely connected since plants that are more productive are more likely to grow.
Understanding how large the gap is between more and less productive plants in an industry helps paint a more complete picture for each industry.
It provides information about the potential for improvement. If there is a large productivity gap between plants in an industry, the less productive plants have room to become more productive. They can make changes, such as reallocating resources, innovating or adopting new business practices.
What DiSP Offers
The DiSP provides information on differences in productivity for manufacturing industries for 1997-2015.
While we have highlighted one way to measure productivity in this article (output per hour or real revenue per hour), the DiSP also includes two other ways to measure productivity: value added per worker (forthcoming) and multifactor productivity.
Teaming Up to Better Serve You
This new experimental data product is made possible by combining the expertise of Bureau of Labor Statistics staff in measuring productivity and Census Bureau staff in applying this measure to business level data. This new experimental data product will be available on both websites.
The DiSP is experimental data, which means it is especially important for us to get feedback. The website includes the DiSP data product, details about the methodology used to create it and presentations and research papers related to the DiSP. The website also includes an email address for users to send feedback.
Related Statistics
-
Manufacturing WeekThe U.S. Census Bureau joins the celebration by providing a week's worth of rich content, including statistics that inform businesses and policymakers.
-
Stats for StoriesNational Manufacturing Day: October 3, 2025The U.S. Census Bureau joins organizations across the country celebrating the importance of the manufacturing sector of the nation’s economy.
Subscribe
Our email newsletter is sent out on the day we publish a story. Get an alert directly in your inbox to read, share and blog about our newest stories.
Contact our Public Information Office for media inquiries or interviews.
-
Business and EconomyWhere Do New Businesses Emerge?July 17, 2019Today, the U.S. Census Bureau debuted Business Formation Statistics, which provides timely local data to explore new business ventures.
-
EmploymentAbout 13M U.S. Workers Have More Than One JobJune 18, 2019More than 8% of workers have multiple jobs and the majority of them hold two jobs for the entire year. Women are more likely than men to have multiple jobs.
-
EducationCollege Degree Widens Gender Earnings GapMay 29, 2019More education leads to higher pay but the gender gap is greater among those with a bachelor’s degree than among those without.
-
Business and EconomyState Lottery Ticket Sales Soar as Prizes Get LargerApril 08, 2026While sales nearly doubled to $104.7 billion from 2008 to 2024, state lottery prizes more than doubled to $34.5 billion in FY 2024.
-
Families and Living ArrangementsNumber of Same-Sex Couple Households Nearly Doubled From 2005 to 2024April 01, 2026Census Bureau data show demographic and economic characteristics of same- and opposite-sex couple U.S. households.
-
Business and EconomyHighlighting Census Business Builder’s Geography FeaturesMarch 31, 2026Census Business Builder tool features unique ways to pull only the data you need by customizing regions and applying geographic filters.
-
PopulationSome Like it Hot: County Domestic Migration Trends From 2011 to 2025March 26, 2026Counties that once attracted droves of domestic migrants have cooled off and other counties have replaced them as popular migration destinations.