SNAP moved 3.2 million people out of poverty in 2018
Due to an error in our tax model, tax units with an Adjusted Gross Income (AGI) below $12,000 were inadvertently not run through the Additional Child Tax Credit (ACTC) portion of the tax model. As a result, 2,435 tax units did not receive this refundable credit, which changed the Supplemental Poverty Measure (SPM) poverty status of about 600 individuals (or 0.3% of the weighted population). This error changed our top-level SPM estimate from 13.1% for 2018 to 12.8%. Using either set of estimates, the change between 2017 and 2018 was not significant overall or for any of the major age categories. All SPM estimates have been revised accordingly. Disregard previous versions of this story.
The Supplemental Nutrition Assistance Program (SNAP) reduced poverty by just over 1 percentage point for the three-year period from 2016 to 2018, according to recently released U.S. Census Bureau data.
Figure 1

The Supplemental Poverty Measure (SPM) shows that SNAP – formerly known as food stamps – cut the poverty rate from 14.2% to 13.1%. This means that with SNAP benefits, an average 3.5 million fewer people were living below the poverty line during that three-year period.
However, there are notable state-level variations; New Mexico, Louisiana and Rhode Island were among the states where SNAP had the greatest anti-poverty impact (see Table 1 and Figure 1).
Why SPM is Important
The SPM allows us to gauge the potential magnitude of the effect of tax credits and transfers in alleviating poverty.
The SPM, an alternative to the official poverty measure, considers the value of noncash government transfers, taxes, and necessary expenses into the resources a family has available to meet their basic needs.
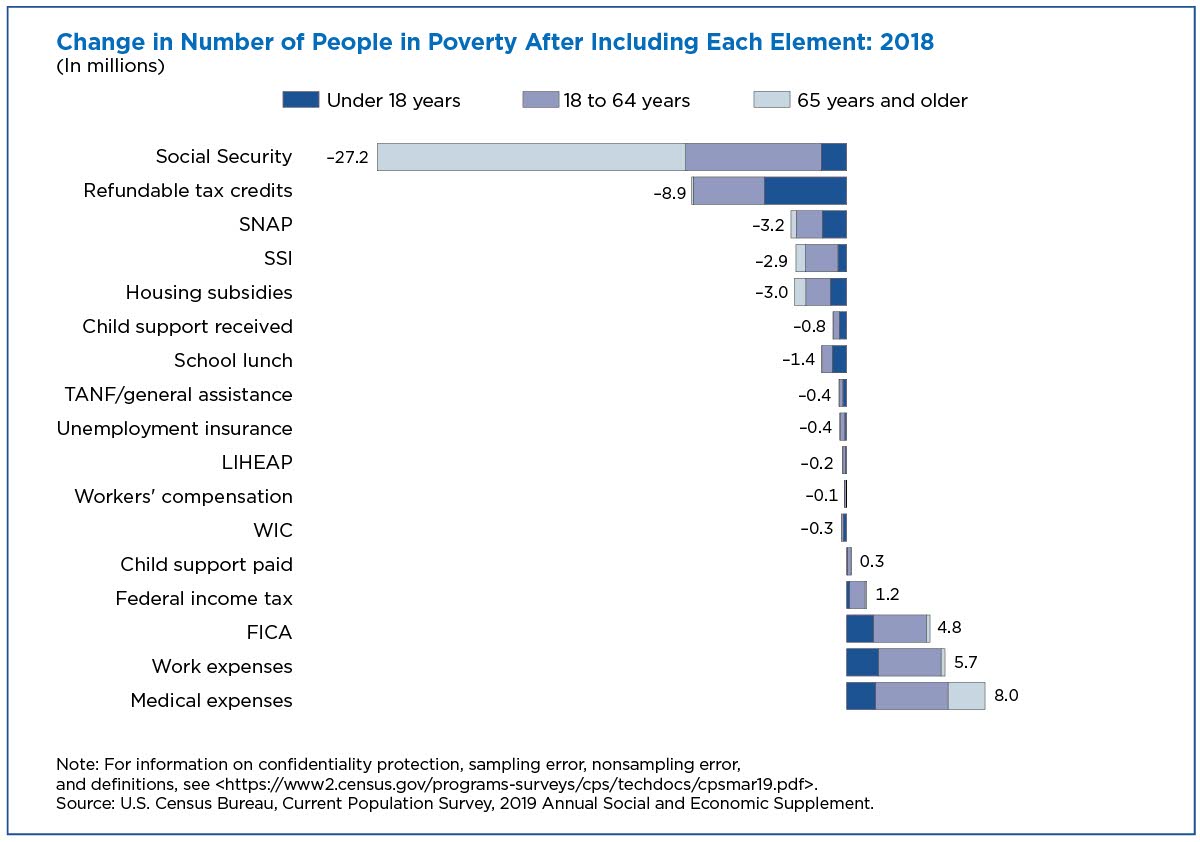
Figure 8 in the 2018 SPM Report released today shows how each element, including SNAP, impacts the estimated number of people below the supplemental poverty threshold.
By subtracting the value of SNAP from resources and recalculating poverty rates (assuming no behavioral changes and all else constant), we can show how many people would have been in poverty in the absence of SNAP.
How does SNAP Reduce Poverty across the Country?
SNAP is a nutritional assistance program that aims to help low-income families afford a nutritionally balanced diet. Among the additions to resources considered by the SPM, SNAP has consistently been among the most impactful noncash transfer.
SNAP is estimated to have prevented approximately 3.2 million people from falling into poverty in 2018 and an average of 3.5 million across 2016-2018.
To create state-level estimates using the Current Population Survey Annual Social and Economic Supplement (CPS ASEC), the Census Bureau recommends using 3-year averages for additional statistical reliability.
The 3-year average poverty rate for the United States in 2016-2018 was 13.1% using the SPM. Subtracting out the value of SNAP allows us to estimate that SNAP benefits decreased the SPM rate by slightly above 1 percentage point, from 14.2% to 13.1%.
This means that with SNAP benefits, 3.5 million fewer people were living below the poverty line.
State-by-State Impact
SNAP is estimated to have decreased the SPM rate in 41 of the 50 states and in the District of Columbia by a value that is greater than or not significantly different than 1 percentage point. Figure 1 above illustrates the impact of SNAP benefits on SPM poverty by state.
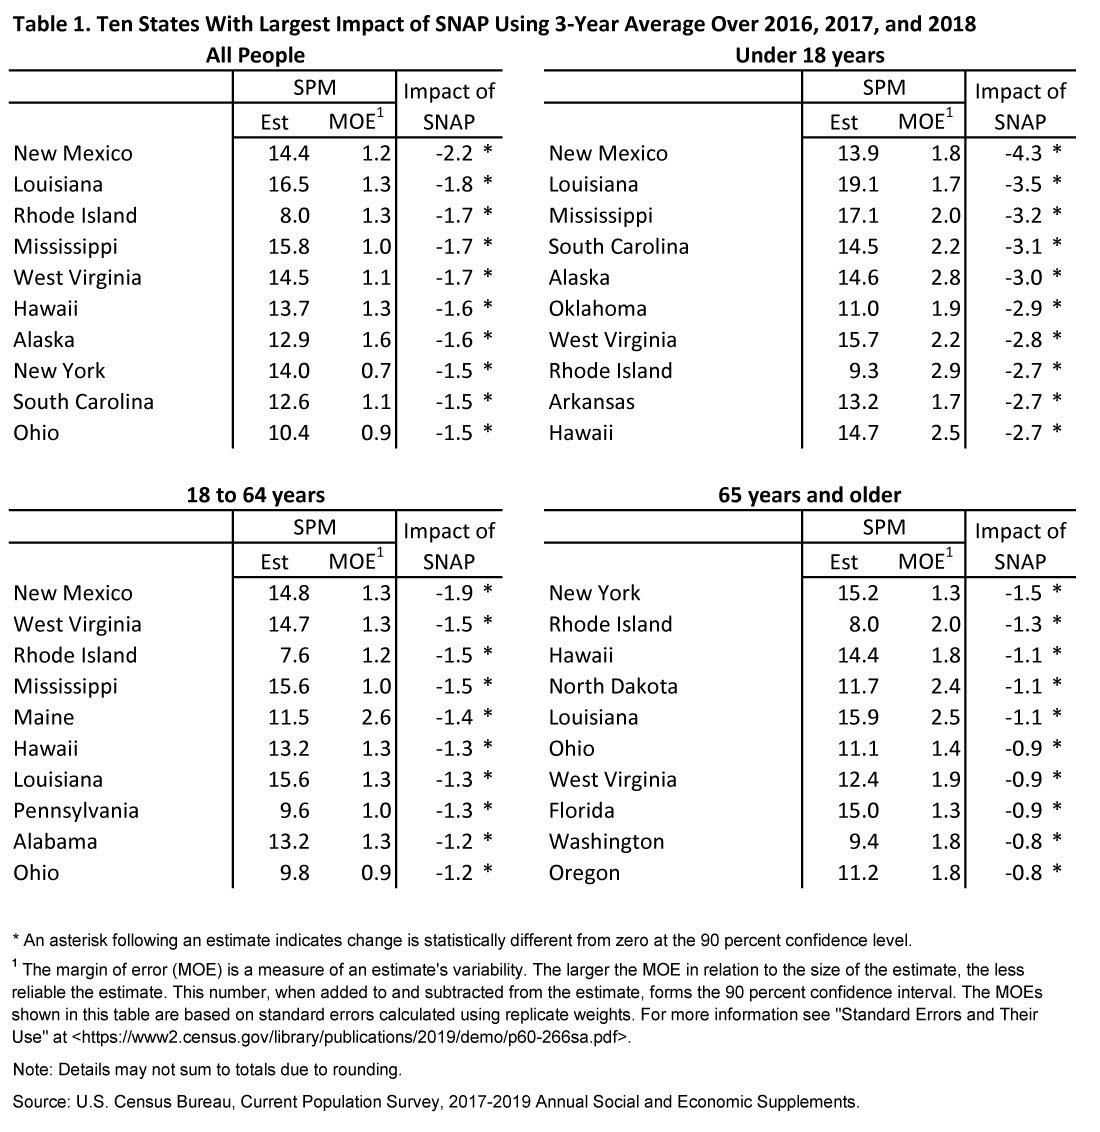
New Mexico, Louisiana and Rhode Island were among the states where SNAP had the greatest anti-poverty impact, decreasing each state’s SPM rate by 2.2, 1.8 and 1.7 percentage points, respectively.
Impact on Child Poverty
Children under age 18 are the largest age group receiving SNAP. The program is estimated to have decreased the SPM rate for children by 2.0 percentage points on average, from 16.3% to 14.2%.
New Mexico, Louisiana and Mississippi were among the states most affected by SNAP. The program decreased the child poverty rate of each state by 4.3, 3.5 and 3.2 percentage points, respectively.
Figure 2 illustrates the percentage point decrease in the SPM rate among children within each state.
Figure 2

SNAP had less of an impact on the national SPM rate of adults between the ages of 18 and 64 and those 65 years or older.
For the United States, SNAP reduced SPM poverty for adults 18 to 64 years by 0.8 percentage points (from 13.4% to 12.6%) and by 0.6 percentage points (from 14.1 to 13.5) for adults aged 65 and over.
See Table 1 below for a list of the 10 states whose populations were most affected by SNAP.
Table 1
The Census Bureau reviewed this data product for unauthorized disclosure of confidential information and approved the disclosure avoidance practices applied to this release. CBDRB-FY19-POP001-0049.
Also Released Today
Subscribe
Our email newsletter is sent out on the day we publish a story. Get an alert directly in your inbox to read, share and blog about our newest stories.
Contact our Public Information Office for media inquiries or interviews.
-
Income and PovertyPoverty Rate for People in Woman-Led Households Lowest on RecordSeptember 10, 2019The U.S. poverty rate dropped from 12.3% in 2017 to 11.8% in 2018. The decrease in poverty for women-led families comprised much of...
-
Income and Poverty2018 U.S. Median Household Income Was $63,179, No Big Change From 2017September 10, 2019U.S. Census Bureau released 2018 income, poverty and health insurance statistics today. Survey redesigns make comparing statistics from prior years challenging.
-
HealthUninsured Rate for Children Up to 5.5 Percent in 2018September 10, 2019Overall, the uninsured rate for children rose in 2018, driven by a decline in the percentage of children with public coverage, such as Medicaid.
-
PopulationEight of the Nation’s Top 15 Last Names Stayed the Same Since 1790April 14, 2026Newly released names data from the 2020 Census show which first and last names are the most popular across the nation.
-
AgeU.S. Population Aging as Nation Turns 250April 09, 2026New population estimates show women still outnumbered men at older ages, but the gap is narrowing due to lower mortality rates and historical factors.
-
Business and EconomyState Lottery Ticket Sales Soar as Prizes Get LargerApril 08, 2026While sales nearly doubled to $104.7 billion from 2008 to 2024, state lottery prizes more than doubled to $34.5 billion in FY 2024.
-
Families and Living ArrangementsNumber of Same-Sex Couple Households Nearly Doubled From 2005 to 2024April 01, 2026Census Bureau data show demographic and economic characteristics of same- and opposite-sex couple U.S. households.