A Third of Movers From Puerto Rico to the Mainland United States Relocated to Florida in 2018
A year following Hurricane Maria, both the population and poverty rate declined in Puerto Rico.
These findings released today come from the 2017 and 2018 American Community Surveys (ACS) and Puerto Rico Community Surveys (PRCS).
The number of movers from the territory to the mainland United States increased by more than a third in 2018.
The number of people living in Puerto Rico decreased by 142,000 (4.4%) from 3,337,000 in 2017 to 3,195,000 in 2018.
The number of movers from the territory to the mainland United States increased by more than a third in 2018. About 133,500 people moved, up 36.9% from 97,500 movers the year before.
More than half moved to the South and more than a quarter moved to the Northeast. Their destinations across the United States shifted from 2017 with higher growth rates in the West and South than in the Northeast or Midwest.

State Destinations
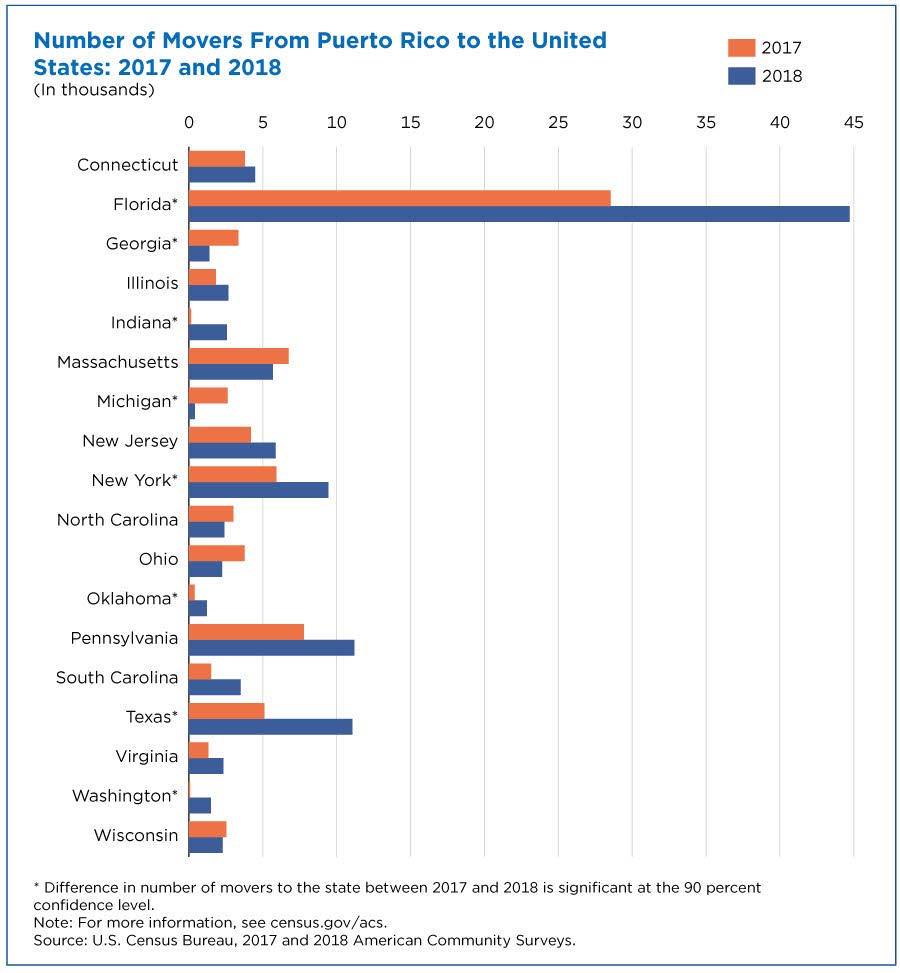
More people moved from Puerto Rico to Florida, Indiana, New York, Oklahoma, Texas and Washington in 2018 than in the prior year.
Figure 2 shows states with at least 2,000 people who moved from Puerto Rico in 2017 and 2018, along with states that had a significant change in the number of people moving from Puerto Rico.
One-third (33.5%) of all Puerto Ricans who moved to the mainland United States in 2018 moved to Florida. Popular destinations in previous years, Michigan and Georgia, experienced a decline in the number of Puerto Ricans moving there.
How do we know where people moving from Puerto Rico settled?
The ACS asks respondents whether they lived in the same residence 1 year ago. For respondents who moved within the previous year, the address of their previous residence is collected. Information about current and previous residence locations are coupled to produce a domestic migration flow.
Poverty in Puerto Rico
The poverty rate in Puerto Rico decreased by 1.3 percentage points, from 44.4% in 2017 to 43.1% in 2018.
However, poverty in Puerto Rico is still much higher than the U.S. national rate of 13.1% and is more than double the poverty rate of 19.7% in Mississippi, which had among the highest state poverty rates in 2018.
Figure 3 provides some historical perspective on the poverty rate in Puerto Rico.
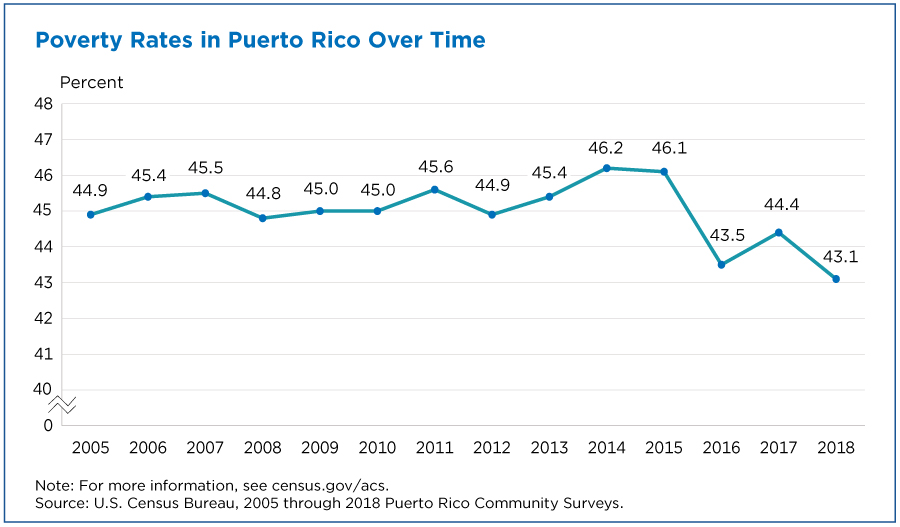
While the 2018 rate is a decrease from the 2017 estimate, it is not statistically different from the 2016 estimate.
Use caution when making year-to-year comparisons. Here’s why:
- The 2017 estimate was based on only nine months of data since data collection was suspended from October to December 2017 following Hurricane Maria.
- Since the survey is continuous, adjacent ACS years have income reference months in common. Therefore, comparing the 2017 ACS with the 2018 ACS is not an exact comparison of economic conditions across years. (Respondents are asked to report their income in the previous 12 months. Those interviewed in January 2018 were reporting income from January 2017 to December 2017 while those interviewed in September 2017 were reporting income for October 2016 to September 2017.)
Next year, when data from 2019 are available, we will be able to compare those poverty rates to the 2016 estimates to get a better sense of the impact of the storm on poverty.
How Compositional Changes in the Population Affect Poverty
Data from the ACS can help to explain changes in the poverty rate across 2017 and 2018 as a result of changes in both the composition of the population as well as economic changes within population groups.
While the overall poverty rate decreased from 2017 to 2018, the only age group (Figure 4) to experience a statistically significant decrease in poverty rates in 2018 was the population ages 18 to 64. Their poverty rate fell from 41.9% to 40.5%.
- This age group experienced a 2.1 percentage point increase in their employment rate from 47.6% to 49.7%. Since the employed have lower poverty rates than either the unemployed or those not in the labor force, this shift decreases overall poverty rates.
- Within the population ages 18 to 64, there was a statistically significant decrease in poverty rates for those not in the labor force. Their poverty rate fell from 58.4% to 56.3%.
- There was a 1.6 percentage point decline in this group’s share of the population ages 18 to 64, from 42.9% to 41.3%. The decrease in poverty rates for those not in the labor force along with the decrease in their share of the population from 2017 to 2018 decreases overall poverty rates.
The age composition of the Puerto Rican population has changed, with a 1.1 percentage point decline in the share of children under age 18 and a 1.0 percentage point increase in the share of the older population age 65 or older.
Since children generally have higher poverty rates than those age 65 or older, 56.9% compared to 38.2% for 2018, these changes also impact the overall poverty rate.
Finally, the percentage of people living in rural areas of Puerto Rico decreased as a percentage of the overall population. People in rural areas have higher poverty rates than people in urban areas (52.8% compared to 42.5% in 2018).

The PRCS is part of the ACS, but is customized for Puerto Rico. Due to Hurricane Maria, the 2017 PRCS was suspended from September 2017 through the end of the year, and data for 2017 reflect characteristics of Puerto Rico prior to Hurricane Maria.
Subscribe
Our email newsletter is sent out on the day we publish a story. Get an alert directly in your inbox to read, share and blog about our newest stories.
Contact our Public Information Office for media inquiries or interviews.
-
PopulationMoves to and From the South and West Dominate Recent Migration FlowsApril 29, 2019Domestic migration flows in the South and West are highlighted in three recent migration data releases.
-
PopulationTwo Texas Metropolitan Areas Gain More Than 1 Million PeopleApril 18, 2019New population estimates for metropolitan areas show that some are among the top 10 population gainers but not the top 10 most populous.
-
Business and EconomyTracking Hurricanes’ Potential Impact on Workforce and IndustriesOctober 05, 2018In the wake of disasters, the U.S. Census Bureau’s Emergency Management Map provides information on workers and industries, such as manufacturing.
-
Business and EconomyFewer Workers as Number of Retail Clothing Firms ShrinkJuly 08, 2025As retail stores closed, employees left for other industries or jumped to new retail jobs.
-
PopulationThe Fourth of July: The Nation’s Population Then and NowJuly 02, 2025The U.S. population is nearly 123 times larger than it was in 1780, the nearest estimate to when the Declaration of Independence was signed in 1776.
-
Business and EconomyNonemployer Statistics Show Continued Growth in “Gig Economy” ActivitiesJuly 01, 2025New data visualization showcases the nonemployer industries that contributed to U.S. business revenue through gig activities.
-
PopulationStates With High Median Ages May Not be as Uniformly Old as You ThinkJune 26, 2025A state’s median age does not tell the whole story. Florida has the fifth highest median age yet also has counties younger than the national median.