
Official websites use .gov
A .gov website belongs to an official government organization in the United States.
Secure .gov websites use HTTPS
A lock (
) or https:// means you’ve safely connected to the .gov website. Share sensitive information only on official, secure websites.

Topics
Data & Maps
Surveys & Programs
Resource Library

Census Project Shows Job Flows By Institution, Degree, Major and Geography
Thinking about college? You may want to consider where you will likely locate to land your first job after you graduate and in what industry.
A good way to do this? Check out the U.S. Census Bureau’s Post-Secondary Employment Outcomes (PSEO), which shows where college graduates get jobs and in what industries.
On top of that, it does it by institution and type of degree.
“Thanks to this pilot, states, universities, and prospective students have the opportunity to see employment outcomes by program of study, by region and industry.”
— John Abowd, the Census Bureau’s chief scientist and associate director for Research and Methodology
The data address a major gap in education statistics by providing a much clearer picture of how graduates transition from school to employment.
The PSEO project tabulates employment flows and earnings outcomes by institution, degree level, and degree field, and provides counts of employment by employer industry sector and Census Division.
PSEO does this by linking university transcript data to the Census Bureau’s Longitudinal Employer-Household Dynamics (LEHD) records. Those records list job histories covered by unemployment insurance by employer, which is then linked to industry and location information on the employers.
“Up until now, individual states could only measure earnings and employment outcomes for persons who worked in the same state where they were educated,’’ said John Abowd, the Census Bureau’s chief scientist and associate director for Research and Methodology.
“Thanks to this pilot,” he said, “states, universities, and prospective students have the opportunity to see employment outcomes by program of study, by region and industry.”
What PSEO Offers
Currently, the PSEO statistics include data from the University of Texas System, Colorado Department of Higher Education, University of Michigan-Ann Arbor, and University of Wisconsin-Madison.
The figures below show where graduates with bachelor’s degrees from four flagship institutions work by Census Division.
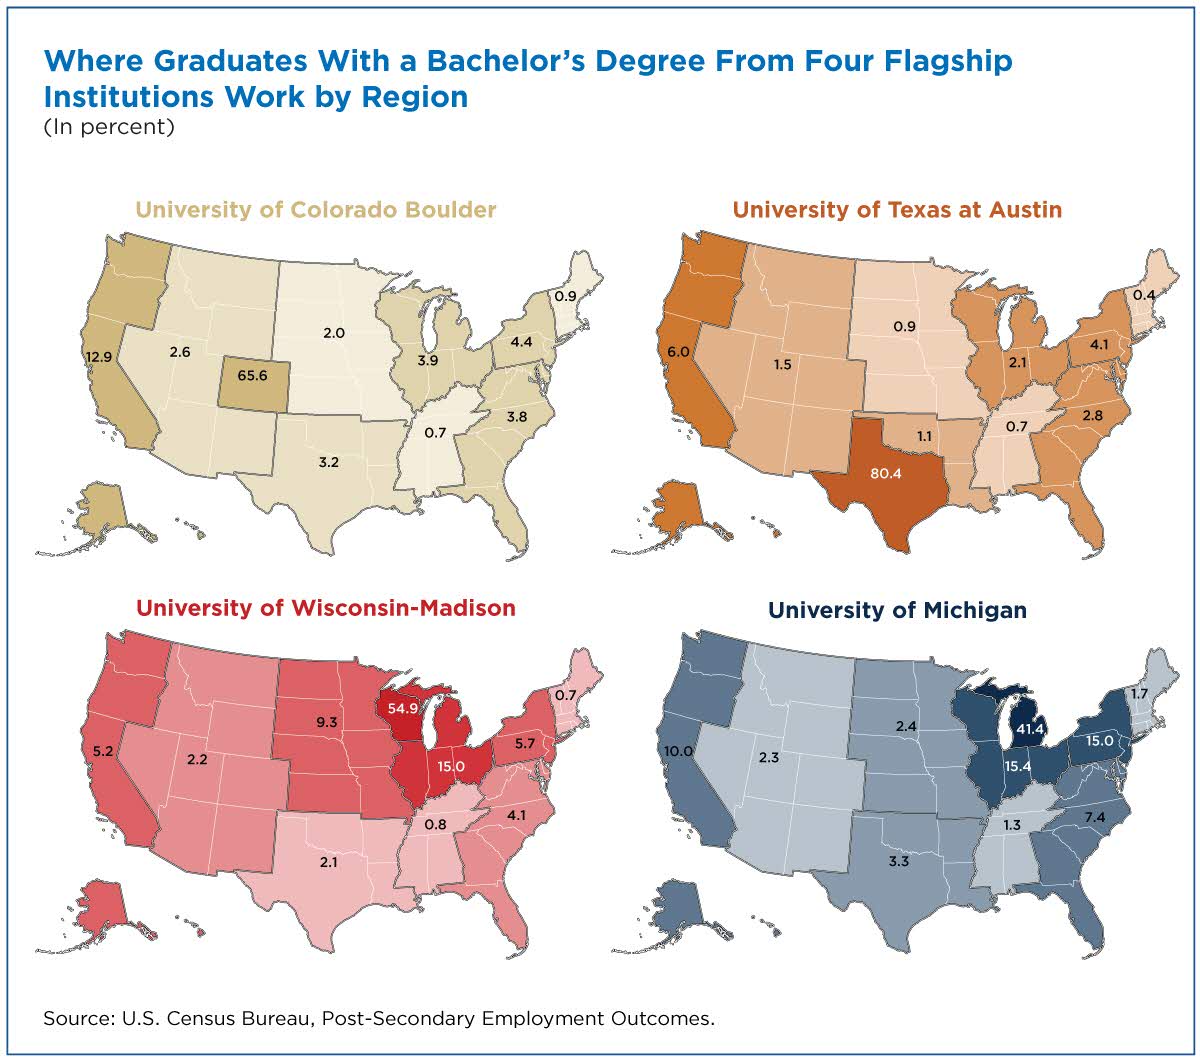
Do Graduates Find Jobs Nearby?
There are significant differences in the geographic dispersion of employment for graduates.
UT-Austin, for example, sees most of its students stay in the state, while University of Michigan graduates disperse across a wide geographic area.
University of Colorado Boulder and UW-Madison are somewhere in the middle of these two extremes.
First Post-Graduation Jobs Don't Always Match Field of Study
In addition to geographic dispersion, PSEO allows users to see the industry sector of employment for graduates.
The graphs below look at industry employment for all bachelor’s recipients in Colorado in three specific fields of study.
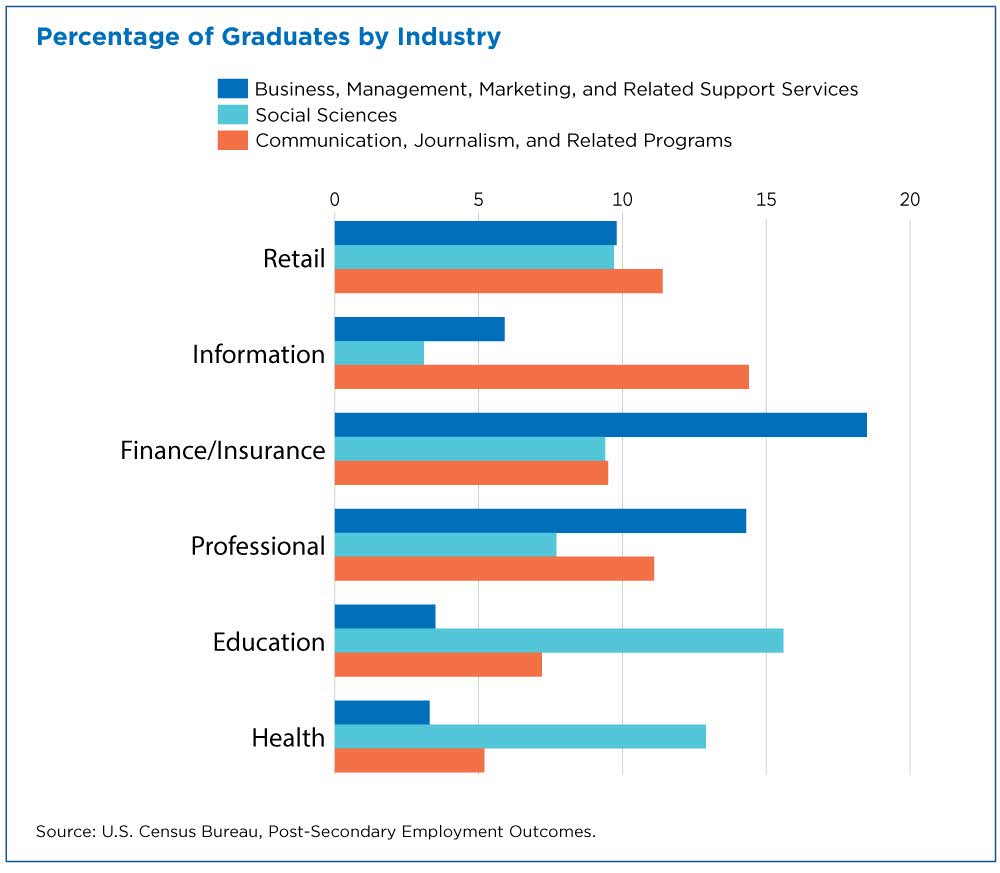
It’s clear that graduates in communications are more likely to land jobs in professional services, information and retail industries while social science graduates are more likely to end up in education and health.
Business majors are heavily concentrated in finance/insurance and professional services.
Important to the analysis of career paths, PSEO also measures how specific majors transition into highly-related fields.
The figure below measures the share of graduates from health programs who enter the health industry sector one year after graduation.
Surprisingly, individuals with master’s degrees in health are much less likely to end up working in the health industry than those with shorter-term certificate and associates degrees.
Instead, master’s graduates in health also end up in Education (22.2%) and Public Administration (7.2%).

All these tabulations are available on the PSEO website for download, as well as additional documentation. The Census Bureau is currently developing a data visualization tool for the employment flows data, which is scheduled for release in the coming months.
Andrew Foote is a senior economist at the Census Bureau and the lead researcher for the Post-Secondary Employment Outcomes project.
Revised Aug. 9, 2019. Note: The maps in this story were updated with correct data. Please disregard any previous version.
America Counts Story
College Degree Widens Gender Earnings Gap
More education leads to higher pay but the gender gap is greater among those with a bachelor’s degree than among those without.
America Counts Story
Number of People With Master’s and Doctoral Degrees Doubles Since 2000
About 13.1 percent of U.S. adults had a master’s or doctoral degree in 2018, up from 8.6 percent in 2000.
America Counts Story
How Much Is Your College Degree Worth?
The Census Bureau is collaborating with colleges and universities to provide national-level statistics on labor market outcomes for post-secondary graduates.
Page Last Revised - October 28, 2021
✕
Is this page helpful?
 Yes
Yes
 No
No
 Yes
Yes
 No
No✕
NO THANKS
255 characters maximum
 255 characters maximum reached
✕
Thank you for your feedback.
Comments or suggestions?

Comments or suggestions?