
Wyoming Has Largest Share of Any State Living in Micro Areas
For a lens on small-town America, turn to micropolitan statistical areas or “micros” for short.
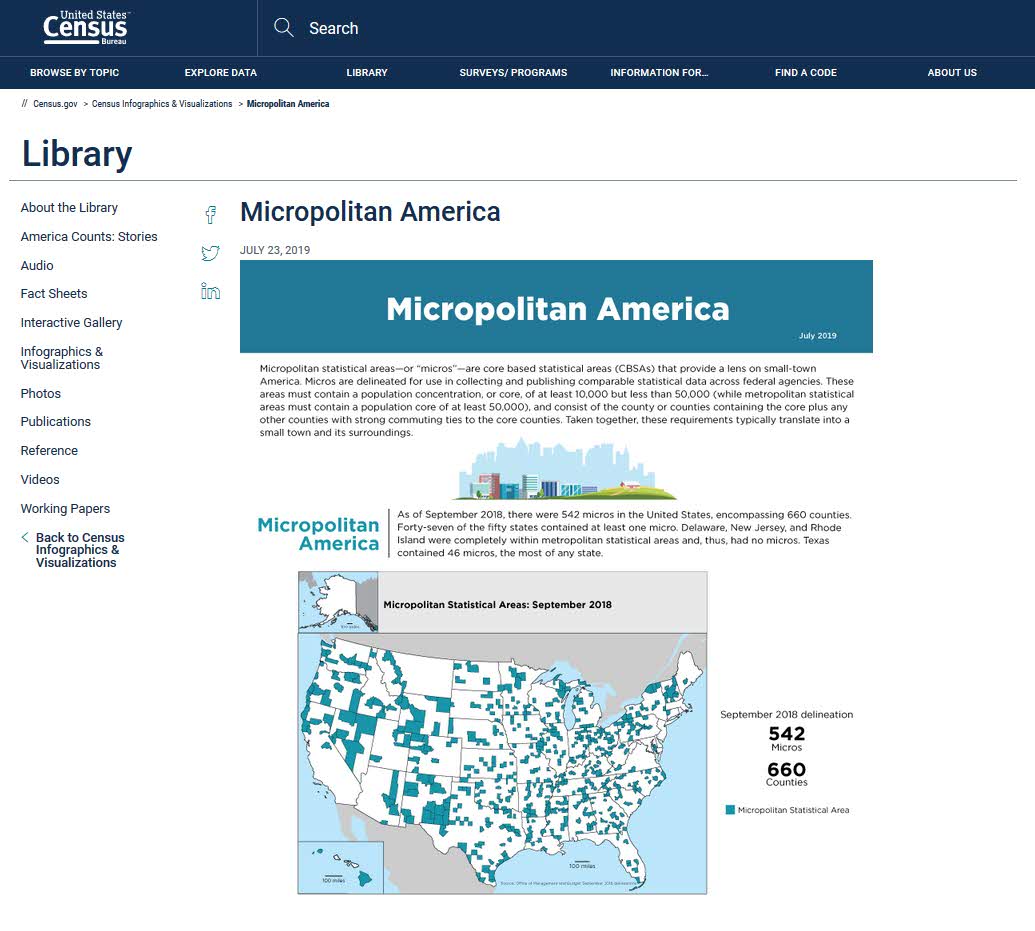
What’s a micro?
It’s a type of statistical area — first delineated by the U.S. Office of Management and Budget in 2003 — that provides more granular details of small population centers.
Wyoming had the highest share of any state population living in micros — 44.2% — while Delaware, New Jersey and Rhode Island had zero micros.
Micros must contain a population concentration, or core, of at least 10,000 but less than 50,000, the threshold for metropolitan statistical areas.
They consist of a central county (or counties) plus any other counties with strong commuting ties to it (or them).
Taken together, these requirements typically translate into a small town and its surroundings.

Micro America
As of September 2018, there were 542 micros encompassing 660 counties in the United States.
Some 27.2 million people (8.4% of the U.S. population) lived in these areas, according to 2017 Census estimates.
The proportion of state populations living in micros varies considerably.
Wyoming had the highest share of any state population living in micros — 44.2% — while Delaware, New Jersey and Rhode Island had zero micros.
Massachusetts had one, accounting for less than 1% of its population in 2017.

Fast-growing Micros in Some States
The growth rate of micros also varies from state to state.
Between 2000 and 2017, seven states had micro populations that grew faster than their overall populations: Hawaii, Massachusetts, Michigan, Montana, North Dakota, Utah, and Wyoming.
Utah’s micro population grew the fastest (43.6%) during that period.
Twelve states experienced overall growth but saw losses in their micro populations: Connecticut, Illinois, Indiana, Iowa, Kansas, Mississippi, New York, Ohio, Pennsylvania, Vermont, Virginia, and West Virginia.
Age, Race, Ethnicity
The population of micros skewed older than that of the United States as a whole in 2017. Higher proportions of the population were ages 55 and older, and lower proportions were between ages 25 and 49.
Micro areas were also less diverse than the nation as whole.
In 2017, the non-Hispanic white alone population accounted for 77.1% of the micro population compared to 60.7% of the total U.S. population.
Black alone, Asian alone, and Hispanic populations accounted for lower proportions of the micro population than those of the United States as a whole.

Jobs in Micro Areas
From 2013 to 2017, there were higher shares of workers in the following industries in micros than in the United States as a whole:
- Agriculture, forestry, fishing and hunting, and mining.
- Manufacturing.
By comparison, micros had lower shares of workers employed in these industries than the country as a whole:
- Finance and insurance, and real estate and rental and leasing.
- Professional, scientific and management, and administrative and waste management services.
When looking at occupational concentration, micros had lower shares than the country overall in management, business, and financial, and computer, engineering, and science occupations but a higher share in production occupations.
Visit Our Infographic
Related Statistics
Subscribe
Our email newsletter is sent out on the day we publish a story. Get an alert directly in your inbox to read, share and blog about our newest stories.
Contact our Public Information Office for media inquiries or interviews.
-
Population94.7M Americans Live in Coastline RegionsJuly 15, 2019Coastline counties most vulnerable to hurricanes continue to grow. In the midst of the Atlantic hurricane season. See how many people live along the coasts.
-
PopulationFast Growth in the Desert Southwest ContinuesFebruary 11, 2019One of the most arid parts of the country has enjoyed population growth of more than 40 percent in three different decades since 1950.
-
PopulationMoves to and From the South and West Dominate Recent Migration FlowsApril 29, 2019Domestic migration flows in the South and West are highlighted in three recent migration data releases.
-
Business and EconomyAI Use at U.S. BusinessesMay 26, 2026AI use grew between December 2025 and May 2026 across firm sizes and sectors.
-
Marriage and DivorceFewer Unmarried Women Gave Birth in the Past DecadeMay 19, 2026Several states in the South had higher levels of recent births to unmarried women than many states in the Midwest, Northeast and West.
-
PopulationMovin’ Out: More Growth on Outer Edges of Major CitiesMay 14, 2026New 2025 Census Bureau population estimates for cities and towns show population growth farther from city centers, but not for every city.
-
Small BusinessCensus Bureau Data Tell the Small Business StoryMay 04, 2026The 63rd Annual Small Business Week recognizes small businesses’ contribution to the nation’s economy.