
Official websites use .gov
A .gov website belongs to an official government organization in the United States.
Secure .gov websites use HTTPS
A lock (
) or https:// means you’ve safely connected to the .gov website. Share sensitive information only on official, secure websites.

Topics
Data & Maps
Surveys & Programs
Resource Library

Most Live in the South and West, a Dramatic Shift From a Century Ago
This story is part of an occasional series that offers an in-depth look at historical population trends.
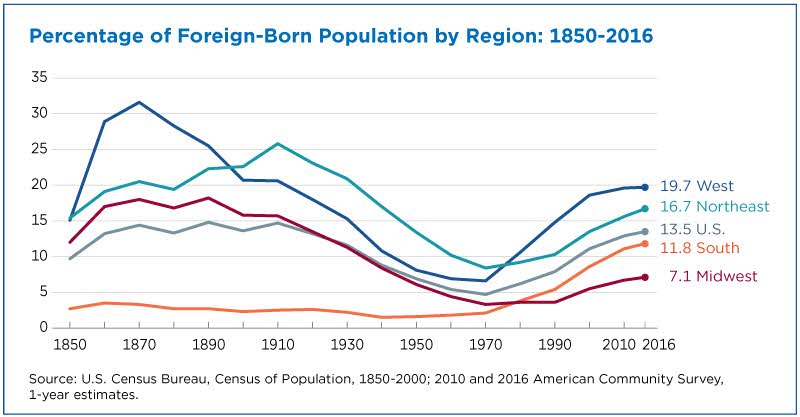
The number of foreign-born residents in the United States has ebbed and flowed over the past 165 years. By 2016, 13.5 percent of the U.S. population was foreign-born, a level that rivaled historic highs.
But what has changed considerably over time is who the foreign-born are and where they have dispersed across the country, according to U.S. Census Bureau research.
The foreign-born population includes anyone who is not a U.S. citizen at birth. This includes those who have become U.S. citizens through naturalization.
By 2016, the percentage of residents in the South who were foreign-born was higher than in the Midwest.
Immigration Policies, Economics Are Key Factors
The share who were foreign-born declined across all regions in the decades after the 1920 Census. Policies restricting the inflow and permanent settlement of the foreign-born as well as the Great Depression were major factors.
However, after the 1965 Immigration Act made entry into the United States more accessible, the number of foreign-born in the United States has risen, driven by newcomers from Latin America and Asia.
More Foreign-Born in All Regions
As a result, the percentage of foreign-born residents has increased in all four U.S. regions (Northeast, South, Midwest, West).
Until 1980, the percentage of residents in the South who were born in another country was well below that of other regions and the national average. By 2016, the percentage of residents in the South who were foreign-born was higher than in the Midwest.
Throughout all years, the West has had either the highest or the second-highest percentage of residents hailing from another country.
As shown below in Figure 2, the share of all foreign-born living in the United States was historically concentrated in the Northeast and Midwest regions. Until 1940, over 80 percent of all foreign-born in the United States resided in either of the two regions.
The foreign-born population eventually followed the rest of the U.S. population, expanding to the South and West. By 2016, more than two-thirds of the foreign-born resided in the South or West.
The share of foreign-born living in the South has risen over time, while the share of foreign-born living in the West increased for decades until peaking in 1990.

Geographic Dispersal
Comparing Figures 1 and 2 highlights key features of where the foreign-born live.
While the percentage of foreign-born has grown in all regions over the last few decades, (Figure 1), the distribution of the foreign-born population has increased in the South and West, mirroring a similar pattern for the overall population (Figure 2).
During the early periods of analysis, the overall share of foreign-born for some regions, particularly the West, was relatively small (Figure 2) but the percentage of foreign-born within the region relatively high (Figure 1) due to small overall populations.
For example, about 32 million people were counted in the 1870 Census, with just under 1 million living in the West. Of those, almost 32 percent, or 313,000, were foreign-born, which is more than 10 percentage points higher than other regions at that time.
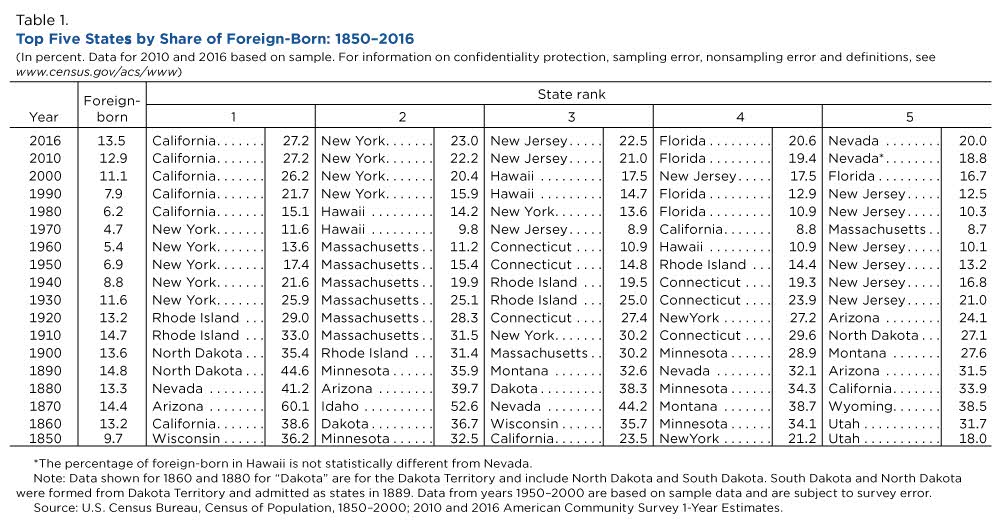
The evolving geographic pattern of foreign-born settlement can also be seen at the state level. Table 1 shows that the top five states with the highest percentage of foreign-born residents have shifted over time.
States With High Share of Foreign-Born
States that frequently have the highest share of residents who are foreign-born are New York (13 times), New Jersey (10 times) and California (9 times).
Other states only made the top five list for short periods of time.
North Dakota made the list in 1890 and 1900. Florida, fourth in 2016 in the share of residents who are foreign-born, first made an appearance on the list in 1980.
Nevada is somewhat unique in that the Silver State was among the top five states in share of residents who are foreign-born in the three censuses after joining the Union in 1864. It reemerged in 2010 as one of the top states.
The distribution of the foreign-born population at the state level continues to evolve, as the current top-destination states receive a smaller share of new arrivals, opening the possibility of newer states making the top five list.
The share of foreign-born living in the South has increased over time, while the share of foreign-born living in the West increased for decades until peaking in 1990.
Mix of Migrants Unique to Place and Time
While foreign-born levels have risen and fallen over the past century and a half, each region and each historical period attracts a unique mix of migrants.
Table 2 shows the top five countries of birth for the foreign-born in 1910 and 2010.
Regional variation in 1910 shows that people born in Germany were the largest group in each region except the Northeast, where immigrants from Russia, Italy and Ireland were most numerous.
Those born in England were in the top five groups of foreign-born only in the West. Immigrants from Mexico appeared in the top five groups of foreign-born in the South but not in other U.S. regions.
The foreign-born population in each region continues to show diversity in 2010.
For example, the foreign-born from the Dominican Republic appear in the top five places of birth only in the Northeast, where they are the largest immigrant group. Cubans are among the top five foreign-born groups in the South, while the foreign-born from Poland make the top five in the Midwest.
A comparison of the top five immigrant groups living in each region in 1910 and 2010 shows that the composition of foreign-born has changed drastically.
No country of origin listed among the top five foreign-born groups in a given region in 1910 ranks among the top five countries of origin in any region in 2010, with the exception of Mexican-born in the South.
How the origin of the foreign-born changed over the course of a single century is due largely to different national policies, as well as shifting conditions in the countries of origin.

Some Countries of Origin Place High in All Regions
In some cases, a foreign-born group may fall in the top five countries of origin across all four regions during a given census year — those born in Germany in 1910, for example, and those born in Mexico in 2010.
In other cases, a foreign-born group may be listed in the top five countries of origin in just one region. Examples include those born in Ireland and living in the Northeast in 1910 and those born in Jamaica and living in the Northeast in 2010.
Since 1850, the foreign-born population has dispersed throughout the regions but the makeup of the foreign-born within each region remains distinct and unique.
As the share of foreign-born residents today matches historic highs from the late 1800s and early 1900s, foreign-born groups will continue to play a role in contributing to regional differences in culture as they have throughout much of American history.
Related Statistics
Subscribe
Our email newsletter is sent out on the day we publish a story. Get an alert directly in your inbox to read, share and blog about our newest stories.
Contact our Public Information Office for media inquiries or interviews.
-
PopulationFast Growth in the Desert Southwest ContinuesFebruary 11, 2019One of the most arid parts of the country has enjoyed population growth of more than 40 percent in three different decades since 1950.
-
PopulationA Snapshot of the Fast-Growing U.S. Older PopulationOctober 30, 2018The growth of the U.S. population age 65 and older exceeds that of the total population and the population under age 65.
-
Families and Living ArrangementsRace, Ethnicity and Marriage in the United StatesJuly 09, 2018Every state has seen an increase in the percentage of married-couple households that are interracial or interethnic, but changes varied across the U.S.
-
PopulationWhich States Had the Highest Shares of Newcomers?April 29, 2025Many states with the highest share of recent movers from out-of-state in 2023 had relatively small populations.
-
Business and EconomyEntertainment, Travel, and Recreation Industries ReboundingApril 23, 2025A look at which selected travel, entertainment and recreation-related industries hit hard by the pandemic rebounded.
-
Income and PovertyNew Snapshots From the Survey of Income and Program ParticipationApril 21, 2025New Census Bureau product offers mobile-friendly fact sheets on who receives income from various sources.
-
PopulationU.S. Metro Areas Experienced Population Growth Between 2023 and 2024April 17, 2025New Census Bureau population estimates show 88% of U.S. metro areas gained population between 2023 and 2024.
Page Last Revised - October 2, 2024
✕
Is this page helpful?
 Yes
Yes
 No
No
 Yes
Yes
 No
No✕
NO THANKS
255 characters maximum
 255 characters maximum reached
✕
Thank you for your feedback.
Comments or suggestions?

Comments or suggestions?