
Official websites use .gov
A .gov website belongs to an official government organization in the United States.
Secure .gov websites use HTTPS
A lock (
) or https:// means you’ve safely connected to the .gov website. Share sensitive information only on official, secure websites.

Topics
Data & Maps
Surveys & Programs
Resource Library

Most Older Adults Lived in Households with Computer and Internet Access
The growth of the U.S. population age 65 and older exceeds that of the total population and the population under age 65.
Lower birth rates and increased longevity have led to this rapid growth not just in the United States but across the world.
So what does it mean to be a part of this increasingly larger segment of American society?
Use this interactive data visualization to see variations in the characteristics of the older U.S. population among the states.
Clicking on the map below shows that about 1 out of 5 people in Florida, Maine, and West Virginia is age 65 or older.
Change the characteristic in the interactive map and see which states have the highest percentage of older populations with internet access, for example, or the lowest percentage with a disability.

Older Population in Three Age Brackets
This data visualization supplements a new U.S. Census Bureau report, The Population 65 Years and Older in the United States: 2016.
This report provides a snapshot of selected demographic, social, housing, and economic characteristics of the 65 years and older population in the United States based on 2016 American Community Survey (ACS) one-year data.
The report also draws comparisons between people at different stages of aging: those ages 65 to 74, 75 to 84, and 85 and older.
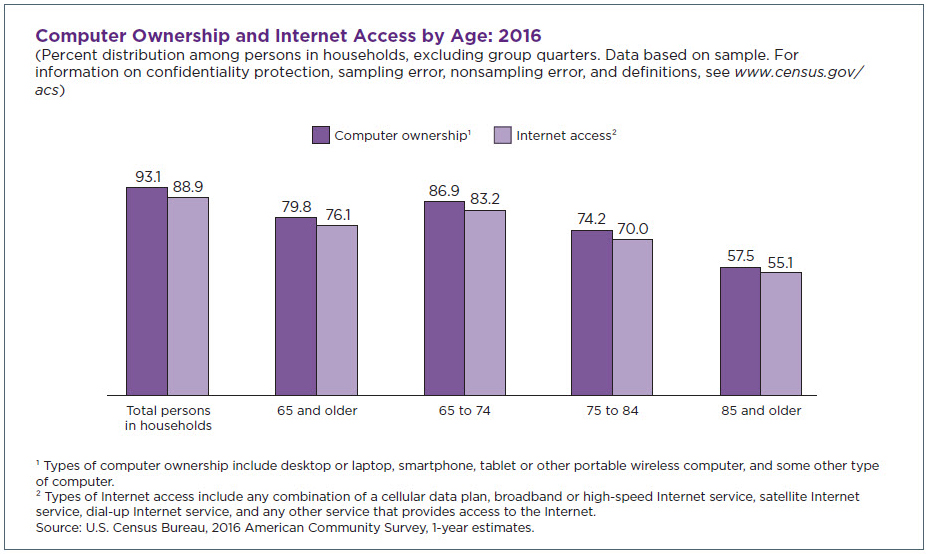
Majority of Older Americans Have Internet Access
Many of the norms associated with old age have changed in recent years. For example, for the population age 65 and older who lived in a household, around 80 percent lived in a household that had a computer and over 75 percent lived in a household with access to the internet.
Among the older population, computer ownership (87 percent) and internet access (83 percent) were greatest for people ages 65 to 74 years.
A Number of Older Americans Still in the Labor Force
The report also finds that around 30 percent of males and 22 percent of females ages 65 to 74 were in the labor force.
While lower than the labor force participation rates among all males (68 percent) and females (58 percent) ages 16 and over, these proportions are consistent with trends showing increasing numbers of people 65 and older in the workforce.
Yet, some characteristics associated with the older population remain consistent even as changes happen.
Serious difficulty walking or climbing stairs was the most prevalent disability for all older population groups. Over 15 percent of those ages 65 to 74 had difficulty with this, along with over a quarter of those ages 75 to 84 and almost half of those 85 and older.
About 69 percent of the population 85 and over had at least one type of disability, compared with just 9 percent of the population under the age of 65.
Key Highlights
Demographic Characteristics:
- Those ages 65 to 74 were the largest among the three age groups, numbering 28.7 million or 58 percent of the 49.2 million older population.
- There were more females than males, especially at the oldest ages. For those ages 65 to 74, there were 89 males for every 100 females, compared with 53 for the population 85 and older.
- The older population was largely white alone, non-Hispanic (or “white” in this instance), especially among the oldest. More than 80 percent of the population 85 and older was white, compared with 61 percent white for the overall U.S. population.
Social and Housing Characteristics
- Although most of the older population had been married at some point in their lives, a majority of females age 85 and older (72 percent) were widowed while more than half of their male counterparts (54 percent) were still married.
- The likelihood of living in a family household diminished with age, from 73 percent among people between ages 65 and 74 to 48 percent for those 85 and older. Conversely, people living alone almost doubled from 22 percent for the younger age group of older Americans to 39 percent for the oldest.
- About 9 out of 10 older whites and blacks were born in the United States compared with about 4 out of 10 older Hispanics and 1 out of 10 older Asians — a reflection of Hispanics and Asians being more recent migrants to the United States with migration much more likely among young adults.
- A greater share of older males than older females had at least a bachelor’s degree.
- The homeownership rate (the percentage of all occupied housing units that are owner-occupied) was highest among people ages 65 to 74 (79 percent). It was also higher for the two other older age groups (79 percent and 69 percent, respectively) compared with the rate for all ages (63 percent).
Economic Characteristics
- The most common type of household income received in the past 12 months among the population 65 and older was social security (90 percent).
- Noncitizens 65 and older were most likely to be in service occupations (36 percent), while native-born citizens of the same age were most likely to be in management, business, science, and arts occupations (42 percent).
- Earnings went from the most common form of income among the population under age 65 to the least common for the population 65 years and older. However, among the population age 65 and older who did work, the median earnings for those with a bachelor’s degree or higher was over two and half times the amount earned by those with less than a high school degree in the same age group ($76,060 compared with $28,520).
- The percentage of people in poverty was lower for the population age 65 and older than for the total population but a higher percentage of older women (about 11 percent) than older men (about 7 percent) were in poverty. The poverty rate for Asians 85 and older was even higher, at 18 percent.
Andrew Roberts is the chief of the Sex and Age Statistics Branch in the U.S. Census Bureau’s Population Division. Stella Ogunwole, Laura Blakeslee, and Megan Rabe are demographic statisticians in that branch.
Page Last Revised - February 1, 2023
✕
Is this page helpful?
 Yes
Yes
 No
No
 Yes
Yes
 No
No✕
NO THANKS
255 characters maximum
 255 characters maximum reached
✕
Thank you for your feedback.
Comments or suggestions?

Comments or suggestions?