
Official websites use .gov
A .gov website belongs to an official government organization in the United States.
Secure .gov websites use HTTPS
A lock (
) or https:// means you’ve safely connected to the .gov website. Share sensitive information only on official, secure websites.

Topics
Data & Maps
Surveys & Programs
Resource Library
Overall Mover Rate Remains at an All-time Low
In 2017, renters moved less than any year since 1988, setting a historic low of 21.7 percent in 2017, compared to 35.2 percent in 1988. However, the most recent mover rate for renters (21.7 percent) was higher than for owners, which was 5.5 percent in 2017.
“Although renters continued to move at higher rates compared to owners, the decrease in the overall mover rate was partially driven by declining mover rates for renters,” said Charlynn Burd, a geographer with the U.S. Census Bureau's Social, Economic and Housing Statistics Division. “Housing reasons continued to be the most often cited reason for moving.”
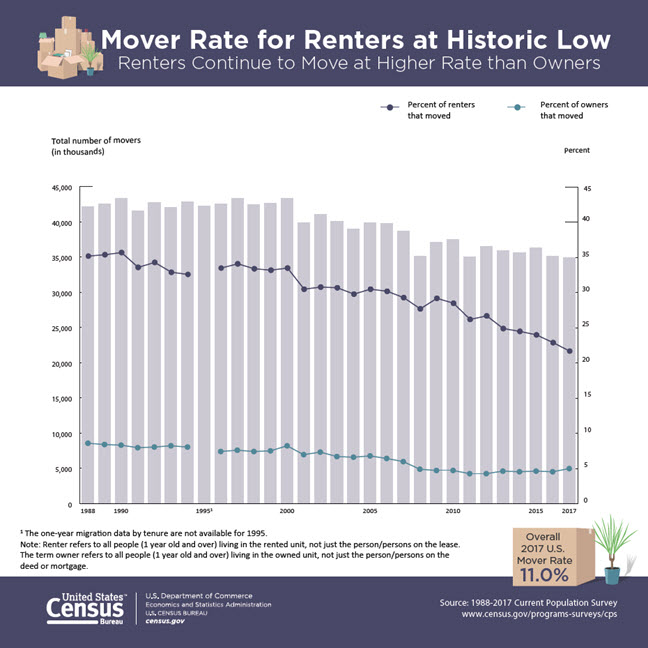
The graphic above illustrates these trends using statistics from the Current Population Survey Annual Social and Economic Supplement (CPS ASEC).
In 2017, movers reported moving for the following reasons:
- Housing-related reason (43.0 percent).
- Family-related reason (27.9 percent).
- Employment-related reason (18.5 percent).
- Some other reason (10.6 percent).
Overall, the 2017 mover rate for U.S. residents age 1 and older was 11.0 percent (34.9 million), which was not statistically different from last year’s all-time low of 11.2 percent (35.1 million). This means that the overall mover rate remains at an all-time low.
Mover Rates by Region
The mover rates by region in 2017 were:
- Northeast: 8.3 percent.
- Midwest: 11.4 percent.
- West: 11.5 percent.
- South: 11.8 percent.
The Midwest, West and South were not statistically different from one another.
Mover Rates by Race/Ethnicity
The highest mover rates by race were the black or African-American alone population, while the lowest were the non-Hispanic white population. Here are the mover rates by race and ethnicity:
- Black or African-American alone population: 13.1 percent.
- Asian alone population: 12.1 percent.
- Hispanic or Latino population: 11.7 percent.
- White alone population: 10.3 percent.
- Non-Hispanic white population: 10.0 percent.
Mover Rates Within the Previous Five Years
In 2015, 99.8 million people age 5 and older had moved within the previous five years (2010 to 2015). However, this is not statistically different from the 100.2 million who moved within the previous five years in 2010 (2005 to 2010). The five-year moving rate declined from 35.4 percent in 2010 to 33.7 percent in 2015, a historically low rate for CPS geographic mobility estimates.
Among young adults, five-year moving rates were higher than the national average of 33.7 percent. Also, these mover rates for young adults decreased more than the national average.
- For 18- to 24-year-olds, 45.2 percent moved from 2010-2015, down from 48.0 percent for 2005-2010.
- For 25- to 29-year-olds, 61.2 percent moved from 2010-2015, down from 65.5 percent for 2005-2010.
- For 30- to 34-year-olds, 52.5 percent moved from 2010-2015, down from 57.0 percent for 2005-2010.
Geographical Mobility Statistics
The U.S. Census Bureau offers a range of statistics on geographic mobility and migration using multiple data sources. For more information about these data sources and the types of statistics they produce, see the Migration/Geographic Mobility page.
The selected statistics presented in this story come from Geographical Mobility: 2016 to 2017 and Geographical Mobility: 2010 to 2015, which are collections of national and regional tables from the CPS ASEC. The tables describe the movement of people in the United States, including type of move and characteristics of those who moved.
Data products available with this release are:
- Geographical Mobility: 2016 to 2017 (CPS ASEC).
- Geographical Mobility: 2010 to 2015 (CPS ASEC).
- State-to-State Migration Flows: 2016 (American Community Survey 1-Year Estimates).
- State of Residence by Place of Birth: 2016 (American Community Survey 1-Year Estimates).
Additionally, the Census Flows Mapper tool released in August now includes statistics from the 2011-2015 American Community Survey to show demographic statistics for movers between county by selected characteristics including sex, age, race and Hispanic origin. Furthermore, the 2011-2015 migration flow statistics are available through the Census Bureau’s application program interface.
Notes: “Renter” refers to all people living in the rented unit, not just the person/persons on the lease. “Owner” refers to all people living in the owned unit, not just the person/persons on the deed or mortgage.
Derick Moore is a Senior Communications Specialist at the Census Bureau.
America Counts Story
Social, Economic Change Affect Decisions to Move Out of State
States, such as Florida and Arizona, that had many more people move in than move out in 2005 experienced a much smaller gain in 2010 but bounced back by 2015.
America Counts Story
Big and Small America
There are striking differences in age, race and ethnicity between big-county America and small-county America.
America Counts Story
Number of Housing Units Fluctuates in Past Decade
States where housing units were booming from 2006-07 declined mid-decade but started gaining again in 2015-16. Some states have been losing all along.
Page Last Revised - October 8, 2021
✕
Is this page helpful?
 Yes
Yes
 No
No
 Yes
Yes
 No
No✕
NO THANKS
255 characters maximum
 255 characters maximum reached
✕
Thank you for your feedback.
Comments or suggestions?

Comments or suggestions?