An official website of the United States government
Here’s how you know
Official websites use .gov
A .gov website belongs to an official government organization in the United States.
Secure .gov websites use HTTPS
A lock (
) or https:// means you’ve safely connected to the .gov website. Share sensitive information only on official, secure websites.
-
//
- Census.gov /
- Library /
- America Counts: Stories /
- Number of Housing Units Fluctuates in Past Decade
Some States That Lost Housing Bounced Back But Not Completely
The nation’s housing stock has gone through three distinct phases in the last 10 years: from a period of increases in many areas in the early part of the decade, to a mid-decade decline in more counties, and back to a more modest increase in the latter part of the decade.
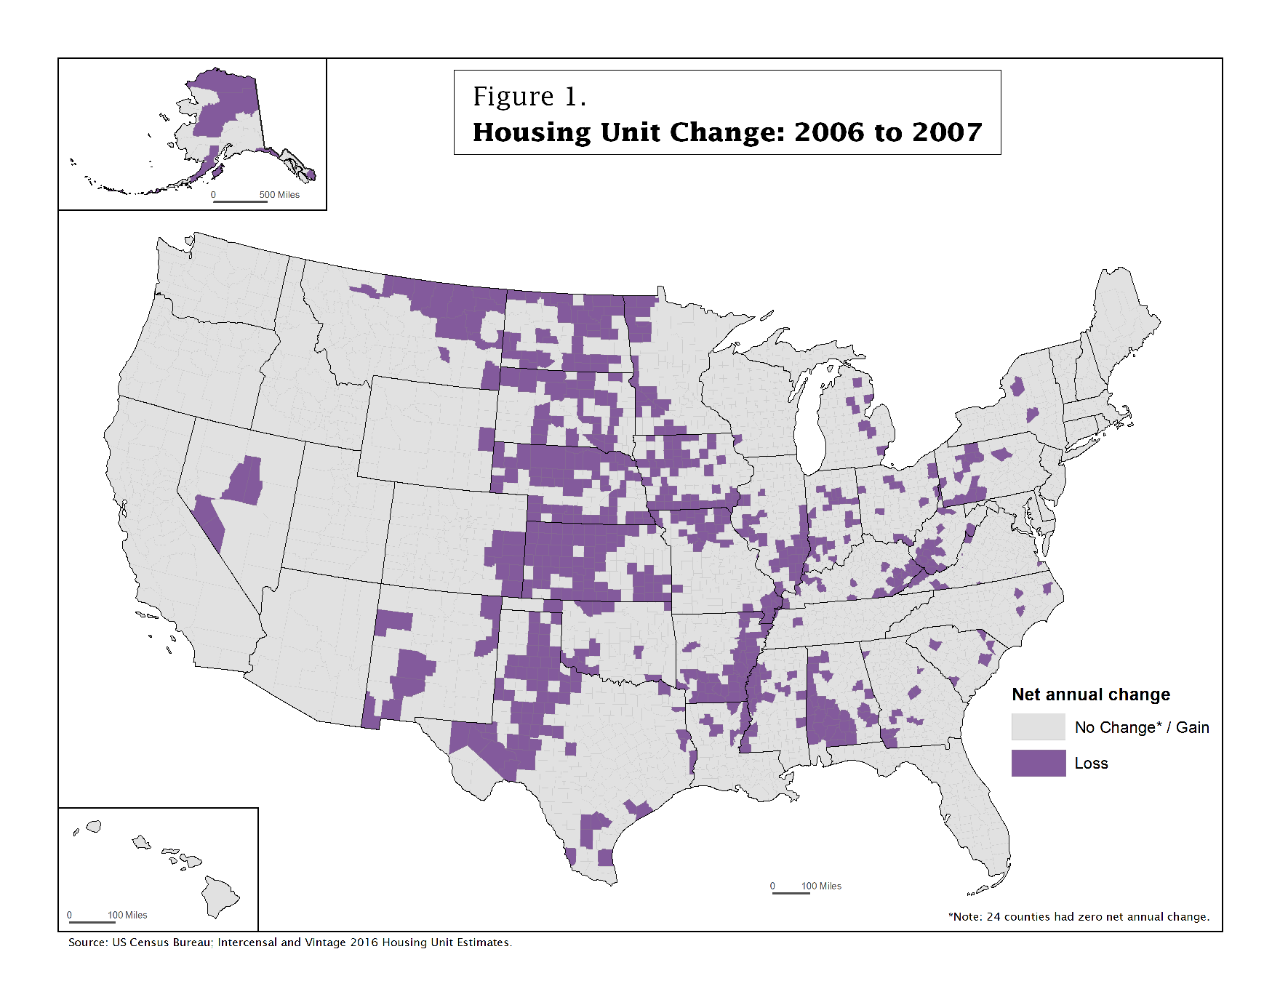
Between 2006 and 2007, most counties had either a stable inventory of housing units or an increase, according to U.S. Census Bureau research.
“Almost 2,500 counties or 79 percent stayed the same or grew,” said Luke Rogers, a demographer in the Population Division at the Census Bureau. “Twenty-one percent, or 666, declined. Most decreases were in the Midwest, along the Mississippi River, and in parts of Appalachia.”

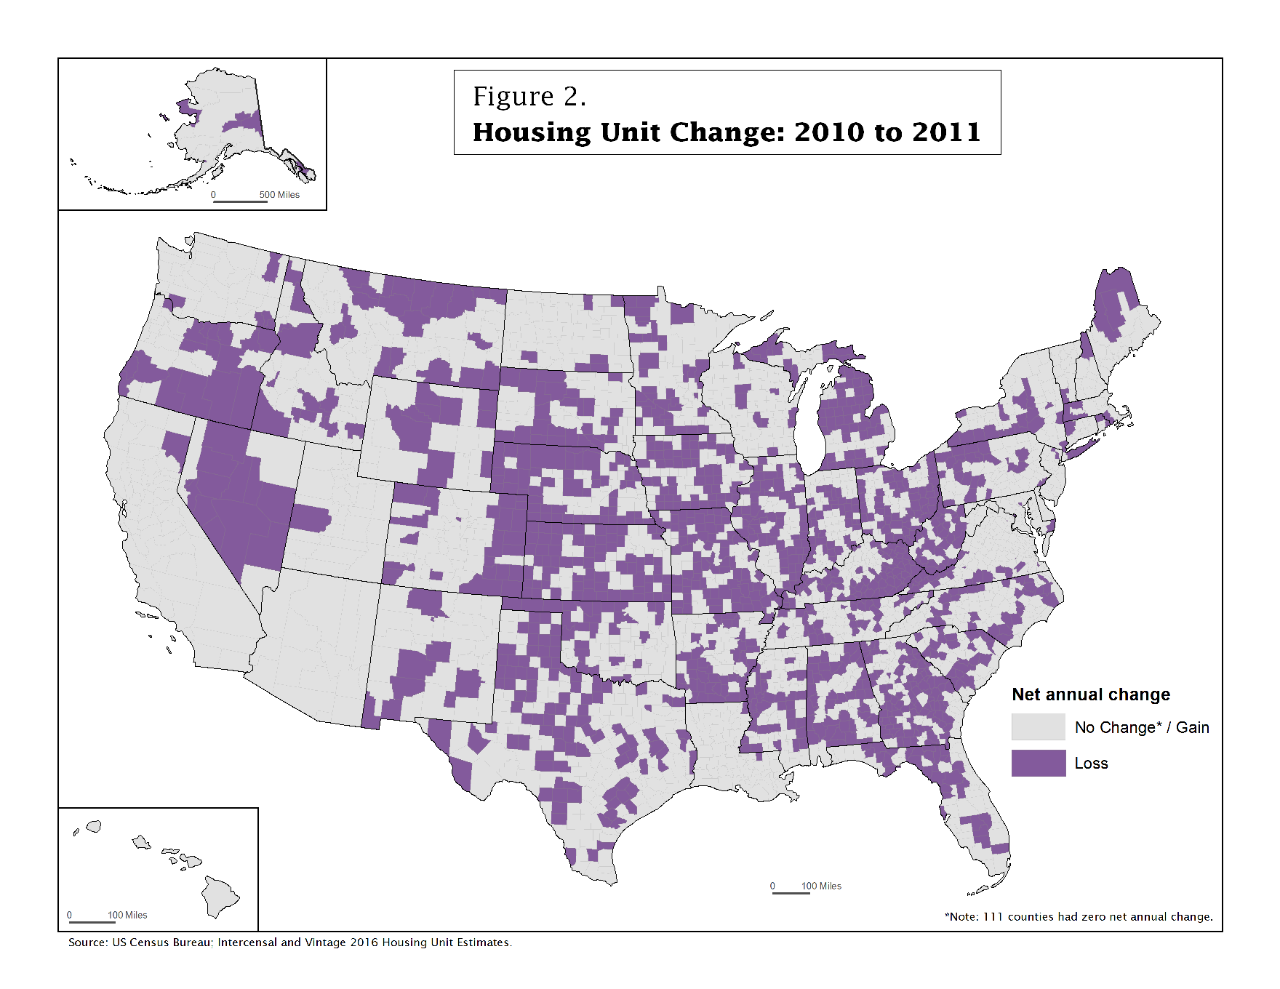
Between 2010 and 2011, the number of counties that experienced no change or gained housing dropped to 1,829, or 58 percent, and the number of counties that lost housing units almost doubled to 1,313, or 42 percent.
The same areas that had been losing housing continued to lose housing during that period. Other areas, such as the South, the Pacific Northwest and parts of the Northeast that had all been gaining in the early part of the decade showed declines.
“What really stands out is that Nevada, Oregon and Florida, all the way to North Carolina, switched pretty dramatically,” Rogers said

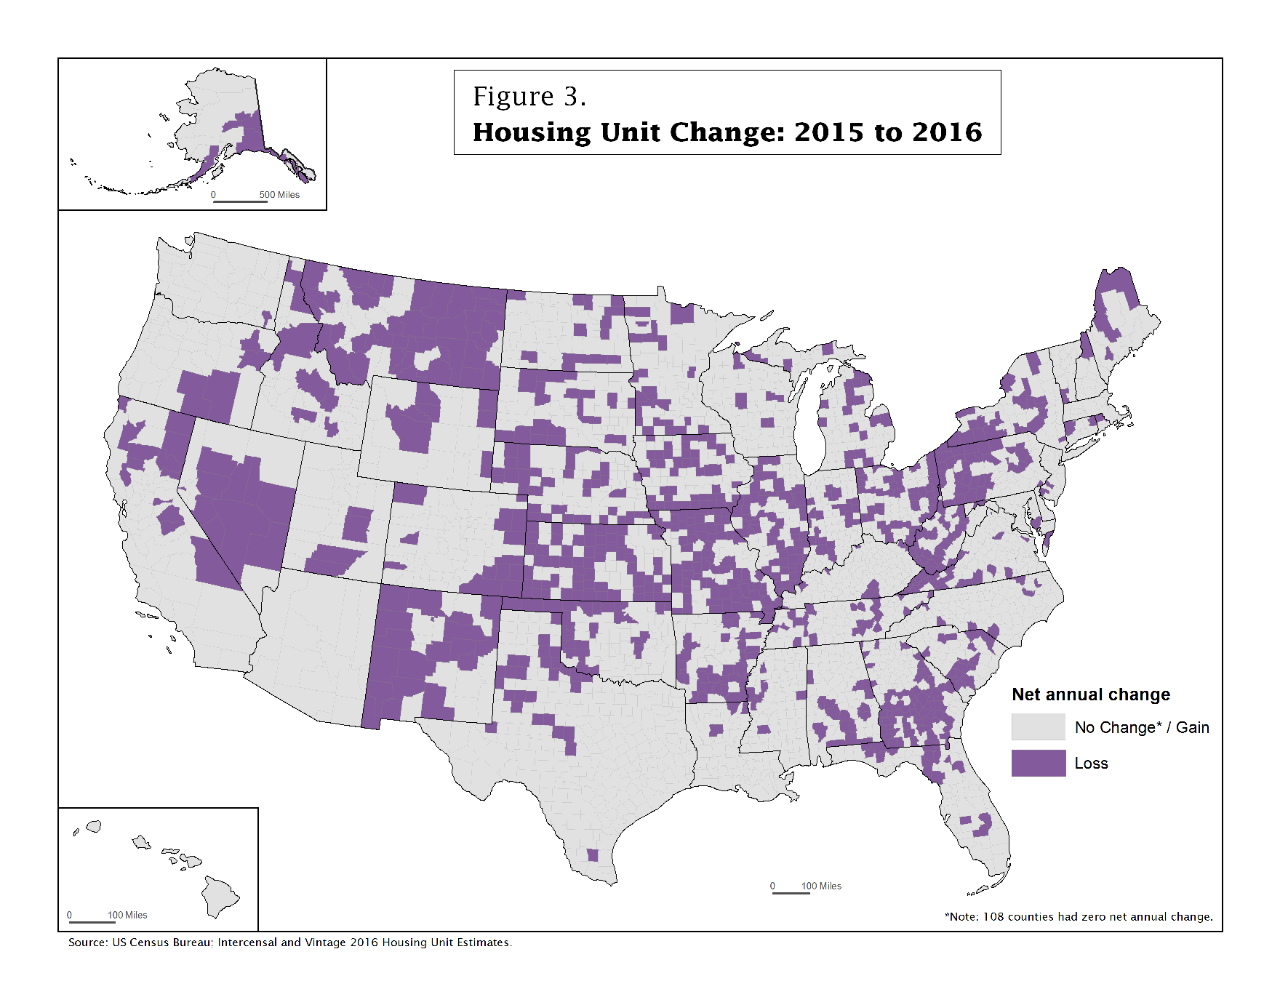
Between 2015 and 2016, the number of counties that stayed the same or gained housing units bounced back, but not quite to the levels of 2006 and 2007. The number of housing units stayed the same or increased in 2,194 (70 percent) counties. As a result, the number of counties that lost housing went down to 948 or less than a third of all counties.
The map below shows clusters of counties that lost housing units in areas that showed declines throughout the decade but also in parts of the South, Northeast and West, an indication that the rebound is still spotty.

States such as Florida, Oregon and Texas, where numerous counties lost housing from 2010-2011, showed more counties with gains.
“Some areas had counties that experienced housing unit loss at all three time points, while other areas had counties that experienced gain at some time points and loss at others,” Rogers said.
Rogers and co-author David Armstrong, a demographer in the population division, used information on the number of permitted housing units (new construction) and the number of recorded demolitions. These estimates are available on the Census Bureau’s website for the Population Estimates Program.
Share
 Yes
Yes
 No
NoComments or suggestions?


Top

