Births, Deaths, and Migration Transform Communities
The U.S. population is constantly changing. As a nation, we are growing older and becoming more diverse. To help us better understand our nation’s demographic transformation, the Census Bureau is developing a series of features. Each will explore the experiences of the U.S. population as these changes play out in every region and state across the nation.
Studying Population Change
Census Bureau demographers produce and analyze population estimates and projections to measure changes in age structure, the ratio of men to women, and the racial and ethnic make-up of the nation’s population. Demographic trends become apparent to us in many ways, such as the types of businesses we see in our communities, the people we encounter at the grocery store, or even the make-up of our own families. Many different stories interact to shape our future population. Yet underlying all these stories are just three basic demographic processes that are responsible for all changes to a population: births, deaths, and migration.
For a primer on these demographic components of change, check out this earlier blog at Growth or Decline: Understanding How Populations Change.
This is the first feature in our series, which seeks to provide a broad overview of national trends by region and state. We will highlight the main drivers of change in the population: natural increase (more births than deaths) and natural decrease (more deaths than births); net domestic migration (people crossing state or county lines); and international migration from or to other countries. Under each category, we will highlight the states whose populations were most affected by these factors.
Our first two features in the series will focus on states where births and deaths affected the population the most. We will follow that with features on states that gained or lost through domestic migration and states that grew because of international migration. Once the main drivers of change are covered additional features covering a variety of topics related to population change will follow. Some features will take the form of interactive web-based applications, which will allow for a more complete exploration of the demography driving our nation’s stories.
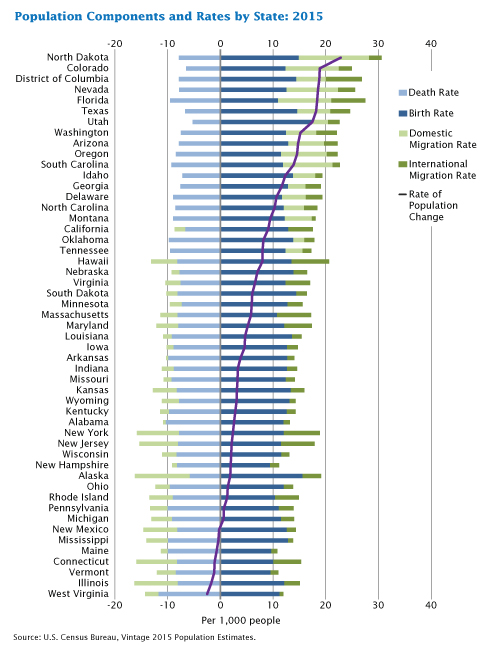
Figure 1 allows you to see the demographic components of change for all 50 states and the District of Columbia.
FIGURE 1

TRENDS IN POPULATION CHANGE
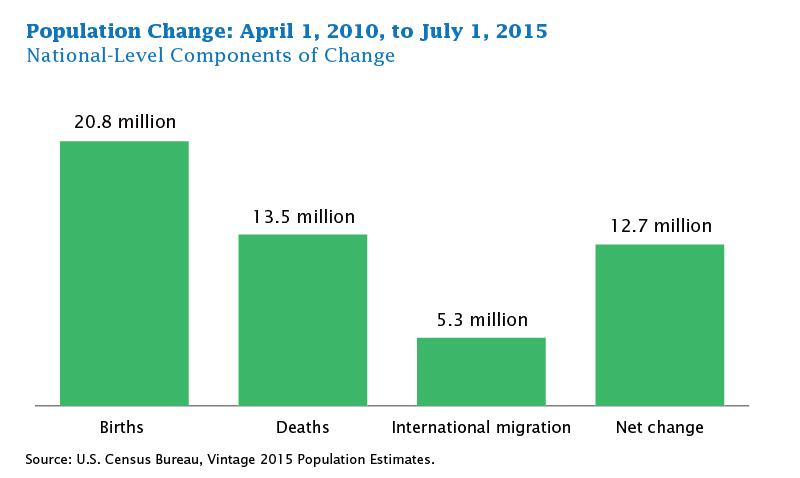
Before looking at individual states, here is a broad overview of national, regional, and state trends. Births continue to be the primary driver of population change. Figure 2 shows births between April 1, 2010 and July 1, 2015 along with deaths, net international migration, and the total change for the same period.
FIGURE 2

The racial and ethnic make-up of parents is becoming more diverse. The result is a more diverse younger population. While the U.S. birth rate has fallen to historical lows and the number of births recently dropped below 4 million, in the years just prior to 2010, the number of births rivaled those in the baby boomer cohorts and exceeded the largest birth cohorts of the millennials. The more recent birth cohorts are considerably larger than those that just followed the baby boomers in the 1970’s and early 1980’s. Figure 3 shows the total number of births starting in 1909 and ending in 2014.
FIGURE 3

International migration is simultaneously adding to the population and contributing to the increase in diversity through in-migrants and higher birth rates. Figure 4 shows that in recent years, the level of international migration from Mexico has decreased while migration from India and China has increased.
FIGURE 4

Within regions, the pattern of growth in the South and West – now home to almost two-thirds of the nation’s population -- continues. Almost 38 percent of the U.S. population live in the South and almost 24 percent in the West. More than half of the national growth from 2010 to 2015 was in the South and a third in the West. At the same time, population in Northern states keeps dropping. More than 62 percent of the population lived in the North in 1900. This fell to 52 percent in 1970 and has now slipped below 39 percent. These changes reflect a general pattern of domestic migration from Northern states to the South and West.
Within states, the domestic migration of those seeking jobs or retiring and leaving the workforce continues to have an impact on areas with new job growth or large numbers of people entering retirement. International migrants continue to settle in states with already large migrant populations, while also establishing new immigrant destinations. In the near future, as the mostly White non-Hispanic baby boomers age, their mortality will rise, accelerating the increase in the diversity of the nation as a whole. Figure 5 shows the racial and Hispanic origin make-up of the population in the baby boom ages.
FIGURE 5

Jason Devine is Assistant Division Chief, Census Programs Area in the Population Division.


