Home-Based Workers in the United States: 2010
Home-Based Workers in the United States: 2010
Introduction

As communication and information technologies advance, workers are increasingly able to perform work at home. Since work is often more than simply a means of making a living, but tends to dictate how people organize their lives, changes in work patterns have both economic and social implications. Accordingly, timely data on the characteristics of home-based workers is of interest to researchers and policy makers, including those in the fields of transportation, employment, planning, and housing. This report provides information about the characteristics of home-based workers in 2010.
The data used in this report primarily come from two different surveys administered by the U.S. Census Bureau. The Survey of Income and Program Participation (SIPP) is a nationally representative longitudinal survey of about 50,000 households. Since the mid-1990s, the Work Schedule Topical Module of SIPP has included questions specifically designed to estimate the number of people who work at home at least one full day during a typical workweek.1 One of the goals of this module is to capture work done at home instead of another location for employed respondents who are at least 15 years old. These data are the source of a large, detailed set of tabulations, some of which are available in this report.2
The American Community Survey (ACS), fully implemented in 2005, is a nationally representative survey with an initial sample size of about 3 million addresses. This survey produces annual estimates of population and housing characteristics for the nation and at subnational levels. The ACS includes a question on means of transportation to work asked of all respondents aged 16 and over who were employed during the week prior to the ACS interview week. This report focuses on respondents who selected “worked at home” to the means of transportation to work question. Figure 1 is a reproduction of this questionnaire item.
Prior to the ACS, means of transportation to work was asked in the “long form” portion of the once-a-decade decennial census.3 The “long form” questionnaire was administered to approximately 1 out of every 6 housing units in the United States. For comparison purposes, this report uses data on home-based workers collected in the Census 2000 to examine time trends in home-based work from 2000 to 2010. However, the primary focus of this report is on the more recent data on home-based workers collected in the SIPP and the ACS.
The SIPP and ACS provide both timely and comprehensive data on home-based workers in the United States. The first section of this report looks at recent historical trends in the number of people who work from home using multiple years of the SIPP and ACS. In the second section, data from both surveys, as well as previous decennial censuses, are used to disaggregate home-based workers by socio-demographic and economic characteristics. The third section of the report uses SIPP data to describe the characteristics of the work schedules of those that work from home. The final section uses ACS data to examine metropolitan variation in home-based work.
_______________
1 The Work Schedule Topical Module of the 2008 Panel of the SIPP asked respondents which days they worked “during a typical week last month.” Respondents were then asked, “As part of the work schedule for that week, were there any days when [he/she] worked only at home…?” A copy of the topical module instrument can be found on the SIPP Web site at <www.census.gov/sipp/top_mod/top_mods_chart.html>. For more information on data collection, see the section “Sources of Data” at the end of this report.
2 Many additional tables are available at the Census Bureau’s Commuting (Journey to Work) Web site at <www.census.gov/hhes/commuting/data /workathome.html>.
3 The “long form” portion of the decennial census was discontinued after 2000, replaced with the annual ACS.
Highlights
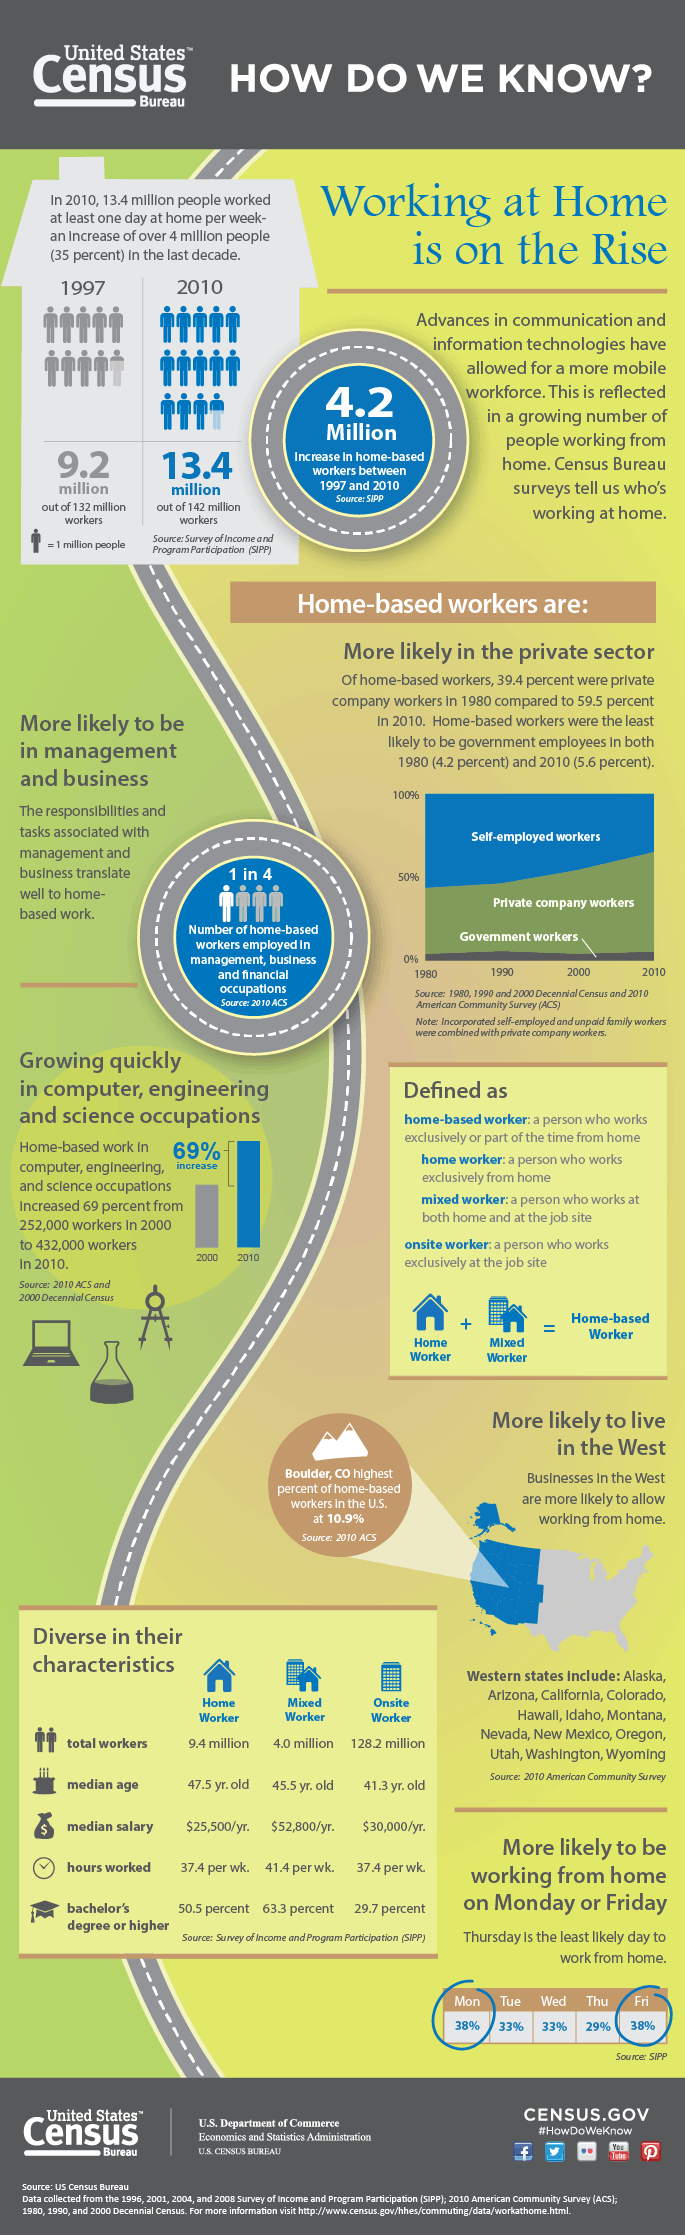
- The percentage of all workers who worked at least 1 day at home increased from 7.0 percent in 1997 to 9.5 percent in 2010, according to SIPP. During this same time period, the population working exclusively from home in SIPP increased from 4.8 percent of all workers to 6.6 percent. The population working both at home and at another location increased from 2.2 percent to 2.8 percent of all workers.4
- The percentage of workers who worked the majority of the workweek at home increased from 3.6 percent to 4.3 percent of the population between 2005 and 2010, according to the ACS.
- About 1 in 10 workers who worked exclusively from home were over the age of 65 in 2010.
- About one-fourth of home-based workers were in management, business, and financial occupations.
- Home-based work in computer, engineering, and science occupations increased by 69 percent between 2000 and 2010.
- Nearly half of home-based workers were self-employed.
- The most popular days worked at home for those who work both at home and onsite were Monday and Friday.
- Those who usually worked both onsite and at home during a typical week worked similar hours per week when compared to those who worked only onsite.
- Many metropolitan areas in the Southeast, Southwest, and West had the largest percentage of workers who worked from home.
- In 2010, the Boulder, Colorado, metropolitan area had among the highest percentage of workers who worked from home most of the workweek with 10.9 percent.
_______________
4 Because of rounding, the sum of the percentage of those that worked exclusively at home and those that worked both at home and at another location in SIPP do not add up to the total percentage of workers who worked at least 1 day at home.
Visualizations


Tables

Others in Series
Publication
Publication
Publication