An official website of the United States government
Here’s how you know
Official websites use .gov
A .gov website belongs to an official government organization in the United States.
Secure .gov websites use HTTPS
A lock (
) or https:// means you’ve safely connected to the .gov website. Share sensitive information only on official, secure websites.
-
//
- Census.gov /
- Library /
- Publications /
- Geo. Distribution & Characteristics of Older Workers in California: 2004
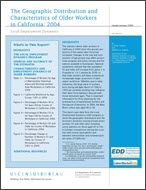
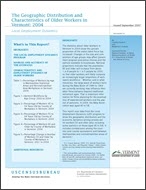
The Geographic Distribution and Characteristics of Older Workers in California: 2004
The Geographic Distribution and Characteristics of Older Workers in California: 2004
Highlights
The statistics about older workers in California in 2004 show this group’s proportion of the state’s labor force has increased. Changes in the size and composition of age groups may affect government program and policy choices and the options available to businesses. National projections indicate that the population 65 and older will increase from about 1 in 8 people to 1 in 5 people by 2030, so that older workers will likely compose an increasingly larger proportion of each state’s workforce.1 Whether, and in what industries, the large wave of workers born during the Baby Boom of 1946 to 1964 are currently working may influence their labor force behavior beyond traditional retirement ages. That is important information for firms planning for the eventual loss of experienced workers and the payout of pensions. In 2004, the Baby Boom cohort was aged 40 to 58.
This report uses data from the Local Employment Dynamics (LED) program to show the geographic distribution and the economic dynamics among private sector workers 55 and older (also including some statistics on those aged 45 to 54). It includes comparisons among the counties (and county equivalents) and between metropolitan and nonmetropolitan areas of California.2
Industries are classified according to the North American Industry Classification System (NAICS). Because the Quarterly Workforce Indicators (QWI) are updated every 3 months, the numbers in this report may differ from the most recent ones on the current LED Web site, <www.census.gov/topics/employment/led.html>.
This report defines “older workers” as those 55 and older. Information is displayed for all workers by age groups to facilitate comparisons among workers and provide information about the potential characteristics of future older workers. The characteristics and geographic distribution throughout California of three groups of older workers are shown: those who may be receiving pension income but who are working (65 and older) and two pre-retirement groups of workers, who may start collecting pensions and social security over the next two decades (workers aged 45 to 54 and aged 55 to 64).
With the LED information, state planners can monitor the impact of changes in the workforce and emerging trends. Detailed statistics about workers by age in counties and metropolitan and nonmetropolitan areas of California are available on the U.S. Census Bureau’s Web site, <www.census.gov>.
__________
1 U.S. Census Bureau, 2004. “U.S. Interim Projections by Age, Sex, Race, and Hispanic Origin,” <www.census.gov/data/datasets/2004/demo/popproj/2004-detailed-data.html>.
2 The metropolitan and nonmetropolitan county classifications are based on Census 2000. For definitions of specific metropolitan statistical areas, see <www.census.gov/programs-surveys/metro-micro.html>.
Share
Some content on this site is available in several different electronic formats. Some of the files may require a plug-in or additional software to view.
 Yes
Yes
 No
NoComments or suggestions?


Top


