Dynamics of Economic Well-Being: Poverty 1996-1999
Dynamics of Economic Well-Being: Poverty 1996-1999
Highlights4
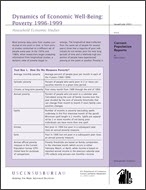
- On average, nearly 40.9 (±0.7) million people were poor in a given month in 1996, representing an average monthly poverty rate of 15.5 (±0.3) percent. By 1999, the number of people who were poor fell to 34.8 (±0.8) million, indicating an average monthly poverty rate of 12.8 (±0.3) percent in that year.
- About 34.2 (±0.4) percent of people were poor for at least 2 months during the panel, but only 2.0 (±0.1) percent were poor every month of the 4-year period between 1996 and 1999.
- Reflecting declines in poverty from 1996 and 1999, more people exited poverty (14.8 (±0.5) million) over that time than entered poverty (7.6 (±0.4) million) as measured by examining people's poverty status in those 2 years using annual income and poverty thresholds.
- Of those who were poor in 1996 (using an annual poverty measure), 65.1 (±1.2) percent remained poor in 1997, 55.5 (±1.3) percent were poor in 1998, and 50.5 (±1.3) percent were poor in 1999. Of those who were not poor in 1996, only 2.9 (±0.2) percent became poor in 1997, 3.3 (±0.2) percent were poor in 1998, and 3.5 (±0.2) percent were poor in 1999.5
- Poverty transitions occur more frequently when using a monthly rather than an annual poverty measure, indicating greater short-term fluctuations in income. Based on a monthly poverty measure (and excluding spells underway in the first interview month of the panel), 51.1 (±0.7) percent of poverty spells were over within 4 months, and about four-fifths were over after a year.
- Non-Hispanic Whites had lower poverty rates (measured using a variety of time frames), shorter median spell lengths, lower poverty entry rates, and higher poverty exit rates than Blacks and Hispanics.6 Patterns for Blacks and Hispanics were generally similar; Blacks showed a higher prevalence of poverty along a couple of measures (median spell length and poverty entry rate), lower according to one (episodic poverty), and were not different from Hispanics among yet others (average monthly poverty, chronic poverty, and poverty exit rate).
- Children tended to have higher poverty rates than adults 18 to 64 and people 65 and over. There were two exceptions: people 65 and over had higher chronic poverty rates (poor for the entire panel) and lower exit rates than the other two age groups, likely indicating less variability in their income over the panel.
- People in married-couple families tended to have lower poverty rates than people in other family types. Conversely, people in families with a female householder were more likely to be poor than others along all measures.
- People in suburbs had lower poverty rates than people in central cities or in nonmetropolitan territory across nearly all measures.
_______________
4 The estimates in this report are based on responses from a sample of the population. As with all surveys, estimates may vary from the actual values because of sampling variation or other factors. All comparisons made in this report have undergone statistical testing and are significant at the 90-percent confidence level unless otherwise noted.The figures in parentheses denote the 90-percent confidence intervals.
5 The percent of people who exited poverty in 1998 was not significantly different from the percent who exited in 1999.
6 Because Hispanics may be of any race, data in this report for Hispanics overlap slightly with data for the Black population. Based on data in the 1996 SIPP panel and using the panel weight, 3.5 percent of the Black population was of Hispanic origin. Data for Asians and Pacific Islanders and American Indians and Alaska Natives are not shown in this report because of their small sample sizes.
Tables
Accuracy Statement
Statistics from surveys are subject to sampling and nonsampling error. All comparisons presented in this report have taken sampling error into account and are significant at the 90-percent confidence level. This means the 90-percent confidence interval for the difference between the estimates being compared does not include zero. Nonsampling errors in surveys may be attributed to a variety of sources, such as how the survey was designed, how respondents interpret questions, how able and willing respondents are to provide correct answers, and how accurately the answers are coded and classified. The Census Bureau employs quality control procedures throughout the production process including the overall design of surveys, the wording of questions, review of the work of interviewers and coders, and statistical review reports to minimize these errors.
The Survey of Income and Program Participation weighting procedure uses ratio estimation, whereby sample estimates are adjusted to independent estimates of the national population by age, race, sex, and Hispanic origin. This weighting partially corrects for bias due to undercoverage, but biases may still be present when people who are missed by the survey differ from those interviewed in ways other than the age, race, sex, and Hispanic origin. How this weighting procedure affects other variables in the survey is not precisely known. All of these considerations affect comparisons across different surveys or data sources.
Others in Series
Publication
Publication
Publication


