Census 2000 Brief: Occupations: 2000
Census 2000 Brief: Occupations: 2000
“What do you do for a living?” is a question frequently asked in contexts ranging from social conversation to scientific research. A person’s occupation has often been a defining characteristic, so much so that many of today’s surnames reflect the occupation of a long ago relative.
Census 2000 counted 281.4 million people in the United States on April 1, 2000, of whom 129.7 million were employed civilians aged 16 and over (Table 1).1 The census classifies occupations at various levels, from the least-detailed summary level — six occupational groups — to the most detailed level — 509 occupation categories. This Census 2000 Sample Brief examines occupations of the employed civilian population 16 years old and older.
Census 2000 occupation classifications were based on the government-wide 2000 Standard Occupation Classification (SOC) system, whereas the 1990 census occupations were based on the 1980 SOC. The SOC was overhauled in 1998 (with additional revisions in 2000) to create a classification system that more accurately reflected the occupational structure in the United States at the time of the revisions. As a result, comparisons of occupation data from the 1990 census and Census 2000 are not recommended and therefore are not attempted in this report.
At the least-detailed summary level, the highest proportion of civilian workers 16 and older, 33.6 percent, were in management, professional, and related occupations, followed by 26.7 percent in sales and office occupations.2 The occupational group made up of farming, fishing, and forestry occupations had the lowest proportion of workers (0.7 percent).3 The proportion of workers in the other summary level occupational groups were: service occupations, 14.9 percent; production, transportation, and material moving occupations, 14.6 percent; and construction, extraction, and maintenance occupations, 9.4 percent.
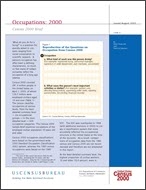
This report is part of a series that presents population and housing data collected by Census 2000, and highlights the occupations of American workers in 2000 for the United States, regions, states, metropolitan areas, and counties. Because of the importance of occupation data in understanding the economy and the changes taking place in society, the Census Bureau has asked questions on occupation in every decennial census since 1850. In Census 2000, two questions on occupation (Figure 1) were asked of everyone 15 or older (with responses tabulated for those 16 and older). The first question (28a) focused on the kind of work done, while the second (28b) asked about the duties of the job. Both questions allowed respondents to write a description of their occupation and its duties. The descriptions provided in these two questions, along with the answers to the questions on type of industry and whether an occupation was with the government, a private for-profit organization, a nonprofit organization, or a family business enabled the Census Bureau to classify the responses into one of 509 occupation categories.
__________
1 The text of this report discusses data for the United States, including the 50 states and the District of Columbia. Data for the Commonwealth of Puerto Rico are shown in Table 6 and Figure 3 only.
2 The estimates in this report are based on responses from a sample of the population. As with all surveys, estimates may vary from the actual values because of sampling variation or other factors. All statements in this report have undergone statistical testing and are significant at the 90-percent confidence level unless otherwise noted.
3 This surprisingly low percentage requires further explanation. Prior to the overhaul of the SOC, farm and ranch owners and renters were classified in the farming, fishing, and forestry occupations group. After the reclassification, they were put into the management, professional, and related occupations group.
Related Information
Others in Series
Publication
Publication
Publication


