
Official websites use .gov
A .gov website belongs to an official government organization in the United States.
Secure .gov websites use HTTPS
A lock (
) or https:// means you’ve safely connected to the .gov website. Share sensitive information only on official, secure websites.

Topics
Data & Maps
Surveys & Programs
Resource Library
Poverty in the United States: 2000
Poverty in the United States: 2000
Report Number P60-214
Introduction

Poverty data offer an important way to evaluate the nation's economic well-being. Because poor people in the United States are too diverse to be characterized along any one dimension, this report illustrates how poverty rates vary by selected characteristics—age, race and Hispanic origin,1 nativity, family composition, work experience, and geography. These data reveal how many people were poor and how the poverty population has changed. A description of how the Census Bureau measures poverty may be found on page 5.
The estimates in this report are based on the March 2001 Current Population Survey, conducted by the Census Bureau. Respondents provide answers to the best of their ability, but as with all surveys, the estimates may differ from the actual values. For further information about the source and accuracy of the estimates, go to www.census.gov/hhes/poverty/poverty00/pov00src.pdf.
Confidence intervals for poverty rate estimates are provided in Table A. The uncertainty in the estimates should be taken into consideration when using them.
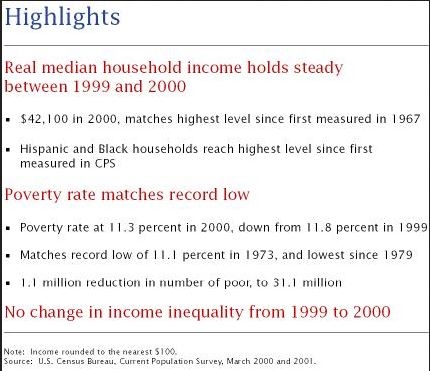
Highlights
- The poverty rate in 2000 dropped to 11.3 percent, down half a percentage point from 1999. This rate was not statistically different from the record low of 11.1 percent set in 1973. About 31.1 million people were poor in 2000, 1.1 million fewer than in 1999.
- The decrease in poverty between 1999 and 2000 was not concentrated in any one region of the United States, although the poverty rate did fall significantly for those living in metropolitan areas but outside of central cities (7.8 percent in 2000, down from 8.3 percent in 1999).
- Several groups set record-low poverty rates in 2000, while others tied their record-lows:
- Blacks (22.1 percent) and female-householder families (24.7 percent) had their lowest measured poverty rates in 2000.
- People 65 years old and over (10.2 percent), Asians and Pacific Islanders (10.8 percent), Hispanics (21.2 percent), White non-Hispanics (7.5 percent), married-couple families (4.7 percent), and people living in the South (12.5 percent) had poverty rates in 2000 that were not statistically different from their measured lows.
- The poverty rate for people under 18 years old dropped to 16.2 percent in 2000 (down from 16.9 percent in 1999)—their lowest poverty rate since 1979.
- The poverty rate declined more for 18- to 24-year-olds than for any other age group.
- Poverty rates fell for Blacks (from 23.6 percent to 22.1 percent) and Hispanics (from 22.8 percent to 21.2 percent) between 1999 and 2000.2
- While Blacks remained disproportionately poor, the difference in poverty rates between Blacks and White non-Hispanics narrowed since the most recent poverty rate peak. In 1993, the Black poverty rate was 23.2 percentage points higher than that for White non-Hispanics; by 2000 this difference had fallen to 14.6 percentage points.
- Compared with the most recent poverty rate peak in 1993, a greater percentage of people in 2000 lived in families with at least one worker, and the poverty rate for people in these families fell since 1993; however, poor family members in 2000 were more likely to be living with at least one worker.
__________
1 Hispanics may be of any race. About 14.2 percent of Whites, 3.0 percent of Blacks, 1.9 percent of Asians and Pacific Islanders, and 11.0 percent of American Indians and Alaska Natives were of Hispanic origin.
2 In both 1999 and 2000, the poverty rates for Blacks and Hispanics were not statistically different from each other.


Historical Tables
Table
Historical Poverty Tables: People and Families - 1959 to 2022
Detailed annual tables on poverty across a number of individual and family characteristics.
Source: Current Population Survey (CPS)
Table
Historical Poverty Tables: Poverty by Definition of Income (R&D)
Detailed annual tables on poverty across a number of individual and family characteristics.
Table
Poverty Thresholds
Poverty Thresholds by Size of Family and Number of Related Children Under 18 Years
Source: Current Population Survey (CPS)
Others in Series
Publication
Child Support for Custodial Mothers and Fathers: 1997
This report presents data on parents with children whose other parent is not living with the family.
Visualization
Money Income in the United States: 2000
These visualizations examine annual changes in income and earnings and compares these changes with historical trends.
Visualization
Health Insurance Coverage: 2000 - Visualizations
These are visualizations on Health and Insurance from 2000.
Related Information
Page Last Revised - October 8, 2021
✕
Is this page helpful?
 Yes
Yes
 No
No
 Yes
Yes
 No
No✕
NO THANKS
255 characters maximum
 255 characters maximum reached
✕
Thank you for your feedback.
Comments or suggestions?

Comments or suggestions?