The Changing Shape of the Nation's Income Distribution: 1947 - 1998
The Changing Shape of the Nation's Income Distribution: 1947 - 1998
Are the rich getting richer and the poor getting poorer?

Historical Census Bureau income statistics can shed some light on this debate. Although the Census Bureau has been measuring income for a half-century, and a large number of factors have been identified as contributing to changes in inequality, the causes are still not entirely understood.
The Current Population Survey (CPS) is a rich source of data on income inequality.
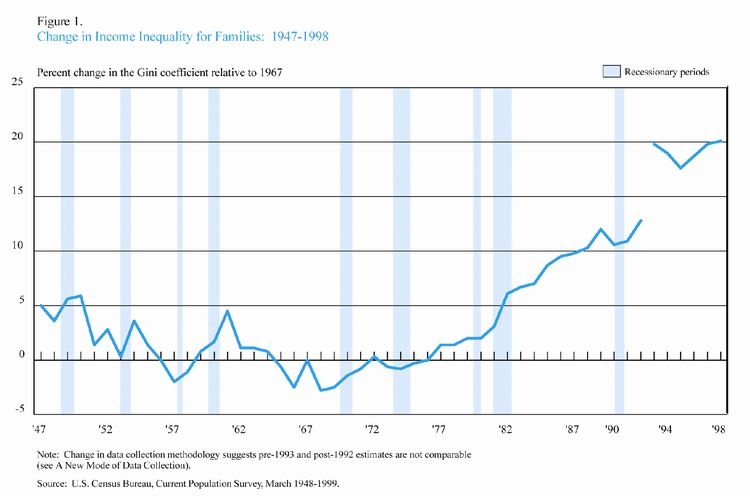
During the past 50 years, the annual demographic supplement to the March CPS has provided researchers with a wealth of data on the income distribution. Since 1947, the Census Bureau has employed a commonly used measure, the Gini coefficient (also known as the index of income concentration),1 to measure family income inequality. With two exceptions, the Gini coefficient decreased between 1947 and 1968. During this period, the Gini for families indicated a decrease in income inequality of 7.5 (±2.1) percent.2 Since 1968, however, this trend has reversed. Income inequality for families, measured by the Gini coefficient, increased between 1968 and 1998 (see Figure 1). The net effect over the entire 1947-1998 period is an increase in family income inequality.3
__________
1 The Gini index ranges from 0.0, when all families (households) have equal shares of income, to 1.0,when one family (household) has all the income and the rest none.
2 Some estimates are followed by a number in parentheses which can be added and subtracted from the estimate to calculate the upper and lower bounds of the 90-percent confidence interval.
3 Part of the increase from 1992 to 1993 is due to changes in survey methodology; see box: A New Mode of Data Collection. See U.S. Census Bureau, Measuring 50 Years of Economic Change, Using the March Current Population Survey, P60-203 for the historical series of family income Gini coefficients.


Historical Tables
-
TableHistorical Income Tables: HouseholdsSource: Current Population Survey (CPS)
-
TableHistorical Income Tables: Income InequalitySource: Current Population Survey (CPS)
-
TableHistorical Income Tables: Experimental MeasuresSource: Current Population Survey (CPS)
-
TableHistorical Income Tables: PeopleSource: Current Population Survey (CPS)
-
TableHistorical Income Tables: FamiliesSource: Current Population Survey (CPS)
Detailed Tables
-
TableCurrent Population Survey Tables for Household IncomeThe Current Population Survey is a joint effort between the Bureau of Labor Statistics and the Census Bureau.
-
TableCurrent Population Survey Tables for Family IncomeThe Current Population Survey is a joint effort between the Bureau of Labor Statistics and the Census Bureau.
-
TableCurrent Population Survey Tables for Personal IncomeThe Current Population Survey is a joint effort between the Bureau of Labor Statistics and the Census Bureau.
Others in Series
Publication
Publication
Publication