A Brief Look at Postwar U.S. Income Inequality
A Brief Look at Postwar U.S. Income Inequality
Are the rich getting richer and the poor getting poorer?
Historical Census Bureau statistics on income can shed some light on that debate. Although the Census Bureau has been measuring incomes for a half-century and a large number of factors have been identified as contributing to changes in inequality, the root causes are still not entirely understood.
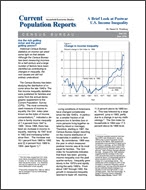
The Census Bureau has been studying the distribution of income since the late 1940’s. The first income inequality statistics were published for families and came from the annual demographic supplement to the Current Population Survey (CPS). The most commonly used measure of income inequality, the Gini index (also known as the index of income concentration),1 indicated a decline in family income inequality of 7.4 percent from 1947 to 1968. Since 1968, there has been an increase in income inequality, reaching its 1947 level in 1982 and increasing further since then. The increase was 16.1 percent from 1968 to 1992 and 22.4 percent from 1968 to 1994 (see figure 1).2
__________
1 The Gini index ranges from 0.0, when every family (household) has the same income, to 1.0, when one family (household) has all the income. It is, therefore, one way to measure how far a given income distribution is from equality.
2 Part of the increase from 1992 to 1994 is due to changes in survey methodology, see footnote 3.
Tables
Related Information
-
TableHistorical Income Tables: HouseholdsSource: Current Population Survey (CPS)
-
TableHistorical Income Tables: Income InequalitySource: Current Population Survey (CPS)
-
TableHistorical Income Tables: Experimental MeasuresSource: Current Population Survey (CPS)
-
TableHistorical Income Tables: PeopleSource: Current Population Survey (CPS)
-
TableHistorical Income Tables: FamiliesSource: Current Population Survey (CPS)
Others in Series
Publication
Publication
Publication


