Dynamics of Economic Well-Being: Income, 1991 to 1992
Dynamics of Economic Well-Being: Income, 1991 to 1992
Income gains were less common from 1990 to 1992 than from 1984 to 1988.
One measure of national well-being is the income ratio — the ratio of a person’s annual family income to their poverty level1.
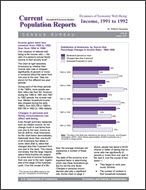
The chart at right (see report) describes Americans by whether their income ratio rose or dropped significantly (5 percent or more) or remained about the same from one year to the next. Data are shown for five different two-year periods.
During each of the three periods in the 1980’s, more people saw their ratios rise than fall. However, during the 1990 to 1991 and 1991 to 1992 periods, the reverse was true. Median household income also dropped during the early 1990’s, from $32,706 in 1989 to $30,786 in 1992 (in 1992 dollars).
_______________
1 The poverty level differs based on the size and composition of one’s family.
Others in Series
Publication
Publication
Publication


