
Census.gov > Library > Infographics & Visualizations > 2013 > U.S. Territory and Statehood Status by Decade, 1790-1960
Library
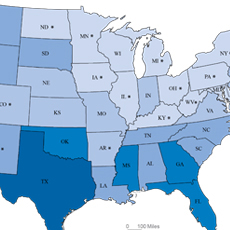
U.S. Territory and Statehood Status by Decade, 1790-1960
February 21, 2013

Historically, acquisition of new territory and conversion of that territory into organized states happened very quickly. Between 1790 and 1920, each decade saw changes in the territorial extent or the make-up of states in the country. This period of change was followed by several decades during which there were no changes until Alaska and Hawaii were admitted as states.
SOURCE: Decennial censuses 1790 to 1960
NOTE: The territorial extents shown reflect the composition of the U.S. at the time of each decennial census and are based on the date by which purchase, treaty ratification, or act of the U.S. Congress occurred. In addition to decennial census publications, the “Map Guide to the U.S. Federal Censuses, 1790-1920” by William Thorndale and William Dollarhide (Genealogical Publishing Com, 1987) was also used for reference. For cases in which the U.S. and another country laid claim to the same territory, the extent was included or excluded from those shown in this map series based on whether the area had been included in the U.S. decennial census for a given decade. Current and historical information about the Outlying Areas and the Island Areas, including Puerto Rico, can be seen at www.census.gov/history/www/programs/geography/island_areas.html.
Recent Data Visualizations
 Population Without Health Insurance
 Population Bracketology
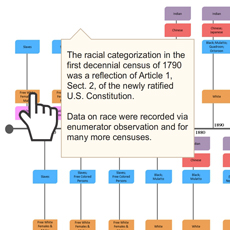 Measuring Race and Ethnicity Across the Decades: 1790-2010
  Where do college graduates work?
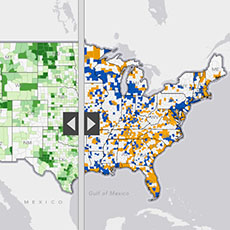 Story Maps Illustrate Population Change
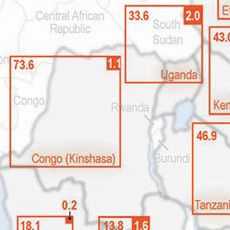 HIV/AIDS Impact in Africa
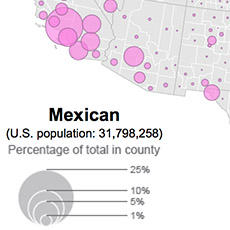 Distribution of Hispanic or Latino Population by Specific Origin: 2010
 A Century of Population Change in the Age and Sex Composition of the Nation
 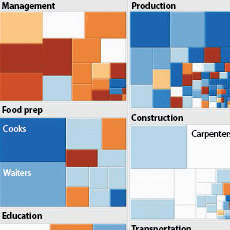 Shifting Occupational Shares
 Metro Area Density
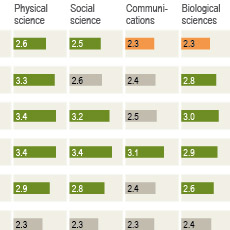 Work-Life Earnings
 Census Flows Mapper
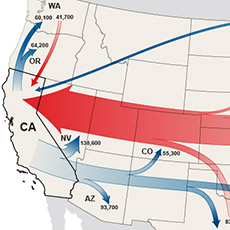 Migration Between Calif. & Other States
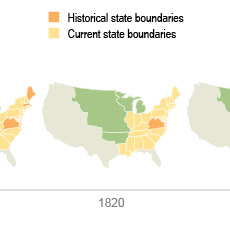 U.S. Territory and Statehood Status
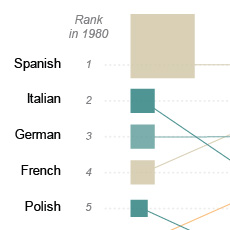 Spoken Languages Other than English
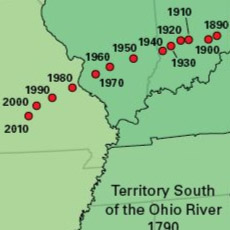 Center of Population, 1790-2010
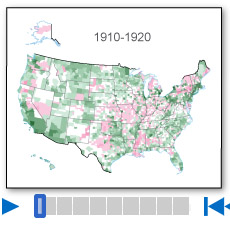 Population Change by Decade
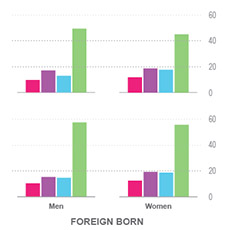 Without A High School Education
 A Decade of State Population Change
 State-to-State Migration for States of 8 Million or More
 Population Under 5 Years Old by Congressional District
 Components of Metro Area Change
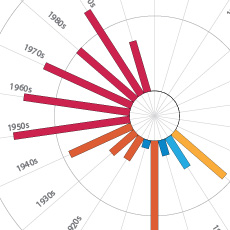 Blooming States
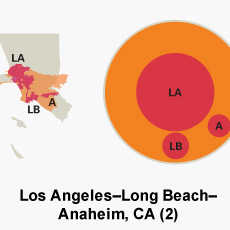 Coastline County Population
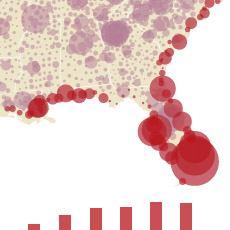 Coastline County Population
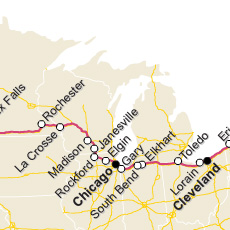 I-90 Population Density Profile, 2010
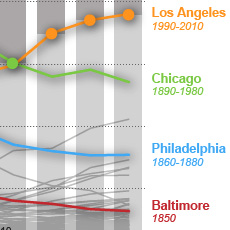 Second Cities: Keeping Pace with a Booming New York
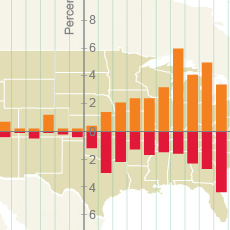 By the Grid: Population Shift to the West and South
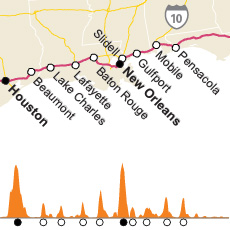 I-10 Population Density Profile, 2010
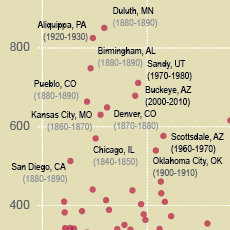 Booming Cities Decade-to-Decade, 1830-2010
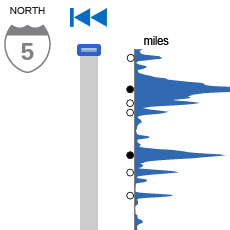 I-5 Population Density Profile, 2010
 Islands of High Income
 The Great Migration, 1910 to 1970
 Following the Frontier Line, 1790 to 1890
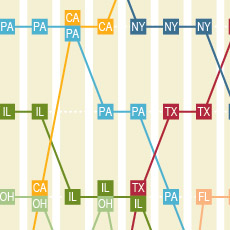 Changing Ranks of States by Congressional Representation
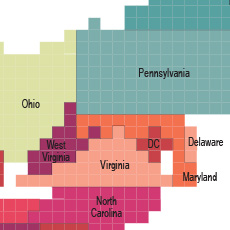 Cartograms of State Populations in 1890, 1950, and 2010
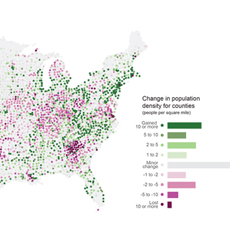 Before and After 1940: Change in Population Density
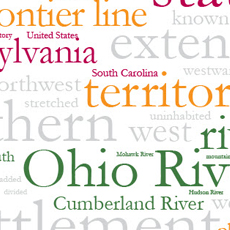 From Physical to Political Geography
 Differential City Growth Patterns
 I-95 Population Density Profile
 Increasing Urbanization
 Gaining and Losing Shares
 Top 20 Cities
Top 20 Cities Yes
Yes
 No
No
Comments or suggestions?