
Census.gov > Library > Infographics & Visualizations > 2012 > Components of Metro Area Change, 2010-2011
Library
Components of Metro Area Change, 2010-2011
December 6, 2012

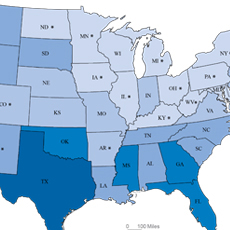
Population change can be attributed to several different processes: natural increase (births minus deaths), net domestic migration, and international migration. Many of the largest metro areas lost population through domestic migration. With the exception of the Detroit metro area, those losses were balanced by gains from natural increase and net international migration.
SOURCE: Population Division, Vintage 2011 Population Estimates
NOTE: Population change is for the period July 1, 2010 to July 1, 2011. Metro areas of 2.5 million people or more in 2011 are included and metro order is based on 2011 population. Shortened titles of areas are shown in the graphic and full titles can be seen in the data table. Metro areas are based on the December 2009 Office of Management and Budget definition. For more information on metro areas, see www.census.gov/population/metro/.
Residual shown in data table is population change that cannot be attributed to any specific demographic component of population change. This component results from one or both of two parts of the estimates process: (1) The application of population controls to estimates for lower levels of geography; and (2) The incorporation of accepted challenges and special censuses into the population estimates.
Recent Data Visualizations
 Population Without Health Insurance
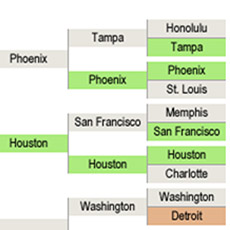 Population Bracketology
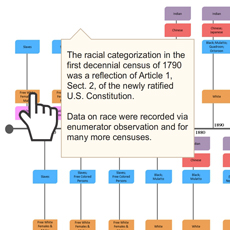 Measuring Race and Ethnicity Across the Decades: 1790-2010
  Where do college graduates work?
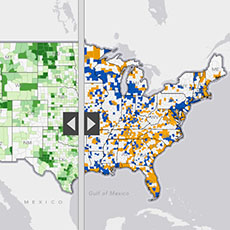 Story Maps Illustrate Population Change
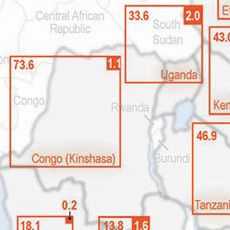 HIV/AIDS Impact in Africa
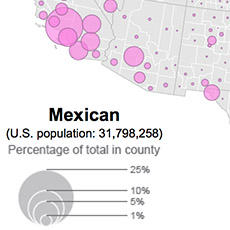 Distribution of Hispanic or Latino Population by Specific Origin: 2010
 A Century of Population Change in the Age and Sex Composition of the Nation
 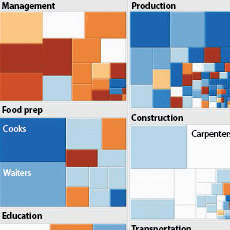 Shifting Occupational Shares
 Metro Area Density
 Work-Life Earnings
 Census Flows Mapper
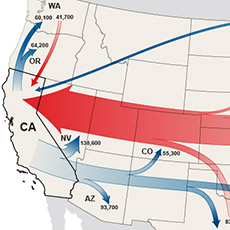 Migration Between Calif. & Other States
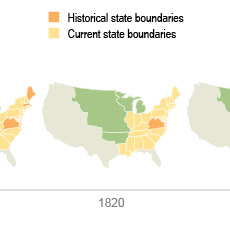 U.S. Territory and Statehood Status
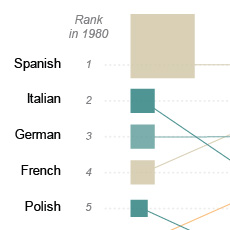 Spoken Languages Other than English
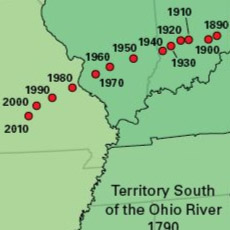 Center of Population, 1790-2010
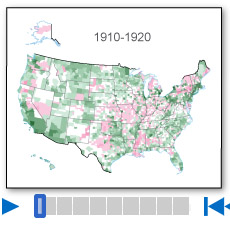 Population Change by Decade
 Without A High School Education
 A Decade of State Population Change
 State-to-State Migration for States of 8 Million or More
 Population Under 5 Years Old by Congressional District
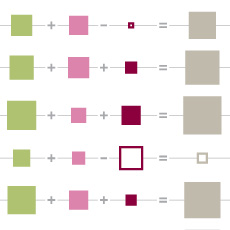 Components of Metro Area Change
 Blooming States
 Coastline County Population
 Coastline County Population
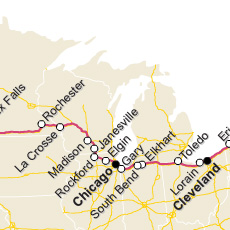 I-90 Population Density Profile, 2010
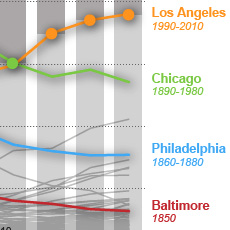 Second Cities: Keeping Pace with a Booming New York
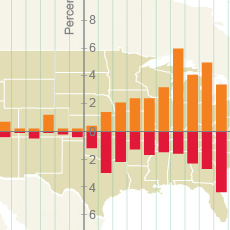 By the Grid: Population Shift to the West and South
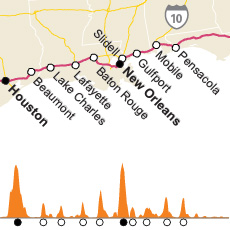 I-10 Population Density Profile, 2010
 Booming Cities Decade-to-Decade, 1830-2010
 I-5 Population Density Profile, 2010
 Islands of High Income
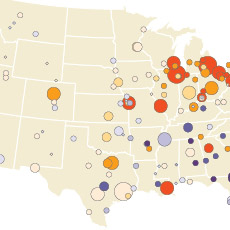 The Great Migration, 1910 to 1970
 Following the Frontier Line, 1790 to 1890
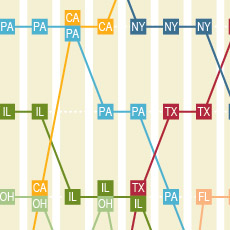 Changing Ranks of States by Congressional Representation
 Cartograms of State Populations in 1890, 1950, and 2010
 Before and After 1940: Change in Population Density
 From Physical to Political Geography
 Differential City Growth Patterns
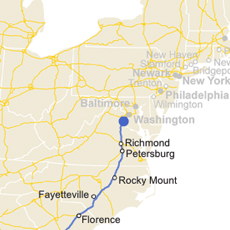 I-95 Population Density Profile
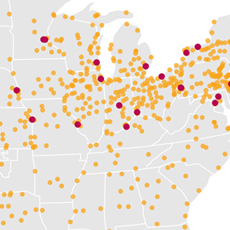 Increasing Urbanization
 Gaining and Losing Shares
 Top 20 Cities

