
Census.gov > Library > Infographics & Visualizations > 2012 > Changing Ranks of States by Congressional Representation
Library
Changing Ranks of States by Congressional Representation
August 30, 2012


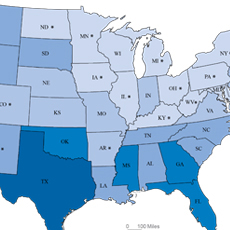
The number of representatives given to each state as a result of apportionment has shifted over time. Shifts in political representation are due to changes in state population relative to other states, the admission of new states to the union, and increases to the total number of memberships in the U.S. House of Representatives instituted by Congress over the decades. The seven states with the largest number of representatives in a given year are included in the graph, beginning with the Continental Congress in 1789 (prior to the first decennial census) and following each decennial census from 1790 through 2010.
SOURCE: Census 2000 published volumes and the 2010 Census
NOTE: Non-voting representatives were not included in calculations to determine rank.
Recent Data Visualizations
 Population Without Health Insurance
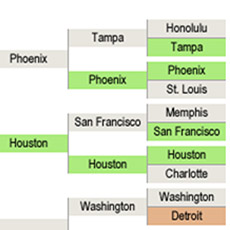 Population Bracketology
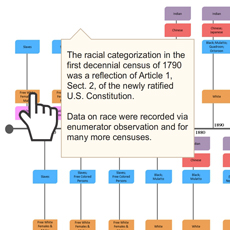 Measuring Race and Ethnicity Across the Decades: 1790-2010
 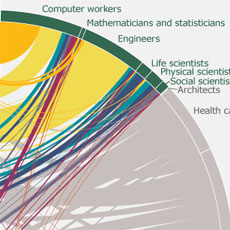 Where do college graduates work?
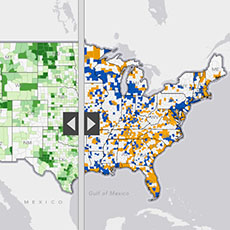 Story Maps Illustrate Population Change
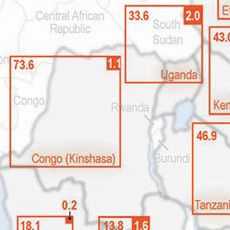 HIV/AIDS Impact in Africa
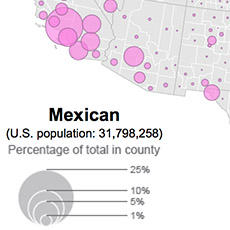 Distribution of Hispanic or Latino Population by Specific Origin: 2010
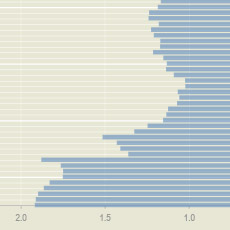 A Century of Population Change in the Age and Sex Composition of the Nation
 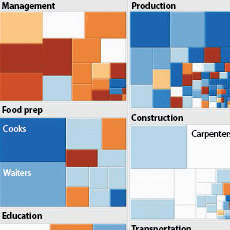 Shifting Occupational Shares
 Metro Area Density
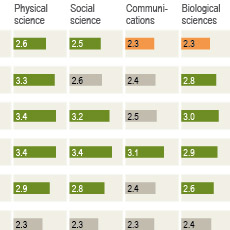 Work-Life Earnings
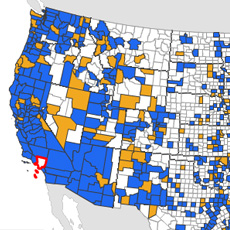 Census Flows Mapper
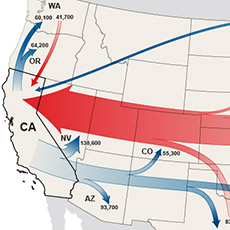 Migration Between Calif. & Other States
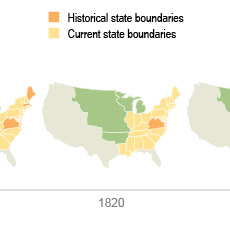 U.S. Territory and Statehood Status
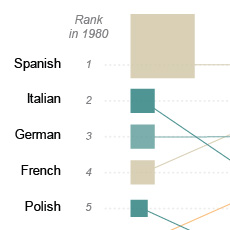 Spoken Languages Other than English
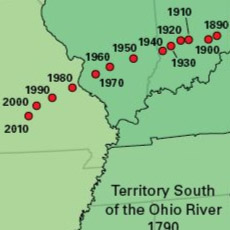 Center of Population, 1790-2010
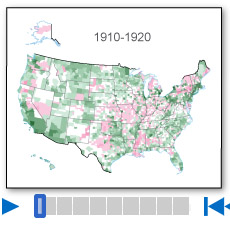 Population Change by Decade
 Without A High School Education
 A Decade of State Population Change
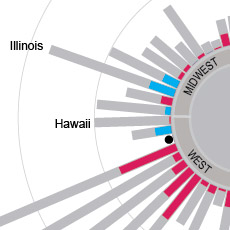 State-to-State Migration for States of 8 Million or More
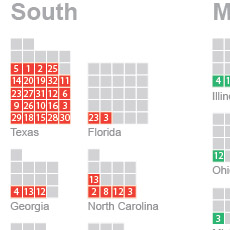 Population Under 5 Years Old by Congressional District
 Components of Metro Area Change
 Blooming States
 Coastline County Population
 Coastline County Population
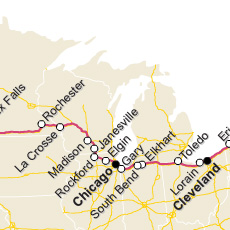 I-90 Population Density Profile, 2010
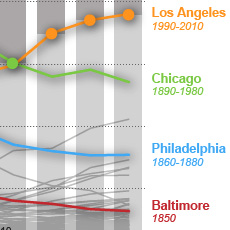 Second Cities: Keeping Pace with a Booming New York
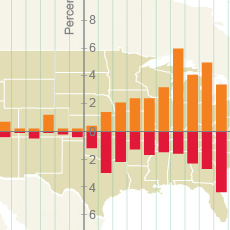 By the Grid: Population Shift to the West and South
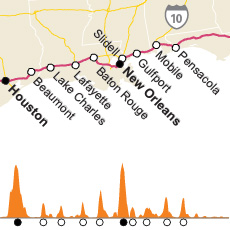 I-10 Population Density Profile, 2010
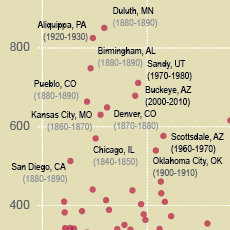 Booming Cities Decade-to-Decade, 1830-2010
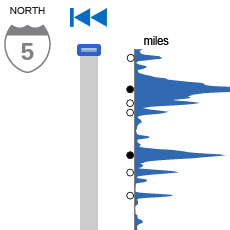 I-5 Population Density Profile, 2010
 Islands of High Income
 The Great Migration, 1910 to 1970
 Following the Frontier Line, 1790 to 1890
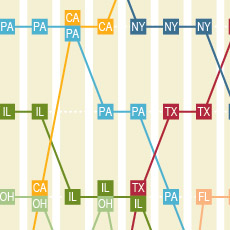 Changing Ranks of States by Congressional Representation
 Cartograms of State Populations in 1890, 1950, and 2010
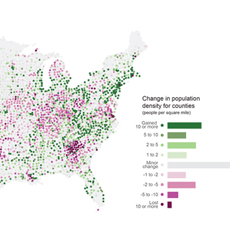 Before and After 1940: Change in Population Density
 From Physical to Political Geography
 Differential City Growth Patterns
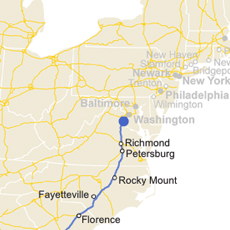 I-95 Population Density Profile
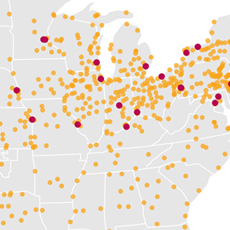 Increasing Urbanization
 Gaining and Losing Shares
 Top 20 Cities

