2024
2024
On December 17, we released the following updates to the site:
- Refreshed Microdata Access Tool (MDAT). The primary purpose of this refresh was to update the look and feel of MDAT to appear more consistent with the rest of the site. The refreshed MDAT is accessible through an updated link: data.census.gov/app/mdat

*The refreshed MDAT has similar functionality to the previous version with a few noteworthy updates, described below. To learn more, check out our video tutorial and webinar on Exploring the Refreshed Microdata Access Tutorial.
o URL Migration: At the bottom of the landing page, enter URLs you saved from the previous version of MDAT and click “Go” to load the table on the refreshed MDAT site.

o Select Geographies: The Select Geographies is now a button within the variables tab. When you click the button, a pop-up window will appear that allows you to select your geographies. With the refreshed MDAT, we also added a new option to “Select All” geographies in a list in a single click.

o Cart: Changes to button icons, names, and locations.

o Table: A collapsible panel and buttons at the bottom of the table provide options to edit the table layout and download data.

- New ability to create customizable charts. This update provides you the flexibility to create charts from the tables on data.census.gov. Access the charts by clicking the:
o “Charts” tab located throughout the site

o “Chart” button in the table and map toolbars

- Chart measures/attributes drop-down menu:
o Measures: Select the primary value shown on your chart (e.g. “percent under 5 years” or “annual payroll”)

*Charts from some complex data tables also have dimensions and units options to help you precisely select the measure for your chart
o Attributes: Specify the categories your chart includes (e.g. geographies, NAICS codes, etc)

- Chart Type: Visualize data using
o Bar and column charts: Visualize the selected measure in horizontal or vertical bars. Includes option to sort the data in ascending, descending, or alphanumeric order.

o Line charts: Visualize the selected measure over time.

*Note: Line charts are currently supported for American Community Survey (ACS) Comparison Profiles and timeseries datasets, such as the International Trade Import and Export datasets.
- Line charts including the following features:
o Statistical significance shown in line charts from ACS Comparison Profiles.
▪ Diamonds show the reference year for calculations of statistical comparisons.
▪ Closed circles show values that are statistically different.
▪ Open circles show values that are not statistically different.

o Color-coded legends for line charts with seven or fewer categories.

o Area chart with a slider for line charts from timeseries datasets. The area chart shows the full length of time covered, and the slider allows you to adjust the length of time shown in your line chart.

o U.S. recession periods shown with gray shading in line charts from economic datasets that provide data exclusively for U.S. geographies.

*The dates used for recession periods are based on the business cycle turning points by the National Bureau of Economic Research (NBER).
- Attributes button that allows you to add or remove categories that may be shown on your chart.
o Global attributes: Allow you to add or remove filters that may populate your chart, such as filters for geographies, NAICS codes, population group codes, and EEO occupation codes. Any global attribute selections work the same as if you had made the selections using the filter panel located throughout the site.
o Local attributes: Allows you to add or remove values that may populate your chart. These local attributes are specific to the table that was used to build your chart and do not carry over when switching to charts from different data tables.

o When you select global or local attribute check boxes:
▪ Attributes are shown as categories within your chart if you also include the attribute as a primary or secondary attribute to display in the measures drop-down menu

▪ Attributes are shown as options to limit the context that your chart represents if you do not have the attribute included as a primary/secondary attribute to display. In these instances, use the “other attributes to display” drop-down menus to switch between the different options to specify your desired context.

- Margin of Error button that allows you to show or hide margins of error for ACS charts.

- Notes button allows you to view the notes from the data table used to build the chart.

- Source information included at the bottom of each chart.

- Table and map buttons allow you to navigate across the site and view a table with the data powering your chart.

- Animation effects show charts loading from left to right or bottom to top.
- Chart selections captured in the URL. This allows you to copy the URL in the address bar and revisit it later in order to return to the chart view.

- Technical work to help support chart metrics and search engine optimization
- Technical update to help tables automatically display in more instances without providing the “table too large to display” message. Specifically, the site will now use the compressed download estimate to determine whether the message will appear.
- Fixes to 23 defects, including fixes that allow you to:
- View maps that are more responsive to previous selections you have made.
- Select the filter for all economic places fully/partially within a metropolitan/micropolitan statistical area.
On December 5, we released the following update to the site:
- With this release, Geography Profiles now provide some decennial census data for the latest congressional districts boundaries (119th Congress). Additional data will be added for these geographies in future releases by other surveys and programs.

On November 21, we released the following updates to the site:
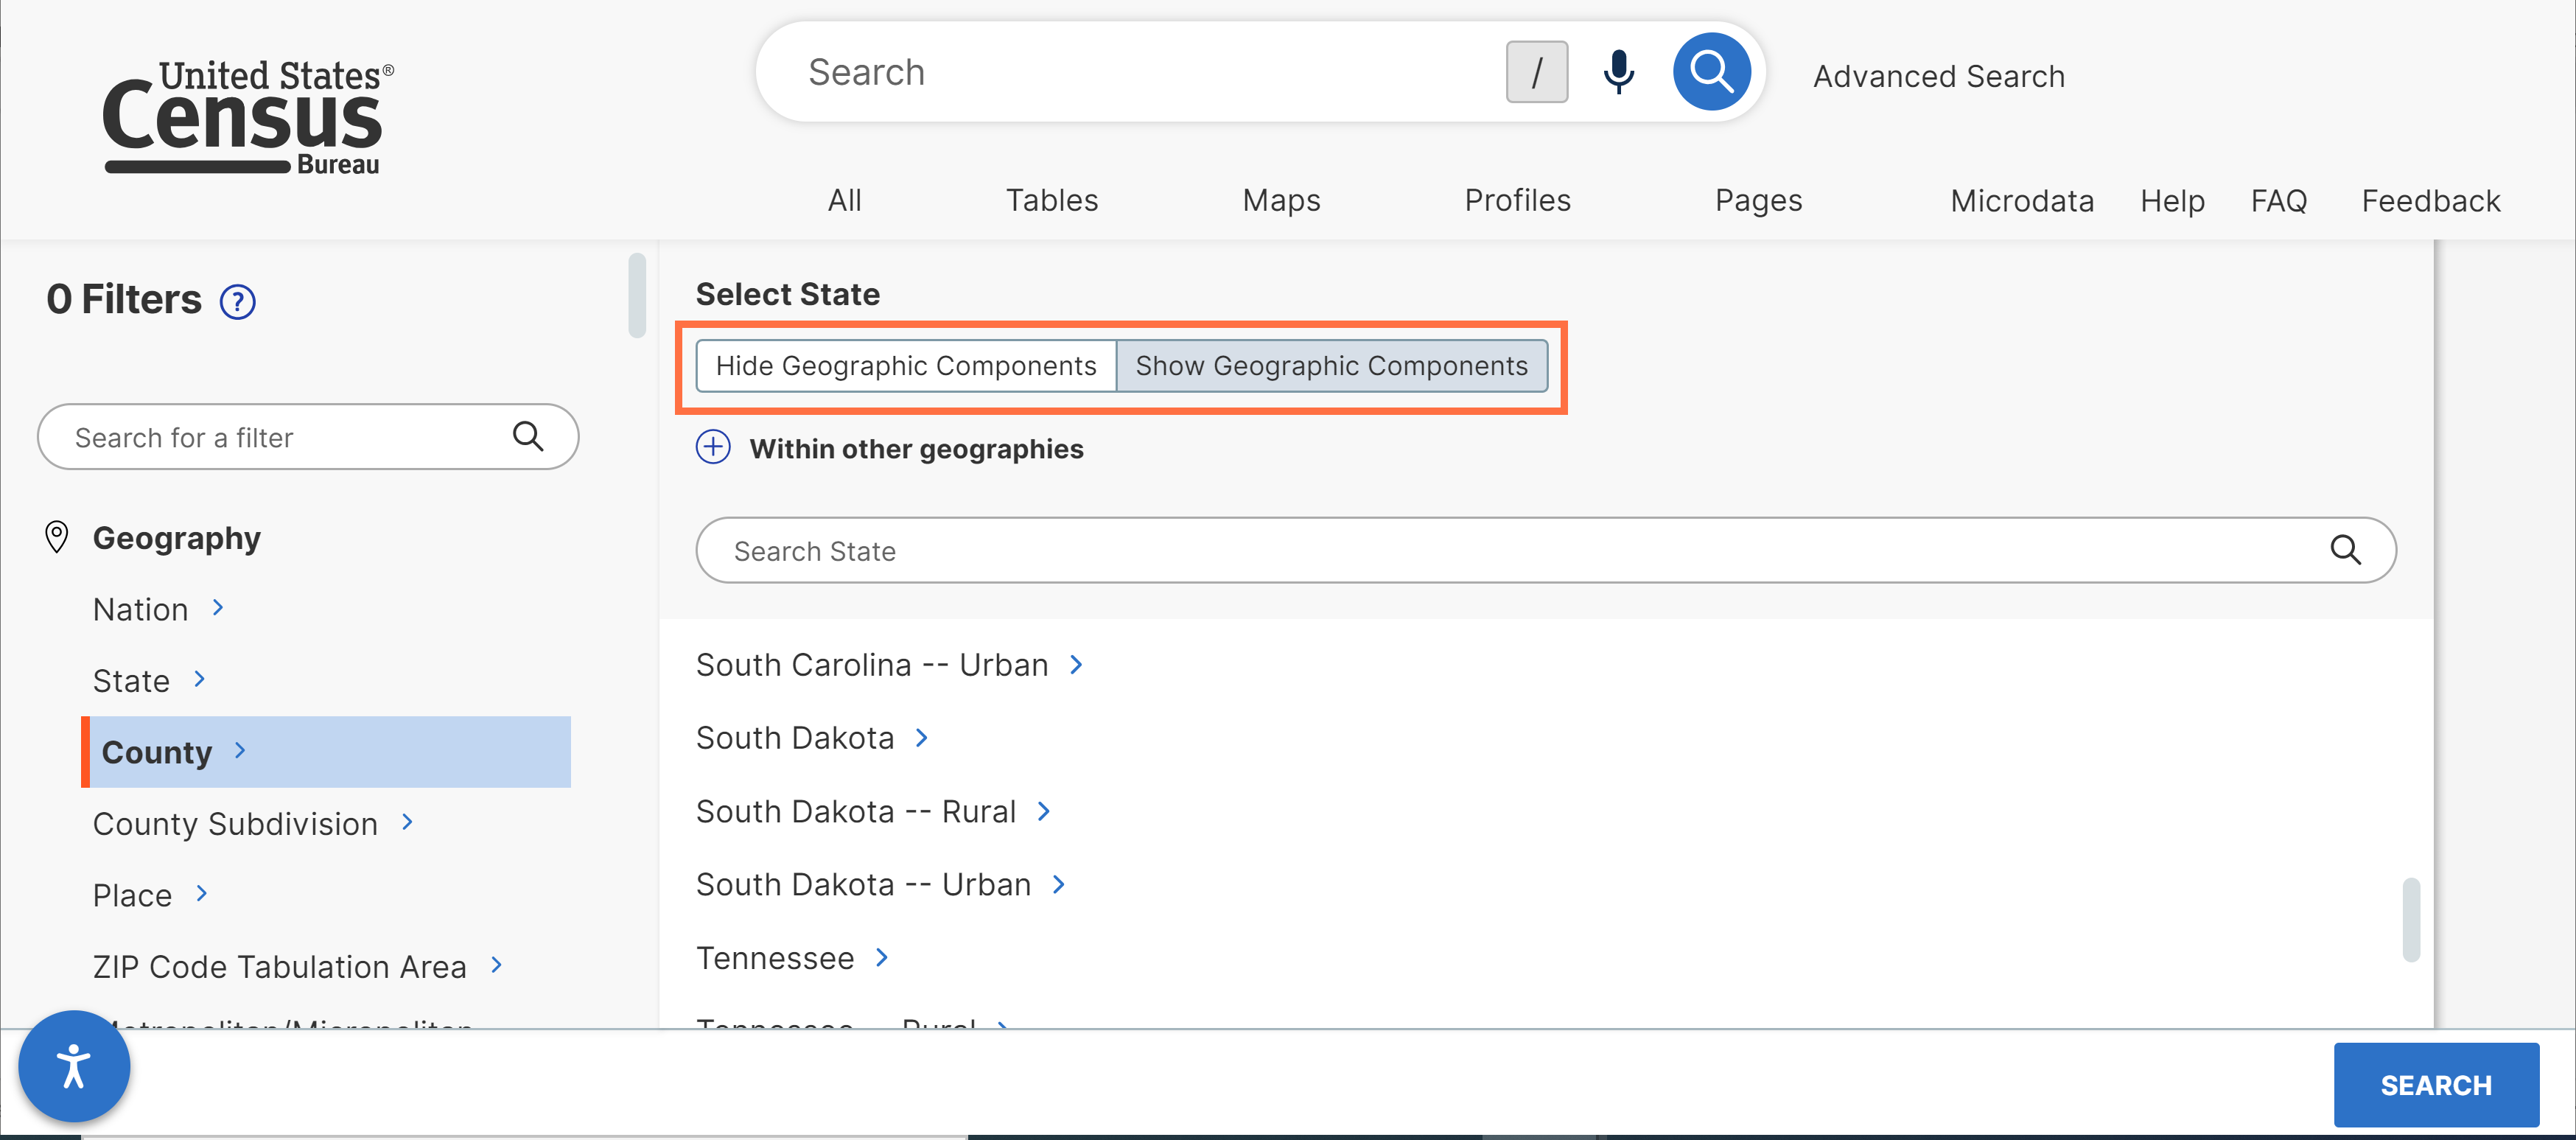
- Improved filter panel placement for options to select collections of geographies related to geographic components, such as “All Statewides within United States, Puerto Rico, and the Island Areas.” We now display these filters within the “Show Geographic Components” tab.

- Continued technical work to improve the Microdata Access Tool (MDAT) in future releases.
- Fixes to 3 defects, including a fix that allows you to:
- View improved messaging after attempting to activate an API key that was previously activated and is ready-to-use.
On October 10, we released the following updates to the site:
- Continued technical work to improve the Microdata Access Tool (MDAT) in future releases.
- Fixes to 7 defects, including a fix that allow you to:
- View all column headers in the Excel output for your table downloads. This includes the ability to view all headers for complex tables you download that have pivot views automatically applied in the display on data.census.gov.
On September 26, we released the following updates to the site:
- Improved display of American Community Survey (ACS) tables to automatically show data for more geographies by default. In most instances, the site will automatically show you data from the ACS 5-year estimates if you have made a filter selection to choose a collection of geographies, such as “All Counties in Indiana.”

This updates benefits users by providing data for all geographies in the collection through the ACS 5-year estimates instead of only showing data for geographies with 65,000 people or more through the ACS 1-year estimates.
Please be aware that this update applies to all collections of geographies for: counties, county subdivisions, places, metropolitan/micropolitan statistical areas, American Indian Areas/Alaska Native Areas/Hawaiian Home Lands, combined statistical areas, New England city and town areas (NECTAs), school districts, and urban areas.
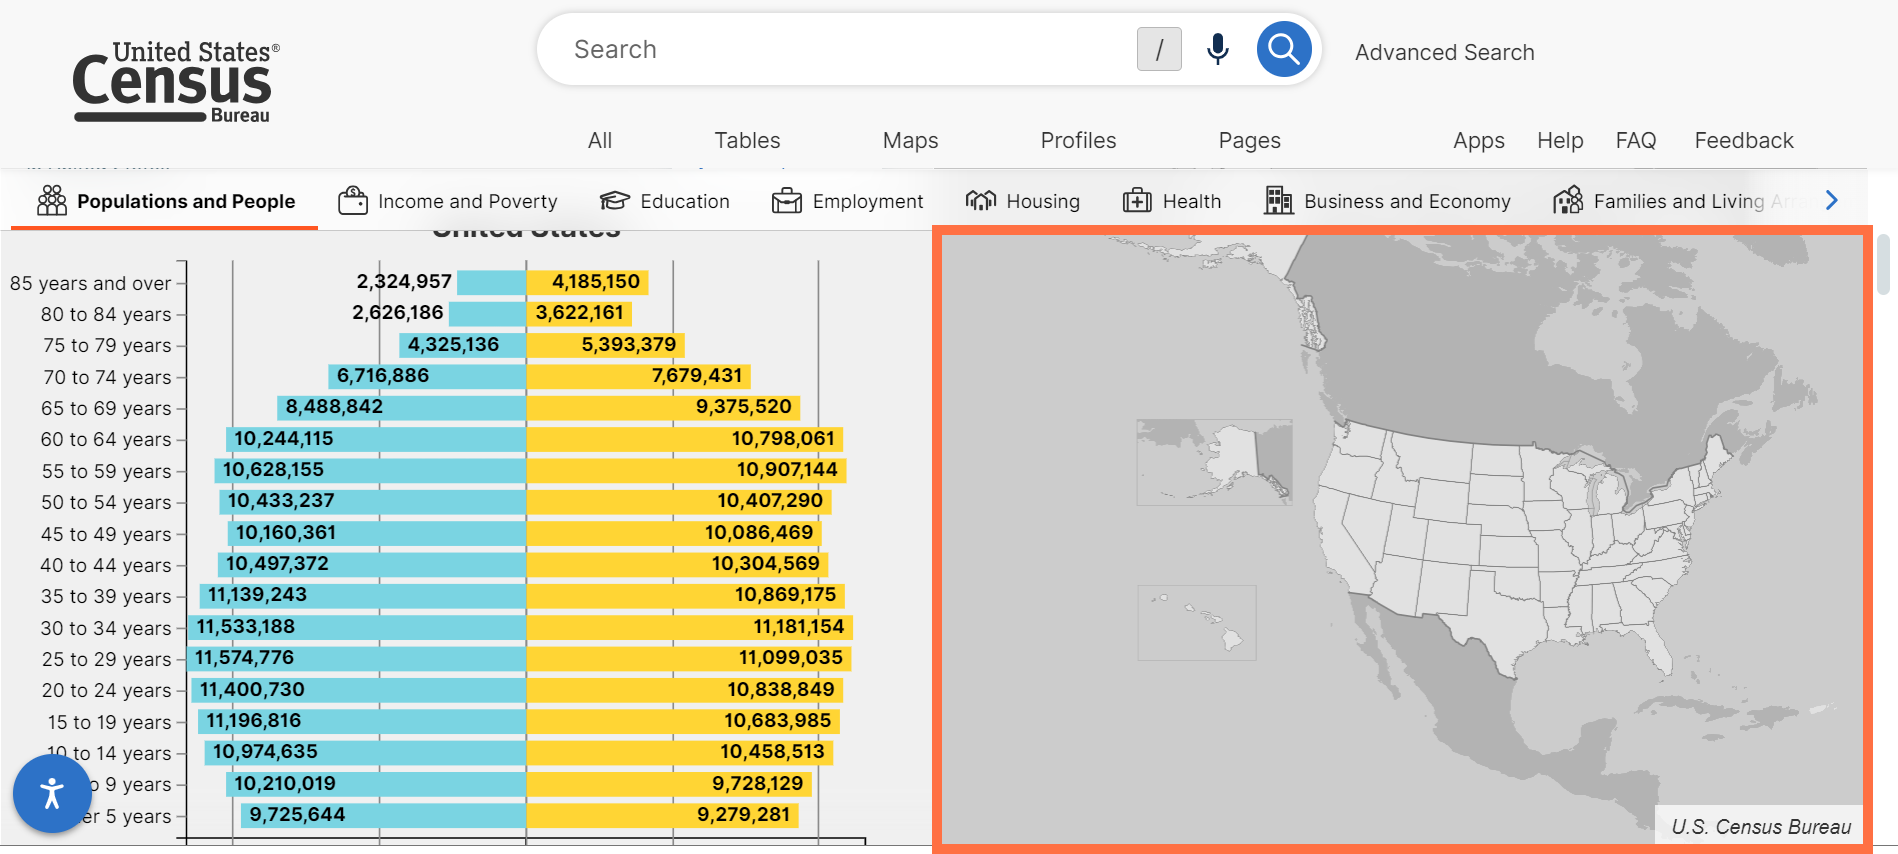
- Improved industry and occupation sections of Geography Profiles. We updated these sections to show results that are most relevant to the selected geography. These Profiles display the top 10 industries for the geography in the bar chart, and displays both bar charts in descending order, allowing you to see the most popular industries and occupations at the top of the chart.

- Other Geography Profile enhancements, including improvements to:
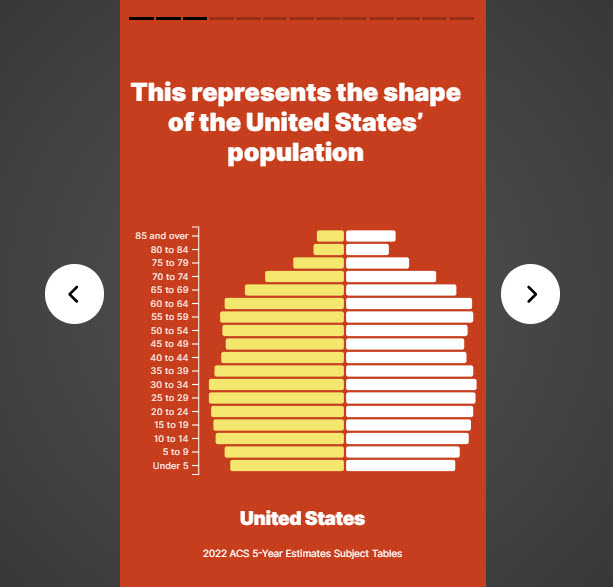
o Add spacing to ensure population pyramids will not overlap age labels.

o New icon that allows you to explore the meaning of special characters.

o Removal of bar charts when all values in the chart are zero.
- Continued technical work to improve the Microdata Access Tool (MDAT) in future releases.
- Fixes to 6 defects, including fixes that allow you to:
- View data from the American Community Survey 5-year estimates when selecting collections of geographies for counties.
On September 4, we released the following updates to the site:
- New ability to download table views in the profile and map views. These downloads include margins of error and any column sorting made to the display prior to downloading the table.
a) To access the download in the profile view: Click “Show Table” and then “Download Table.”

b) To access the download in the map view: Click the “Table” button at the top of the map and then scroll down to see the “Download Table” button.

- Improvements to view full table cell content on mobile devices. With this update, you can tap table cells with truncated text to see the full text in a pop-up box.

- Updates to add the capability for citations to include survey sponsors in the author field.

- Behind-the-scenes updates to the tables in the profile and map views.
- Fixes to 1 defect that allows you to see the survey sponsor in the citation for Vehicle Inventory Use Survey (VIUS) table VIUS211A
On August 15, we released the following updates to the site:
- Improved layout of notes for 2022 Economic Census data tables. When you click the Notes button for 2022 Economic Census data tables, the notes are now organized into sections for improved standardization and readability. You will also see these improved notes when downloading the table.

- Improvements to make sure icons throughout the site are consistently sized and appear clear on mobile devices.

- Continued technical work to improve the Microdata Access Tool (MDAT) in future releases.
- Fixes to 4 defects, including a fix that allow you to view geography labels for statistics on the “All Results” page.
On July 23 and Aug 2, we released the following updates to the site:
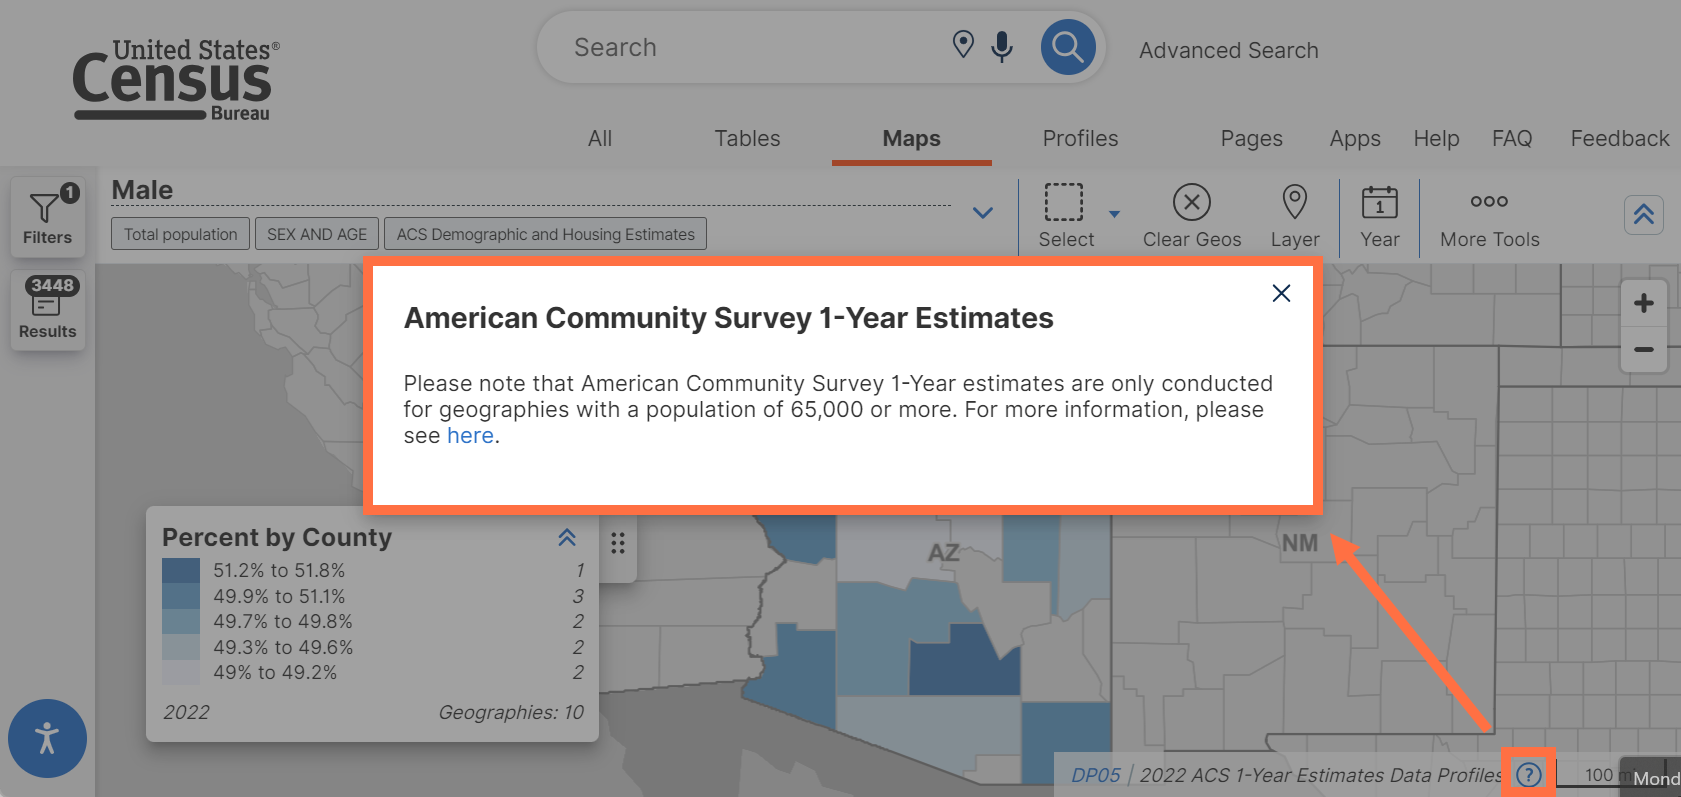
- New messaging to explain minimum population requirements for American Community Survey (ACS) data in table and map views.
o View the top of the ACS table for new text that explains ACS 1-Year Estimates are only available for geographies with 65,000 people or more.

o Click the question mark icon for ACS 1-Year Estimates at the bottom of the map to see a pop-up window that explains minimum population requirements.
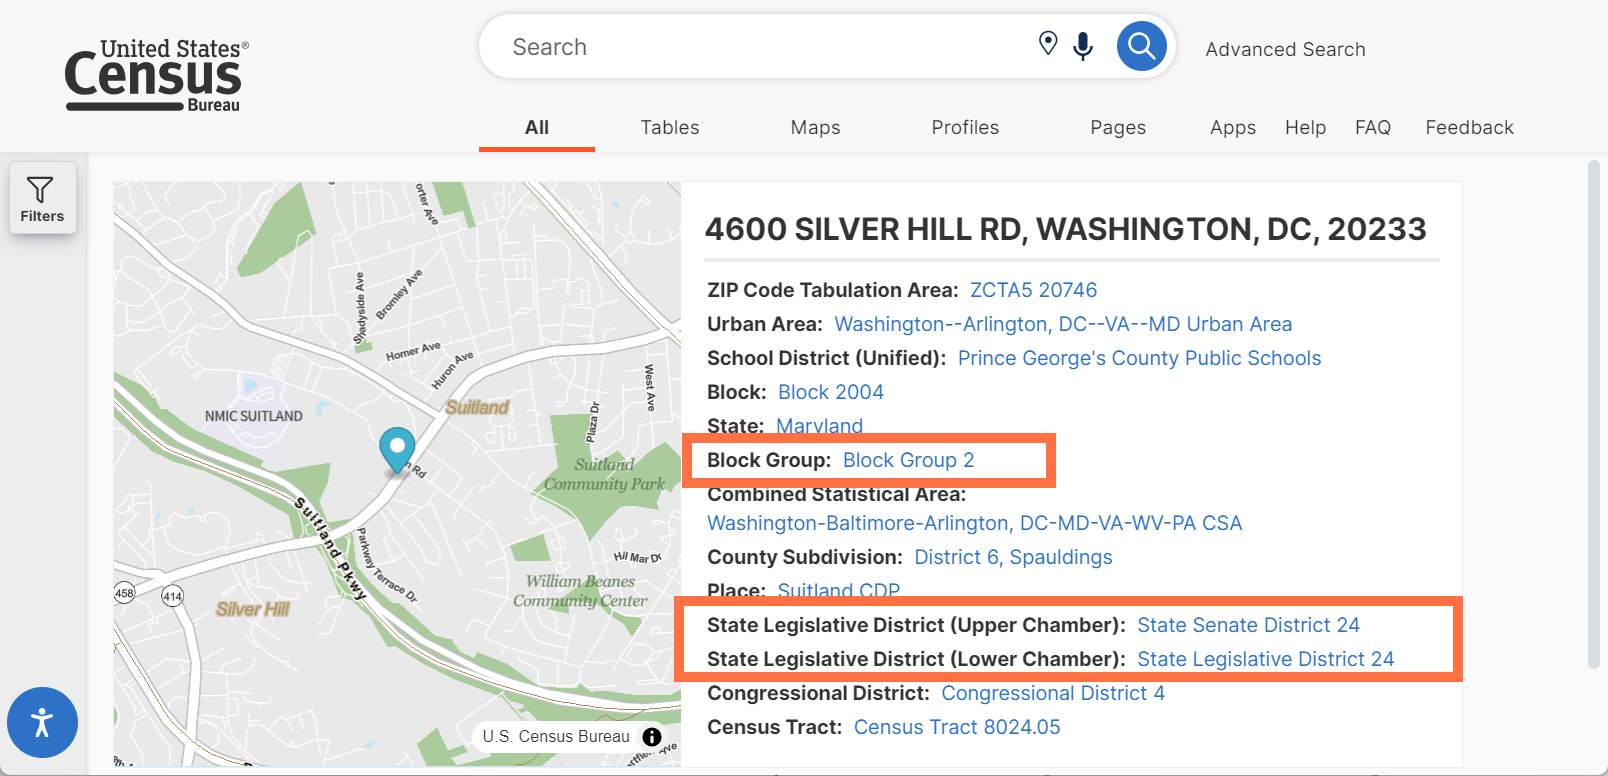
- New geographies supported by the address search functionality. We added the block group and state legislative districts that an address falls within.
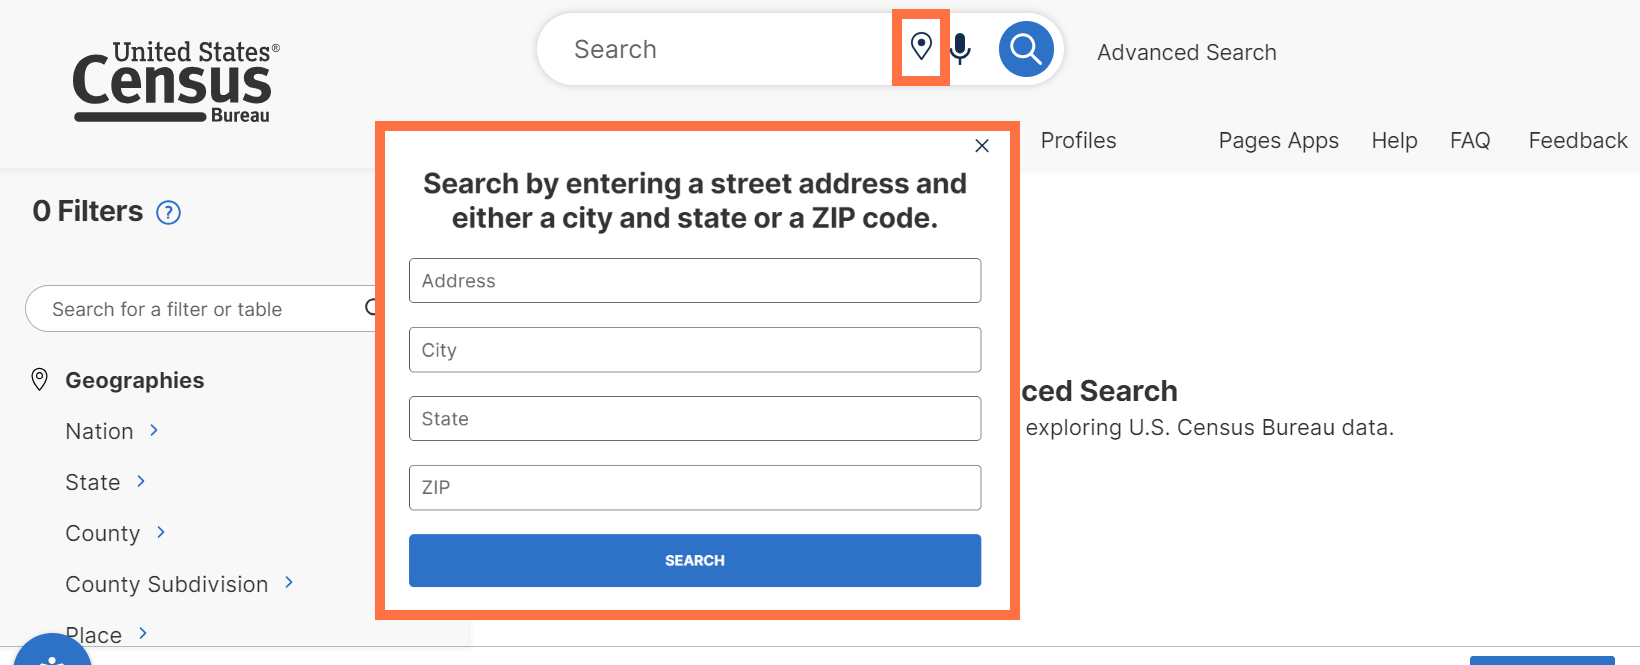
- Ability to search by address throughout all views of the single search bar. With this update, we expanded the presence of the geography pin icon so that it appears on all views of the single search bar on data.census.gov. Previously, this icon to launch the address search was only accessible from the landing page.
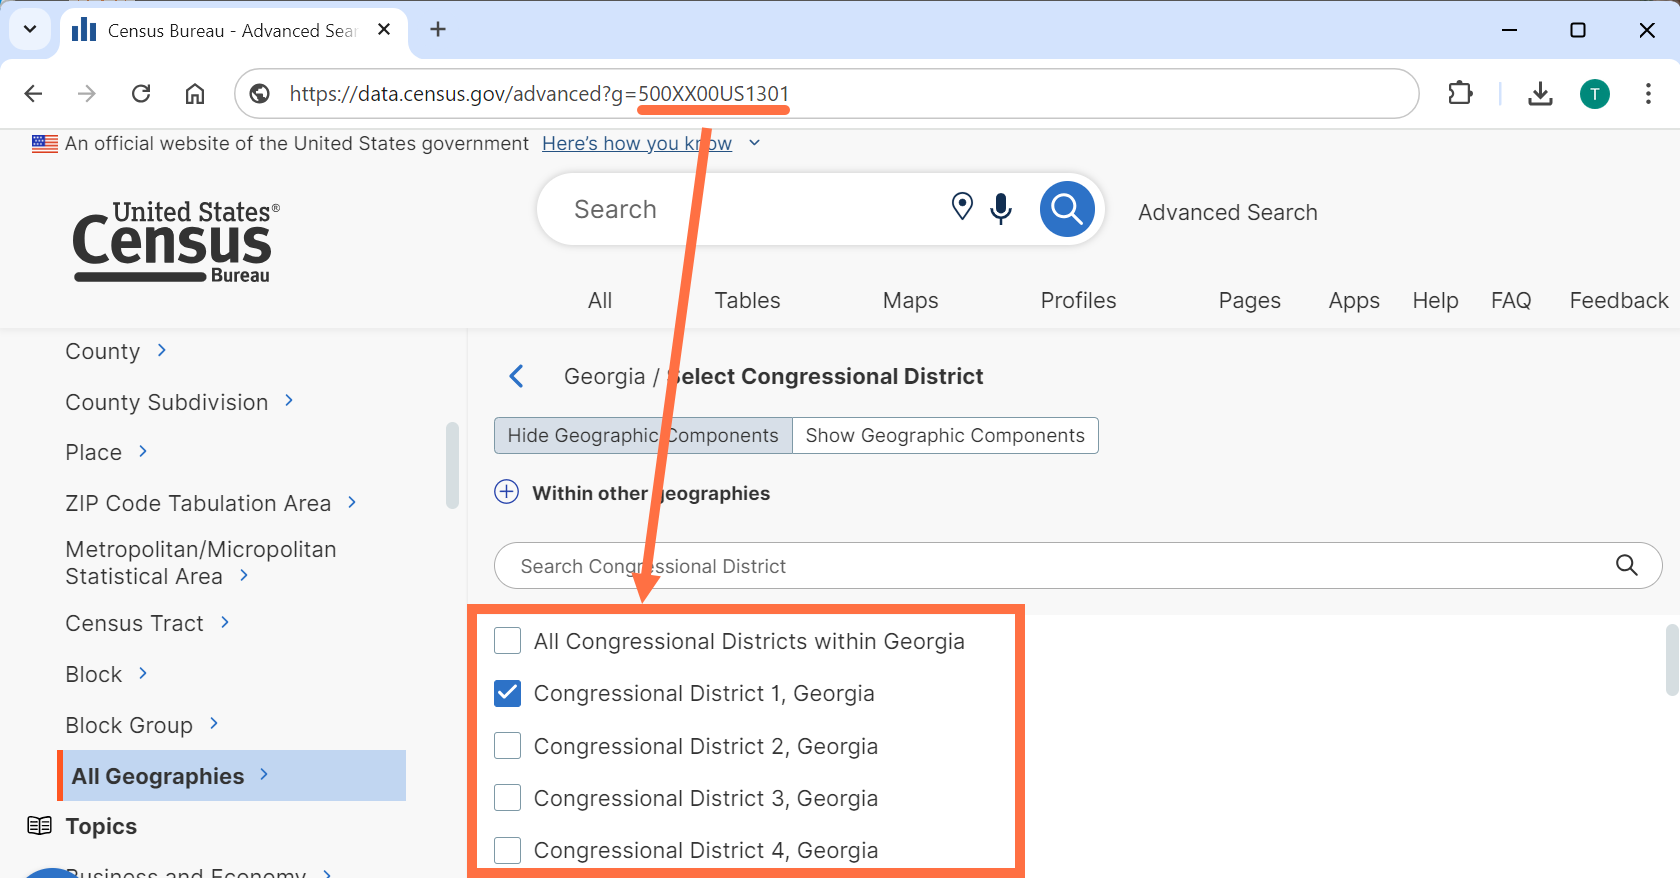
- Improved display of geography filters. With this update, geography filters are ordered by the Geography ID rather than alphanumeric sorting of the geography name. This provides more intuitive sorting of geography filters, particularly for geographies that contain numbers as part of the name, such as congressional districts, state legislative districts, and census tracts.
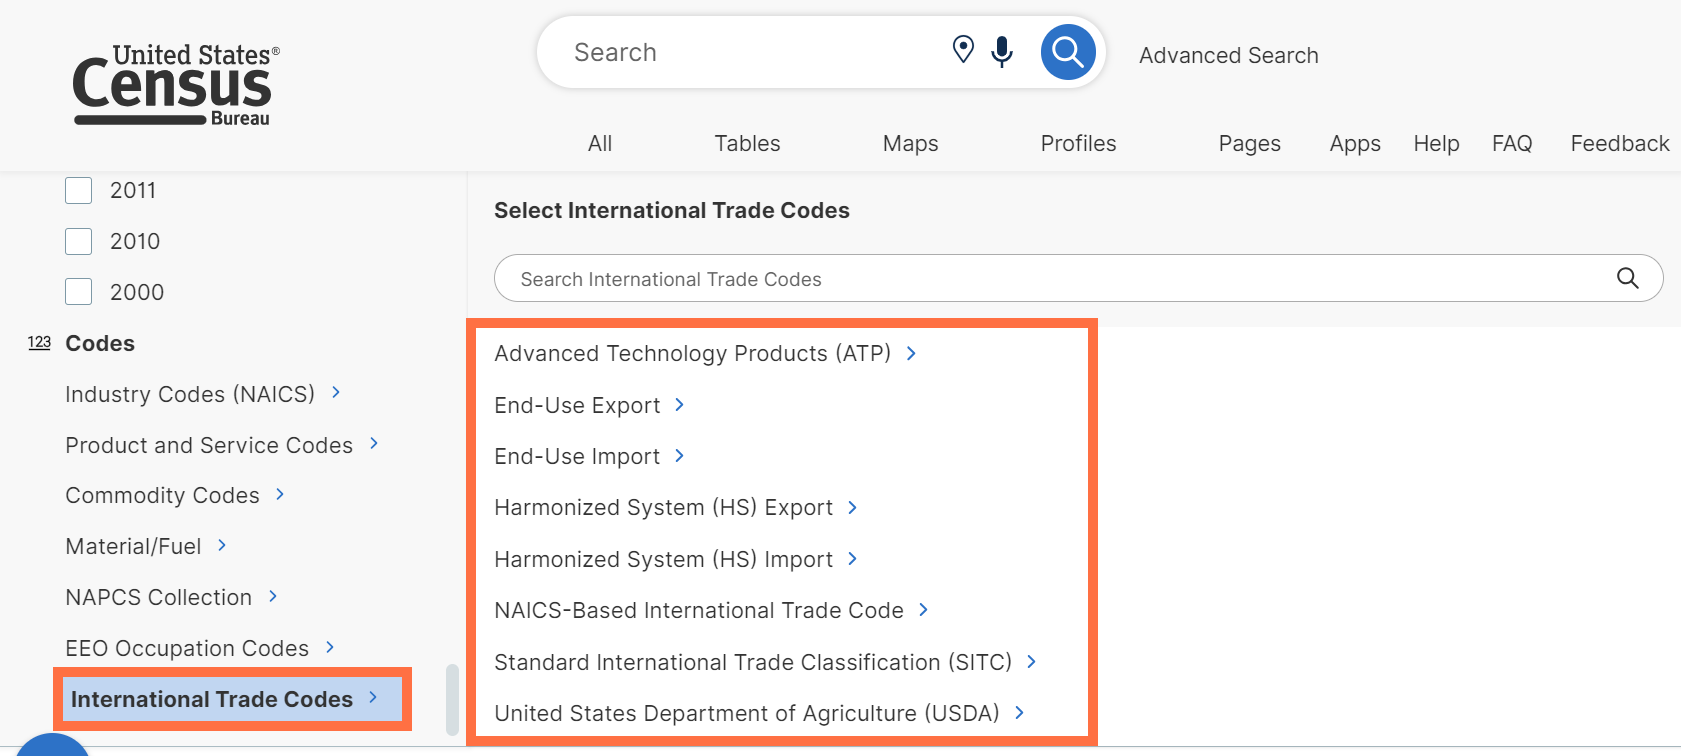
- Improved organization of international trade filters in the panel. The following types of codes have been organized under a new category titled “International Trade Codes” in the filter panel: Advanced Technology Products (ATP), End-Use Export, End-Use Import, Harmonized System (HS) Export, Harmonized System (HS) Import, NAICS-Based International Trade Code, Standard International Classification (SITC), and United States Department of Agriculture (USDA).
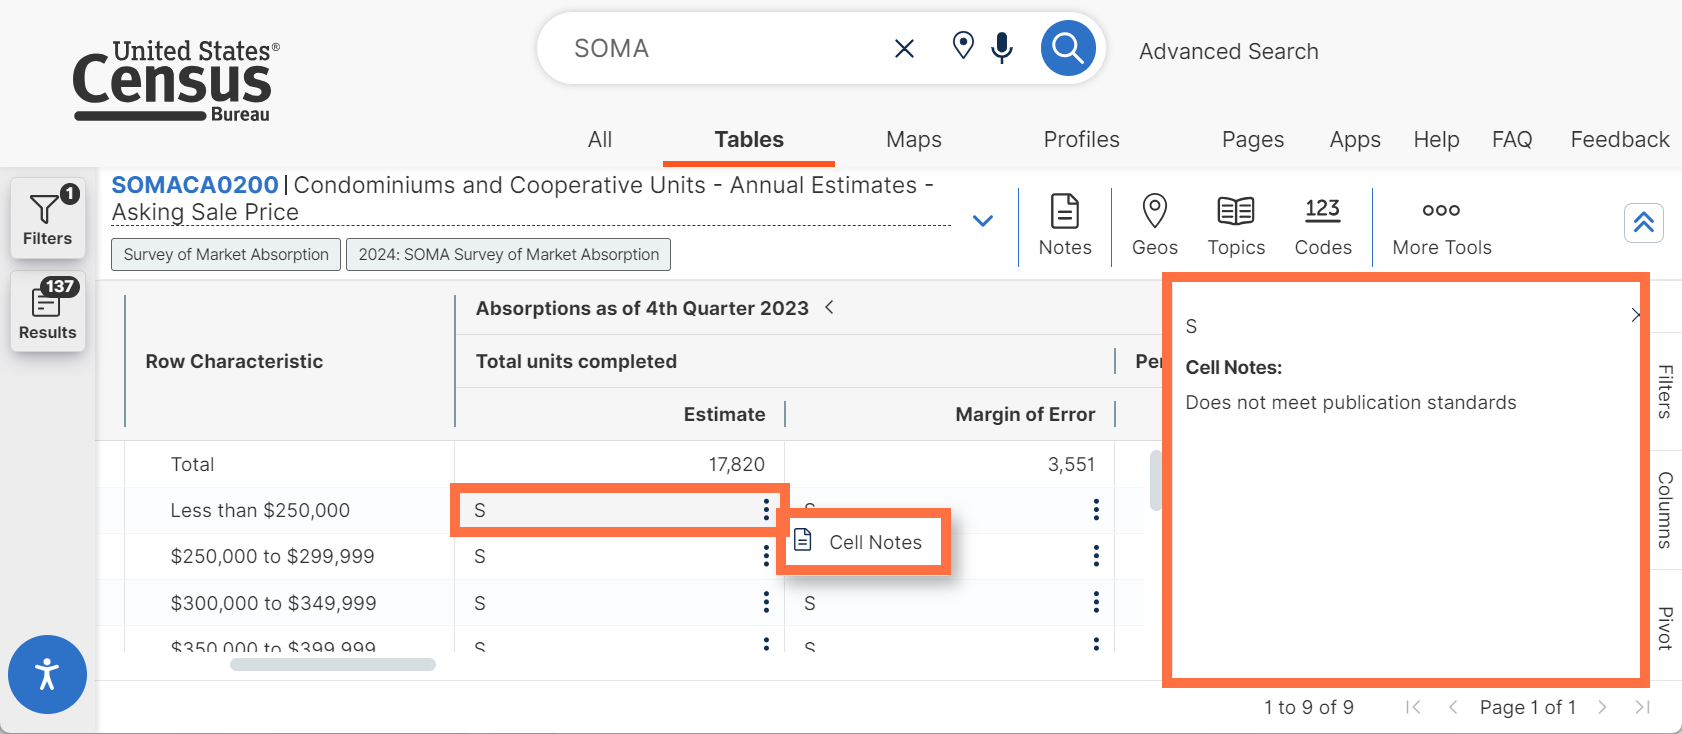
- Ability to access column and cells notes for tables that have recommended views called “pivots.” Previously, these notes were not accessible in the default table view for these types of tables.
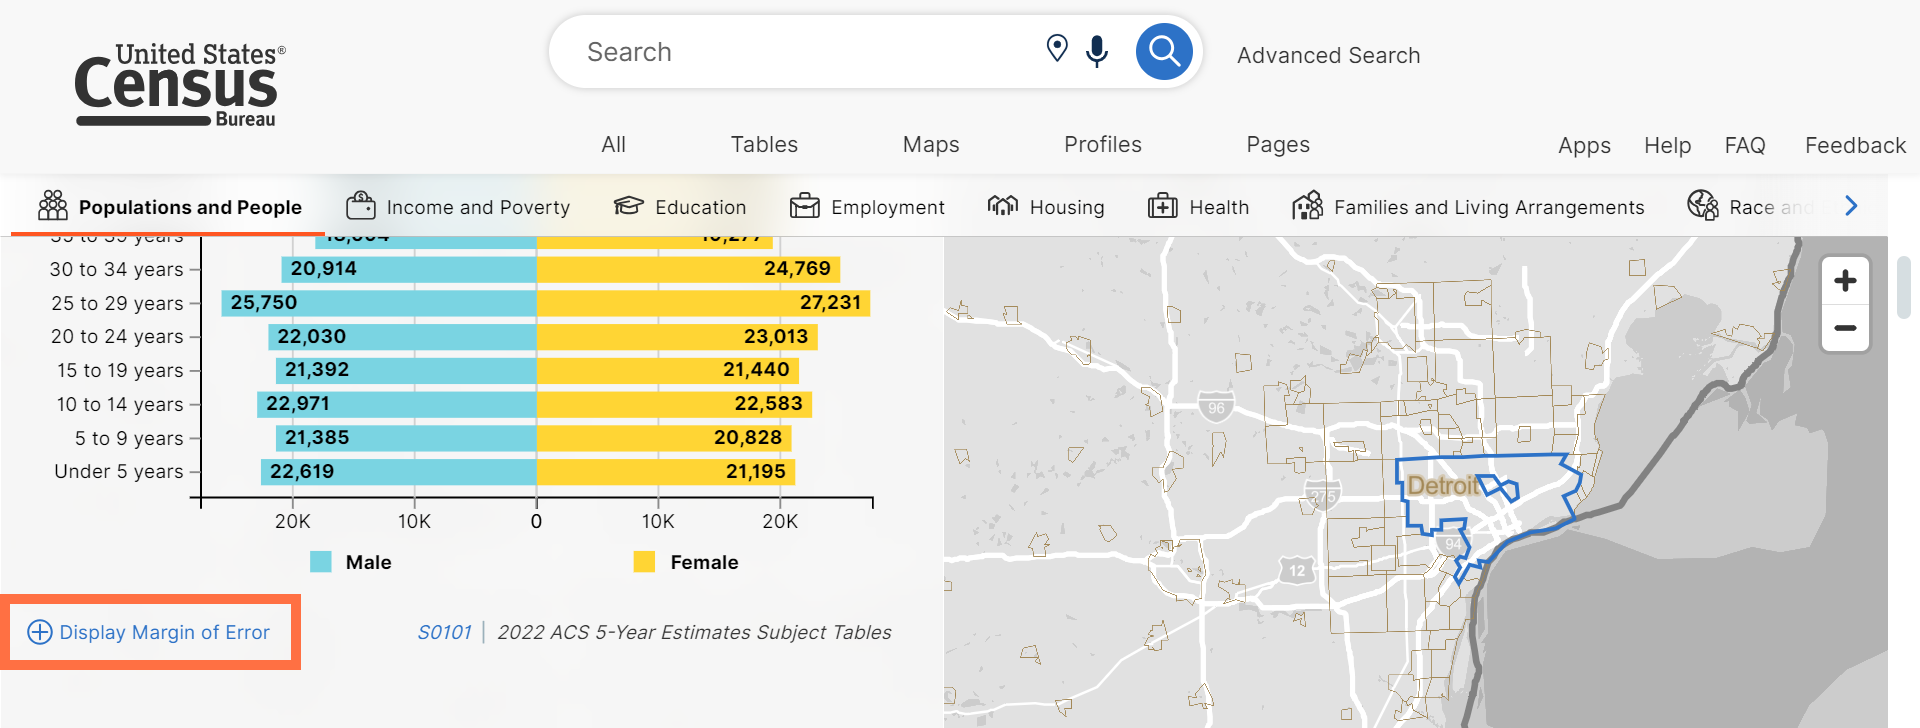
- Improved display of margins of error for population pyramids in the Geography Profiles. An option labeled “Display Margin of Error” now appears below the population pyramid. Choosing to display the margin of error provides an expanded view of the population pyramid with margins of error included.
- Removed “clear filters on new search” toggle. We removed this option because the functionality was not intuitive to users.
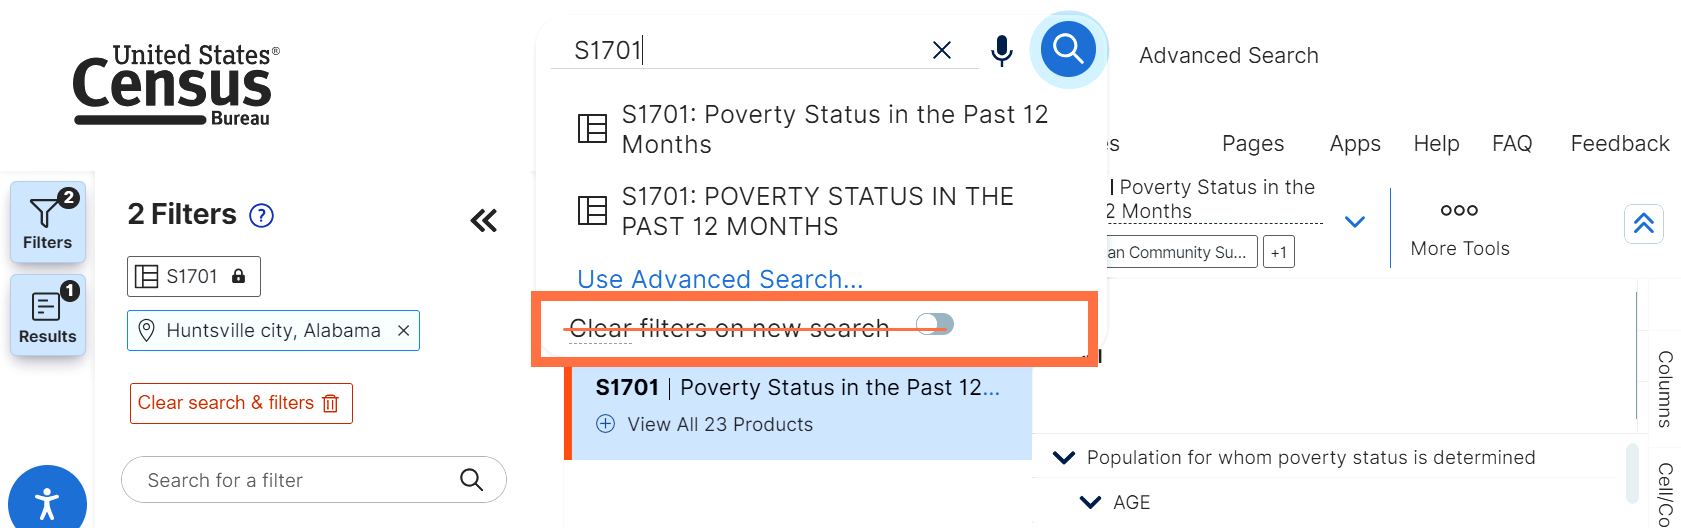
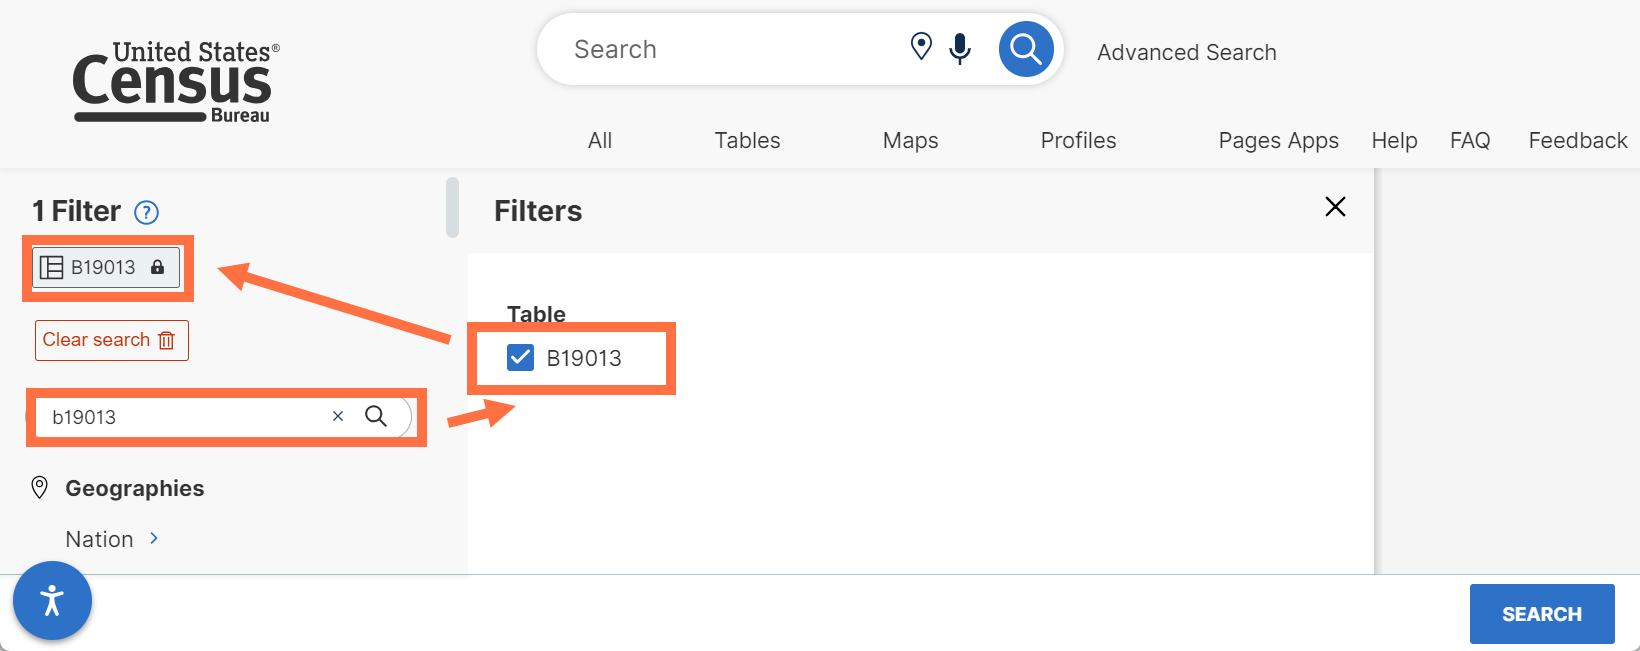
- Ability to select table ID filters in the “Search for a filter or table” search box in the left navigation of the filter panel.
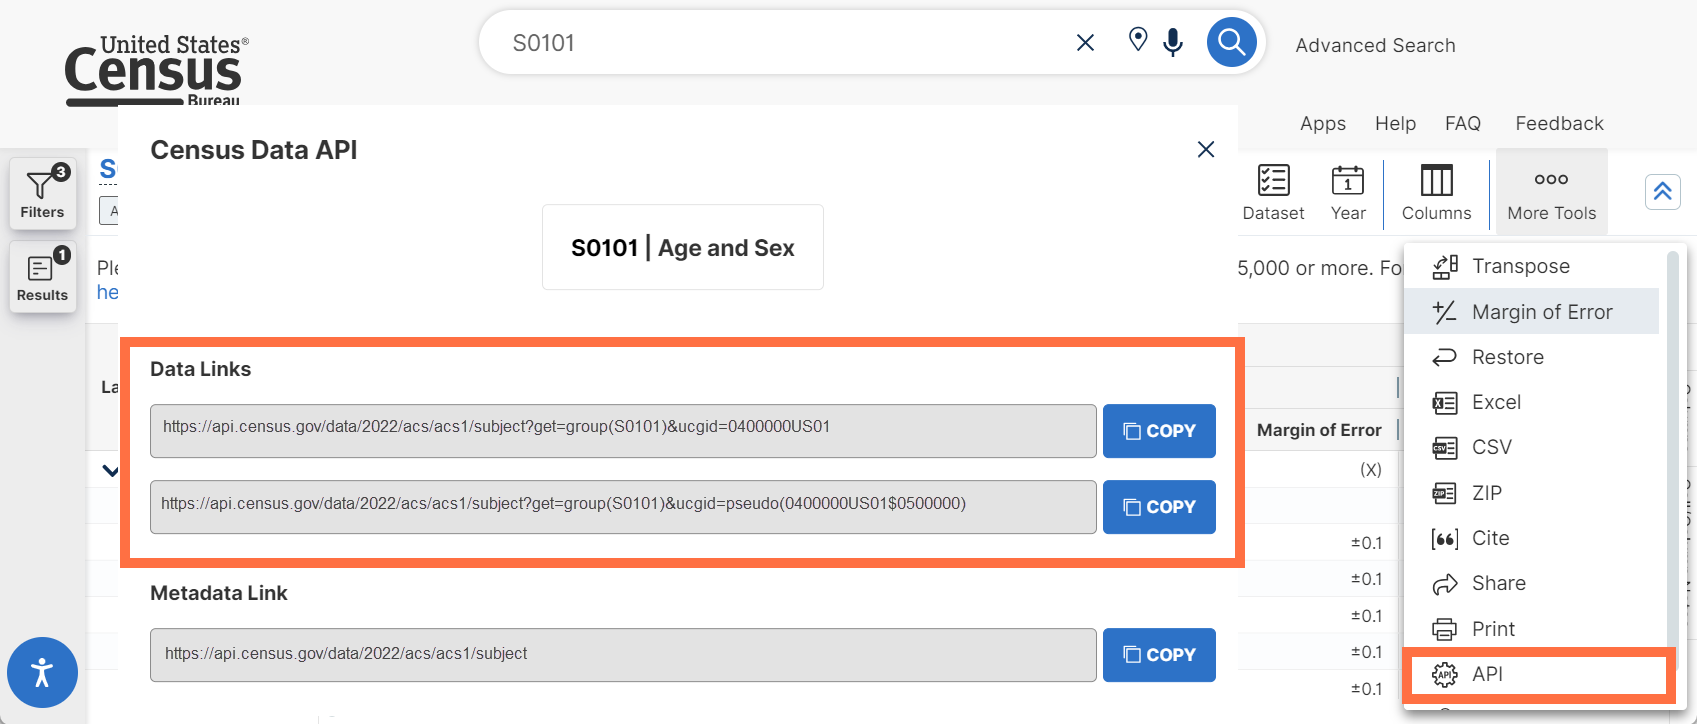
- Ability to provide multiple links to application programming interface (API) data requests that correspond to your table view. When applicable based on your table selection, multiple API links are now provided in a ready-to-use format with their own copy buttons.
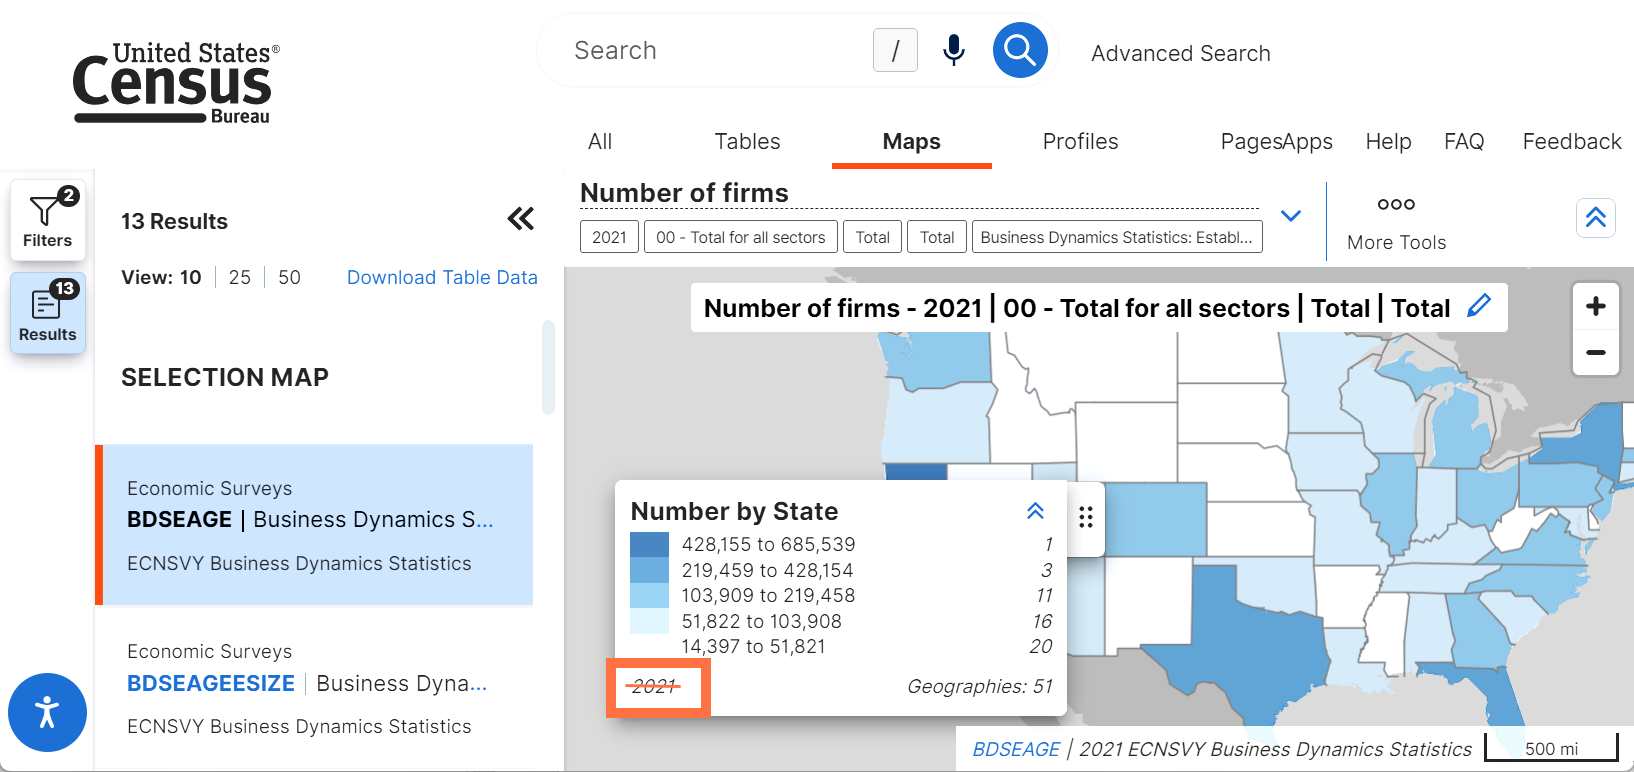
- Removal of the year in the map legend for timeseries datasets to prevent conflicting years from showing in the same view.
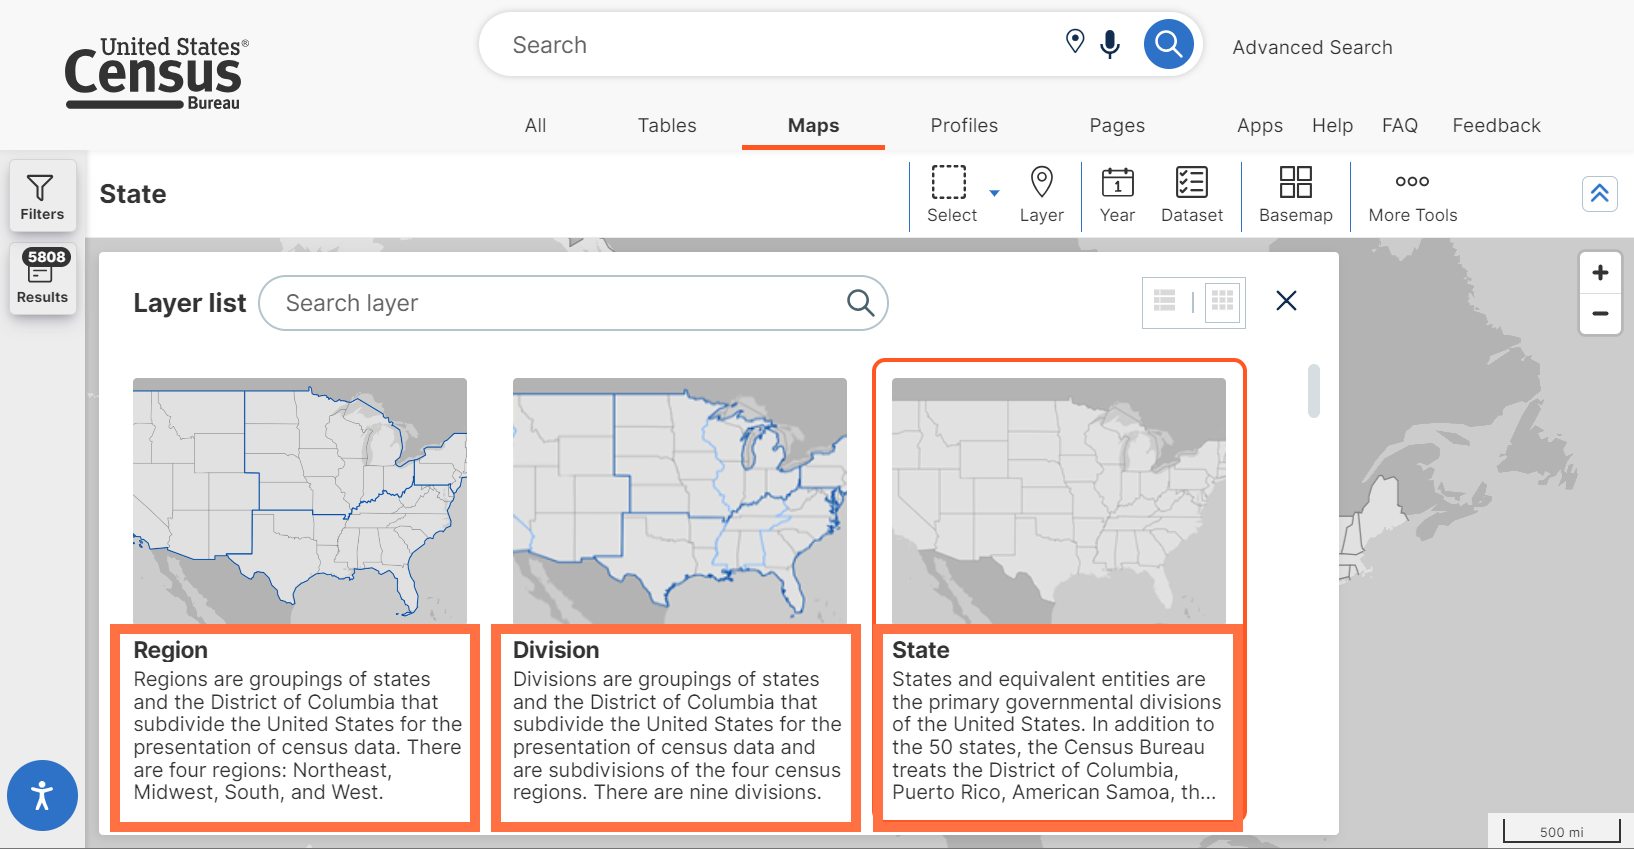
- Improved formatting for descriptions of map layers. These updates provide the description in a readable format with appropriate spacing.
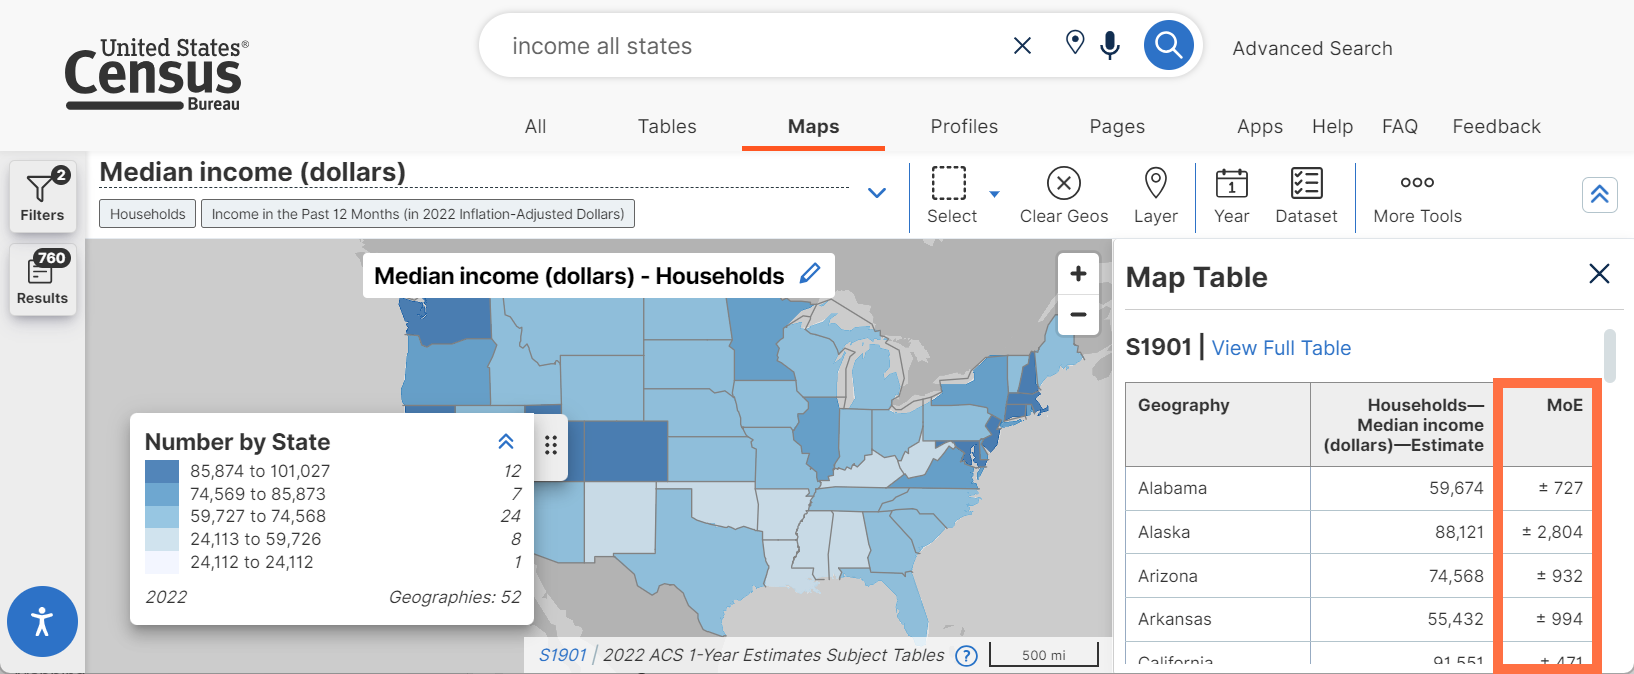
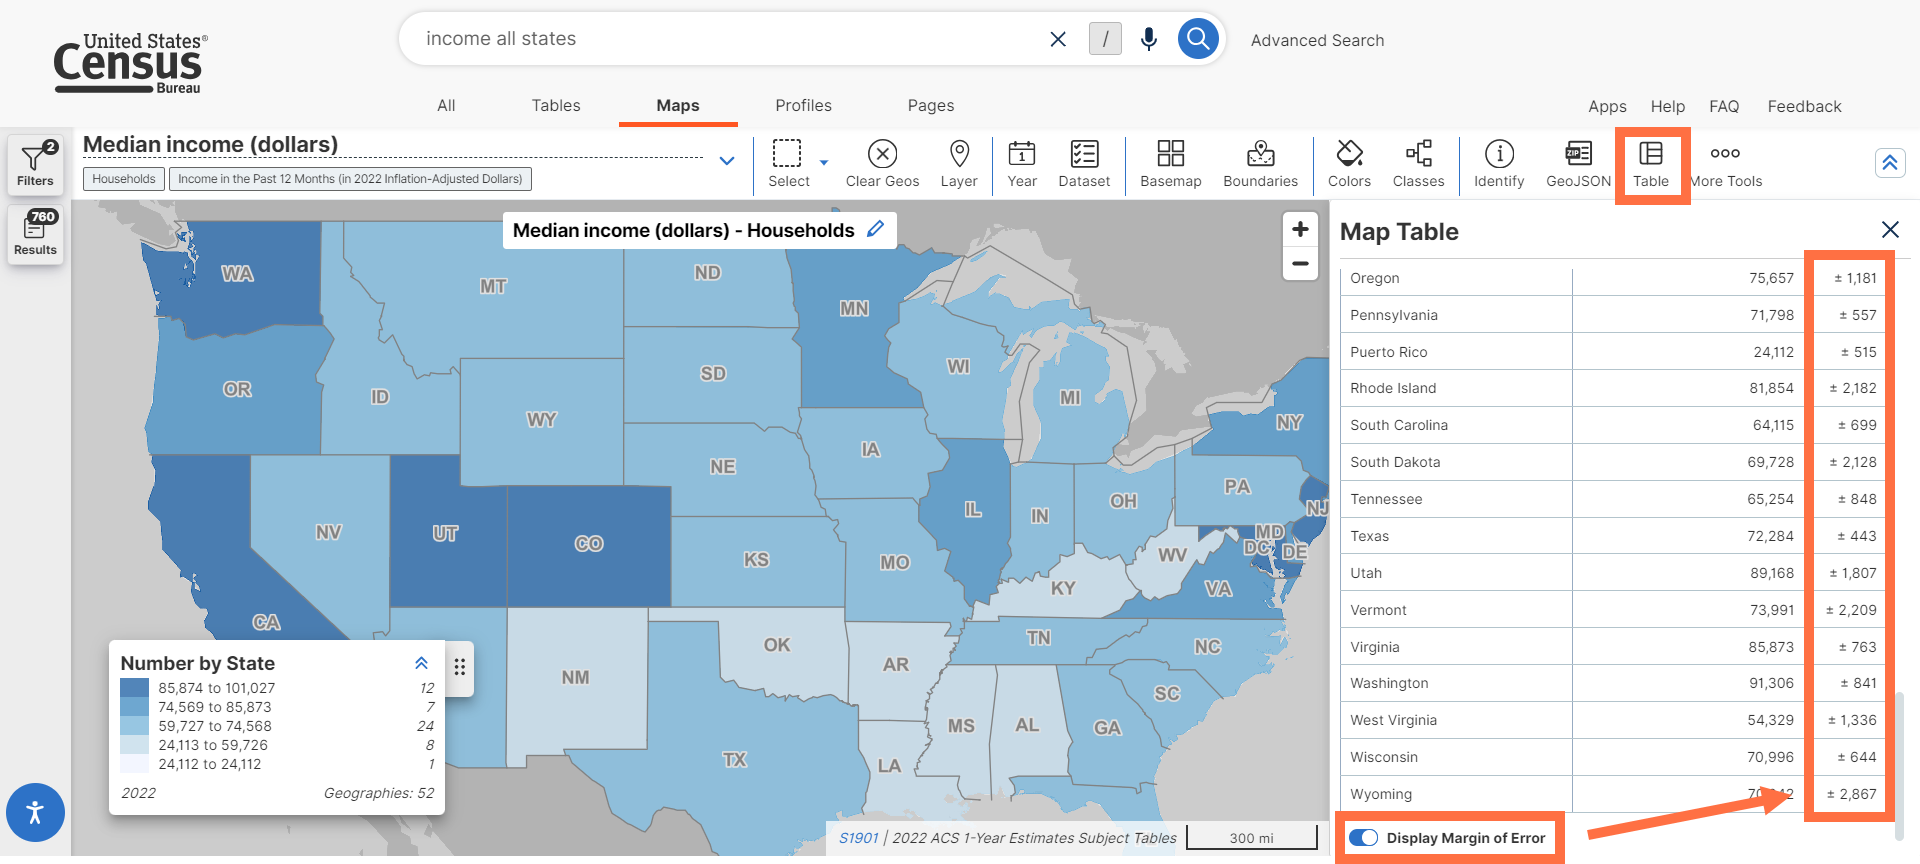
- Margins of error (MoEs) displayed by default in the table view for your map.
- Behind-the-scenes updates to improve table notes in future releases.
- Technical updates to improve the ability to provide updated geography reference details at the top of the Profile pages.
- Continued technical work to improve the Microdata Access Tool (MDAT) in future releases.
- Fixes to 11 defects, including fixes that allow you to:
- View the legend for the map you created.
- View margins of error in population pyramids and tables in the map view.
On June 18, we released the following updates to the site:
- New API status page, accessible at api.census.gov/status
The landing page indicates overall status for the Census Data API and the Census API Key Signup:- Green = Up
- Yellow = Intermittent
- Red = Down
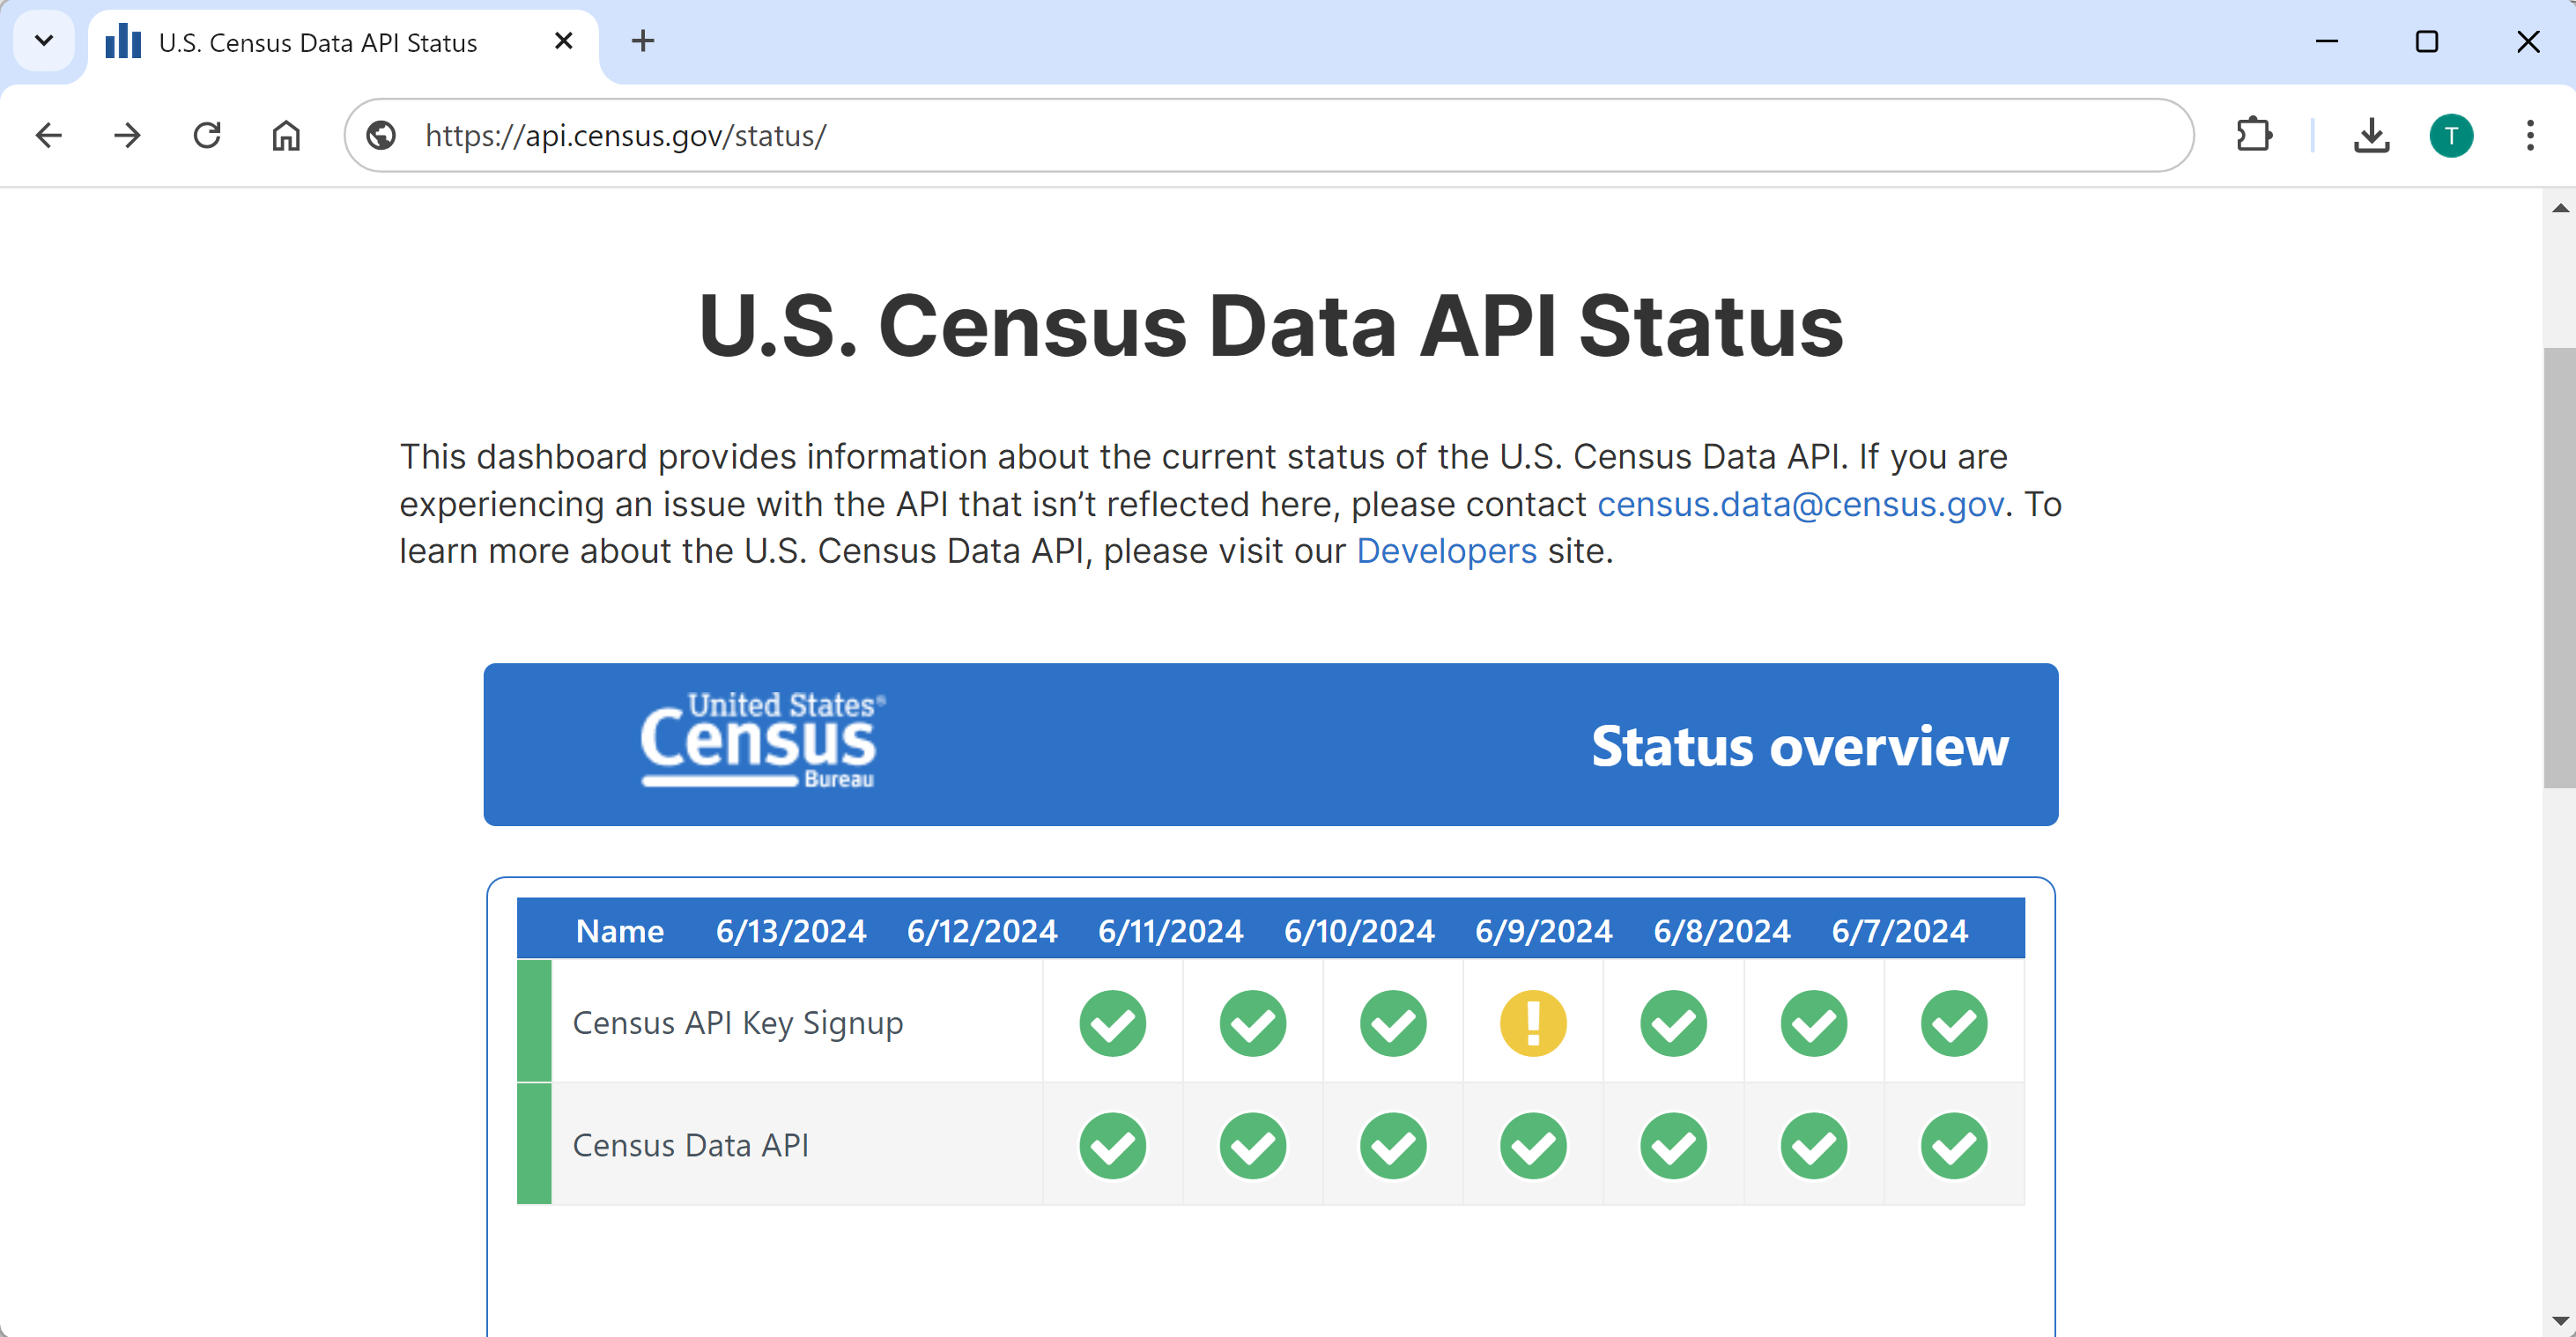
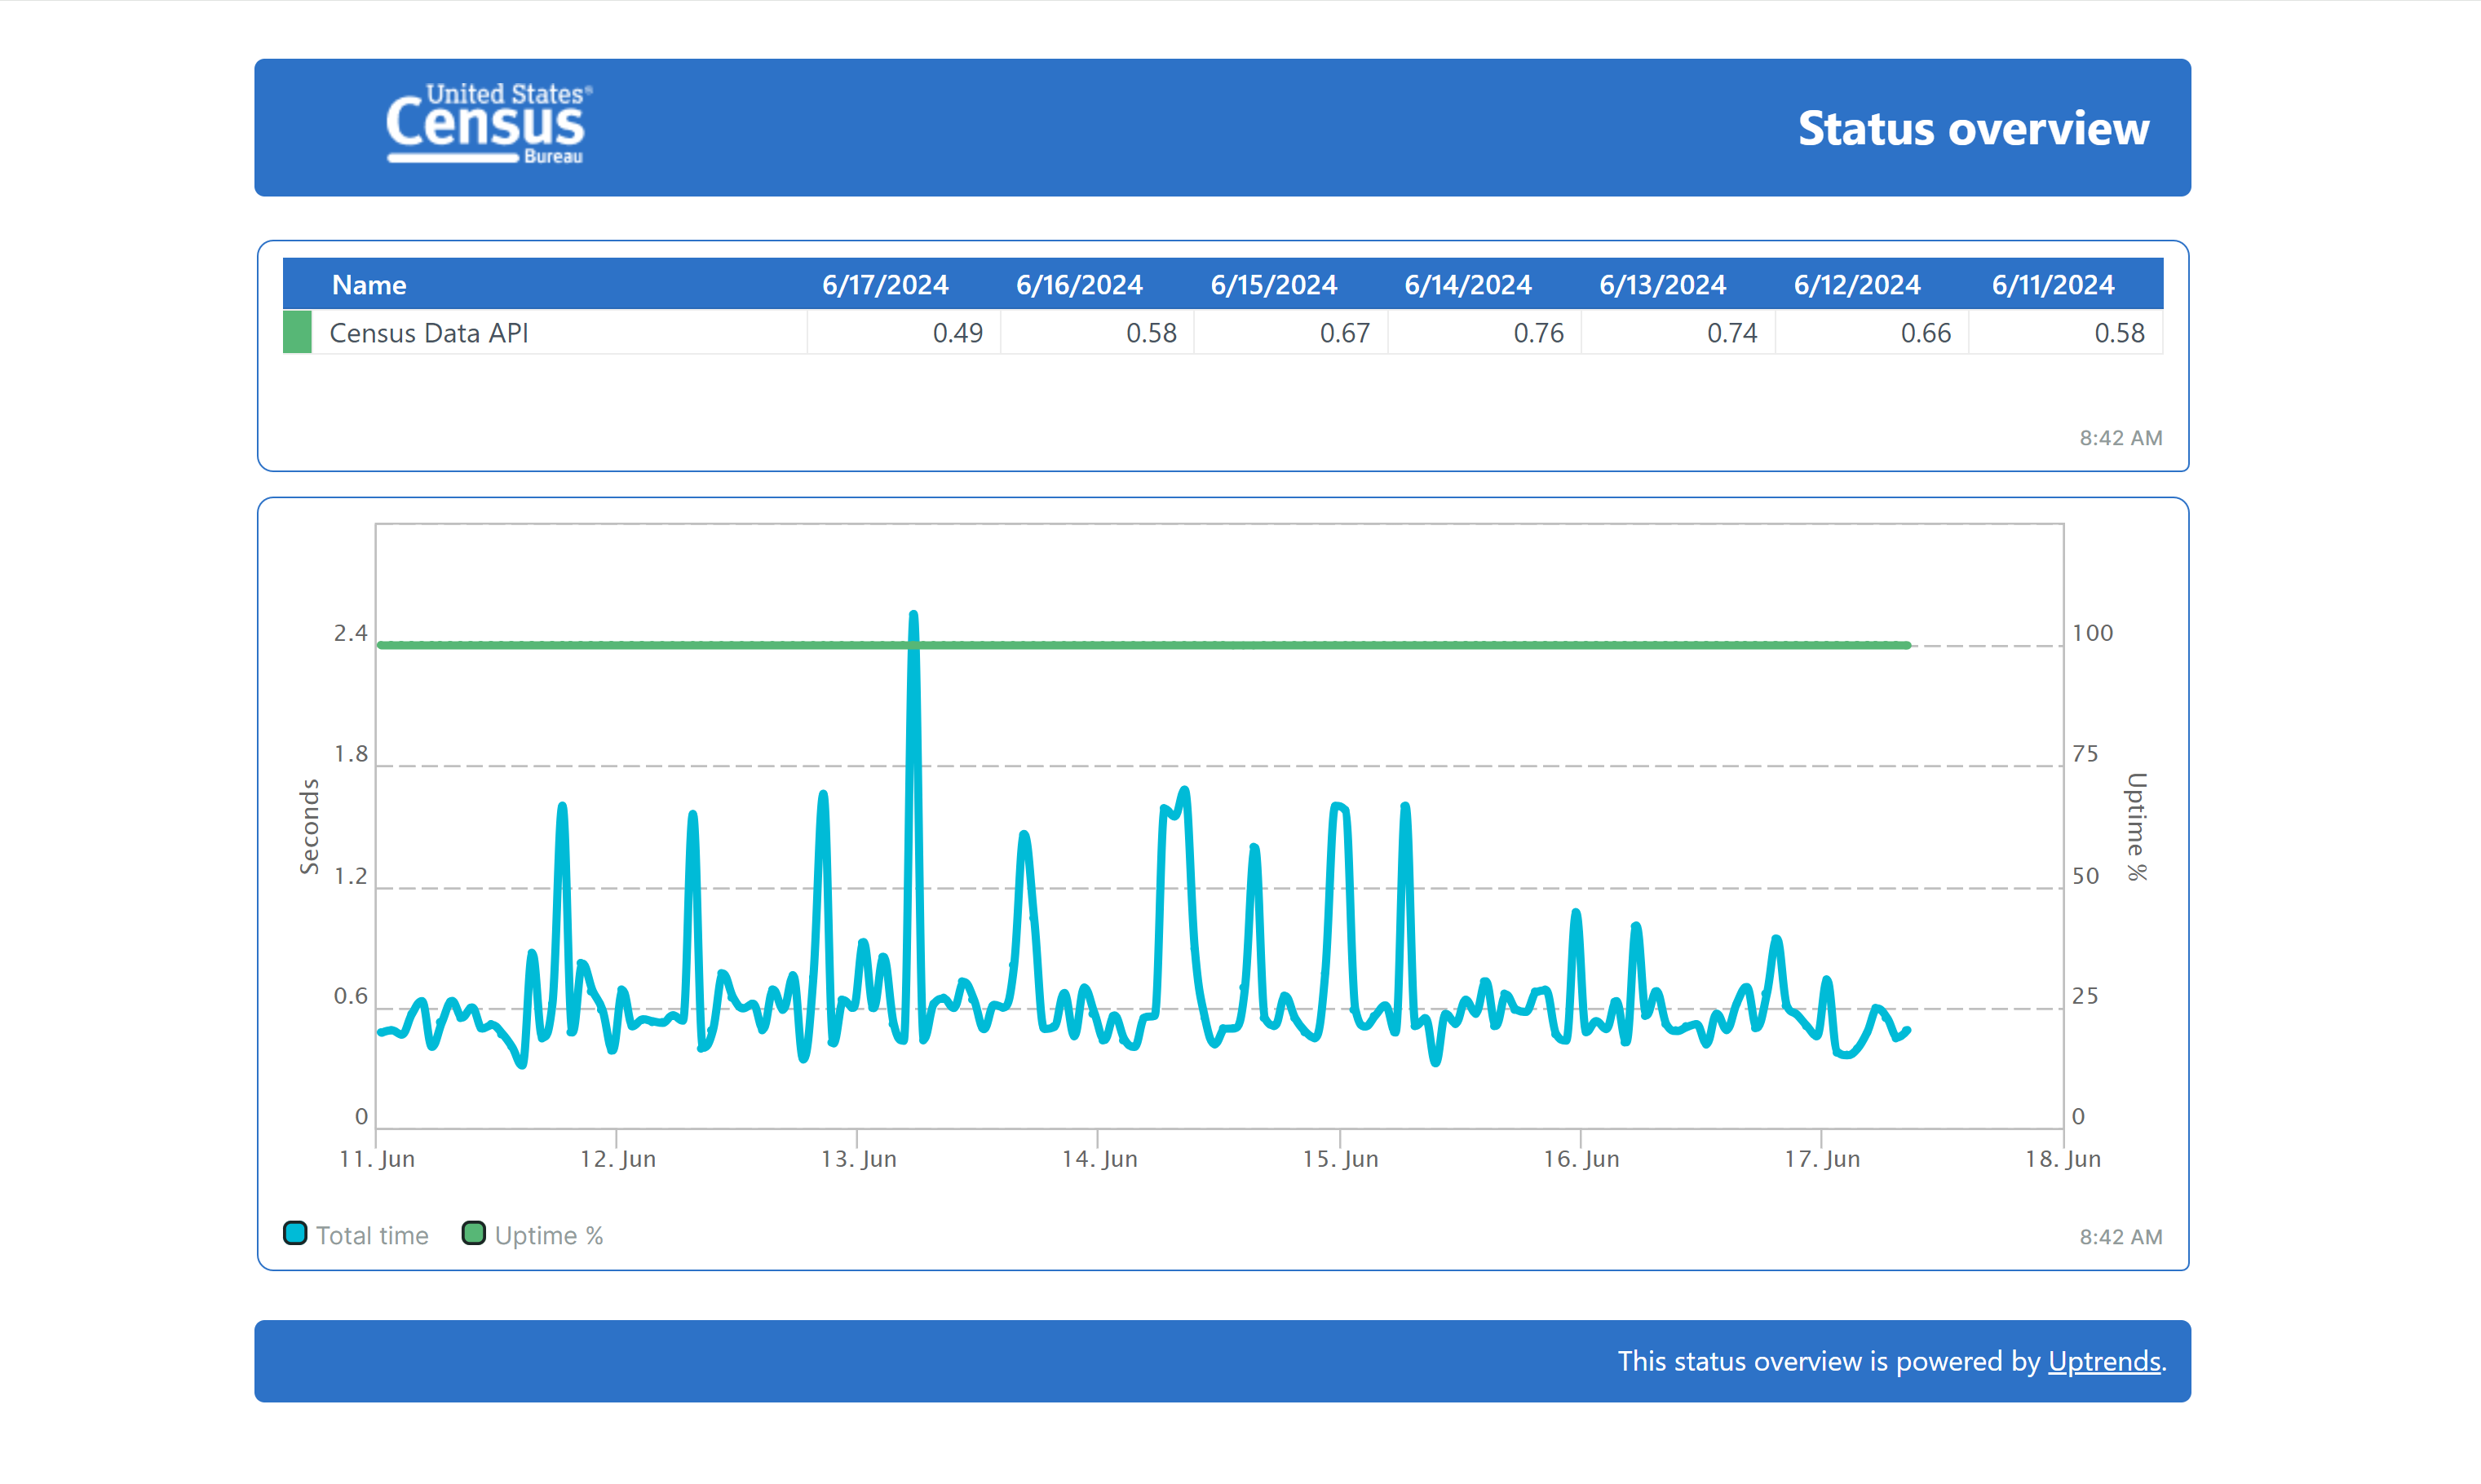
Click “Census Data API” or “Census API Key Signup” to get more detailed metrics and visualizations, including:
- Average daily response times, in seconds
- Actual response times at 1-hour intervals throughout the time range.
- Percent uptime, ranging from 0%-100%
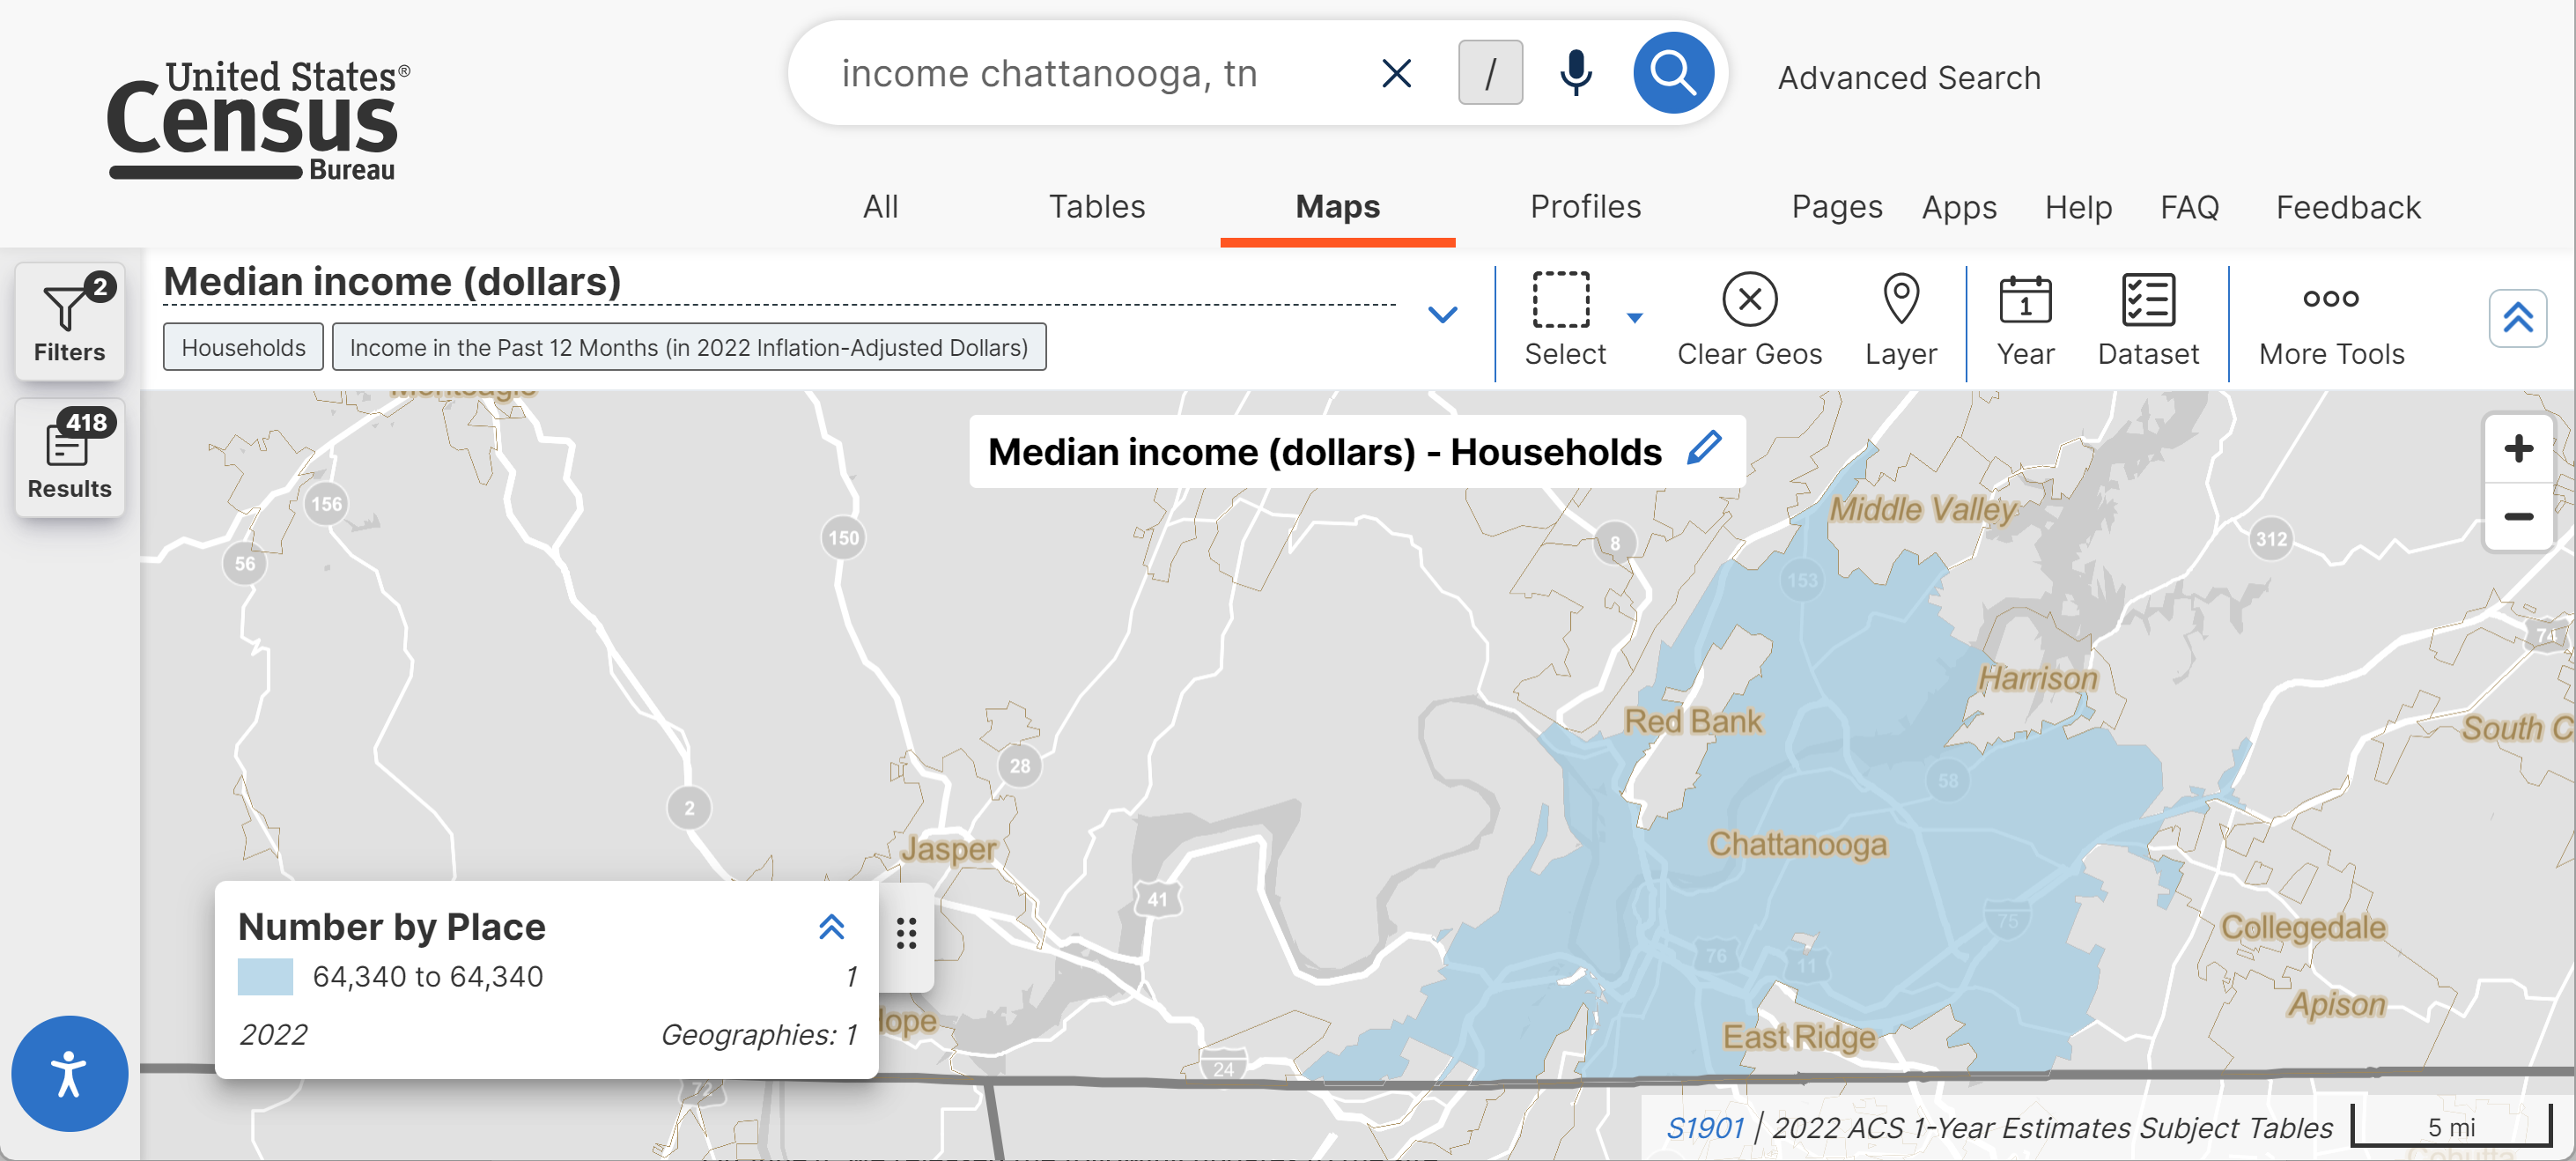
- Improved mapping functionality for places. When you choose a place-level geography, new technical updates ensure that the map displays the correct vintage for that geography and automatically zooms to your selected area.
- Continued technical work to improve the Microdata Access Tool (MDAT) in future releases.
- Fixes to 8 defects, including fixes that allow you to:
- View Geography Profiles for congressional districts.
- View correct map layer for place-level geographies.
On June 4, we released the following updates to the site:
- New “Display Margin of Error” toggle, allowing you to view margins of error in the table view for your map.
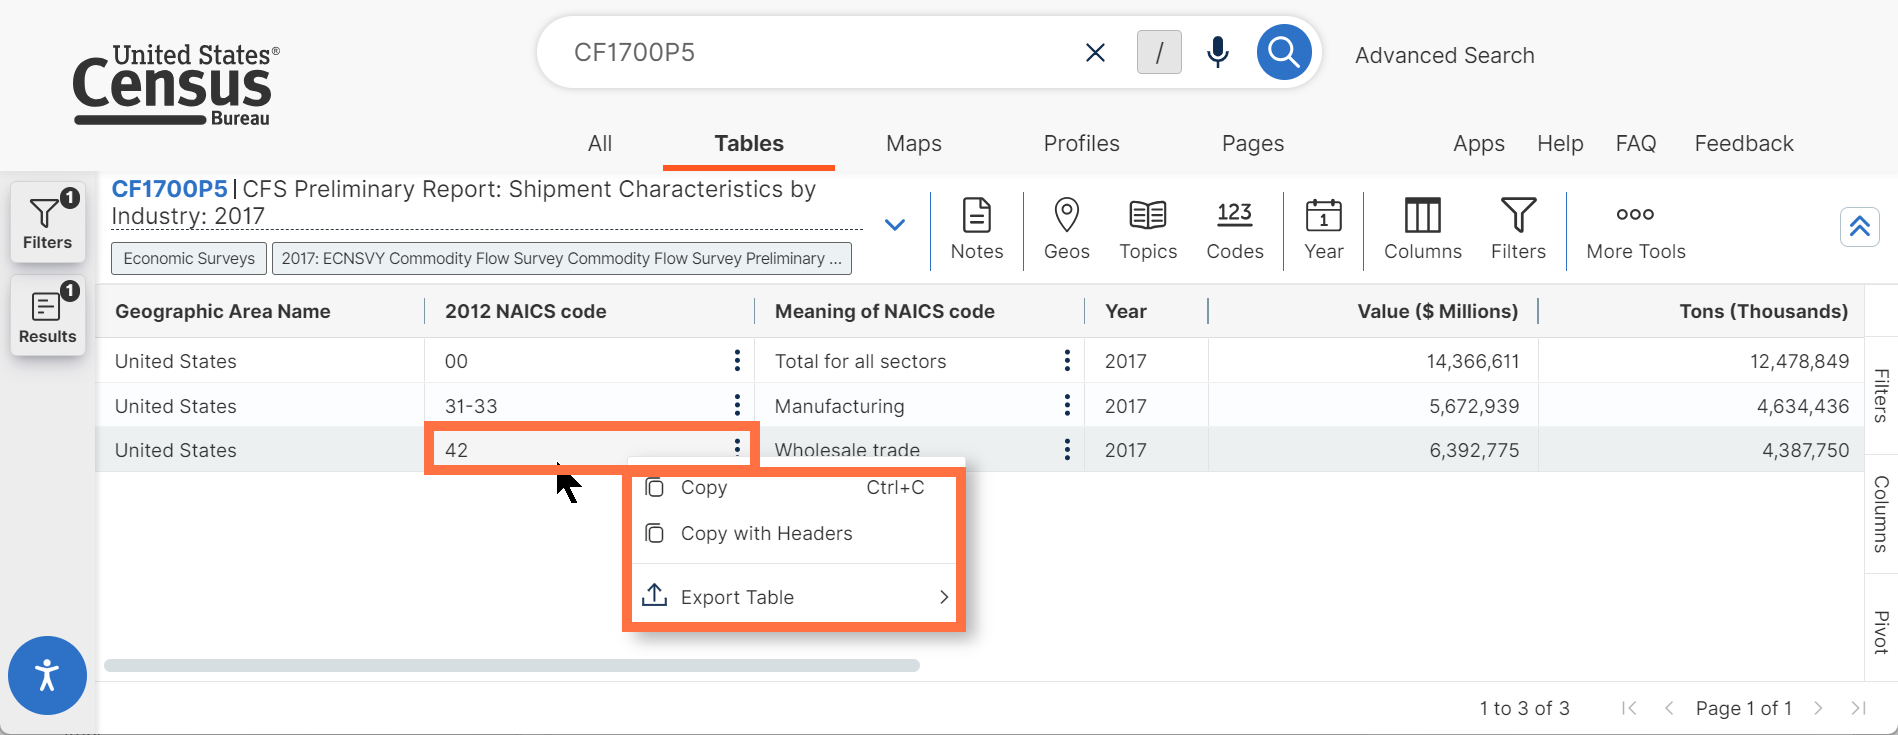
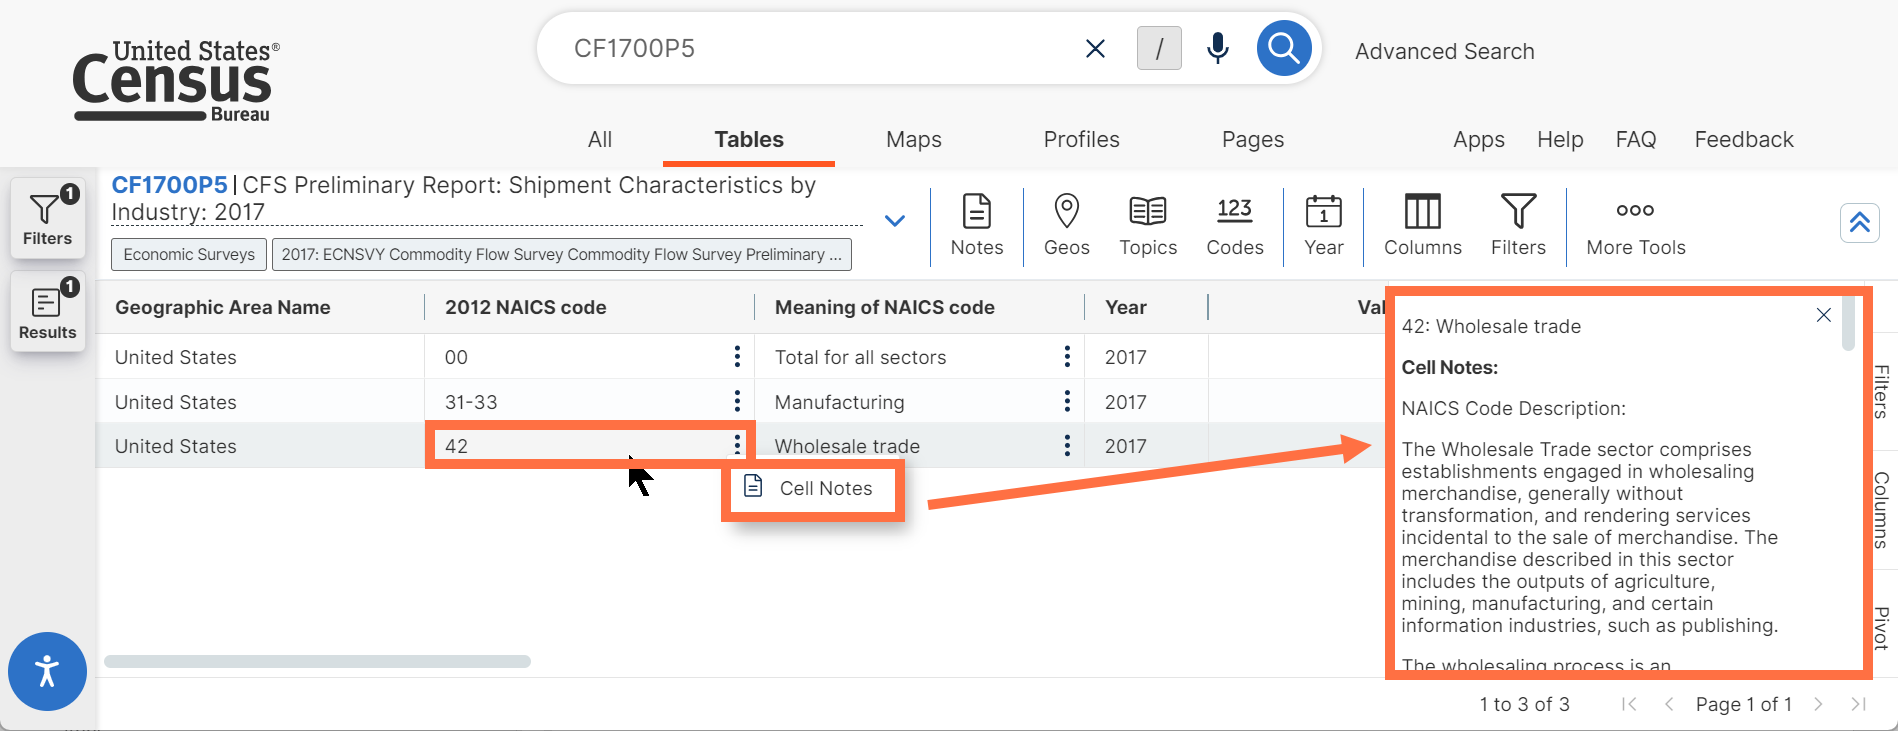
- Improvements to controls for interacting with table cells:
- Right-click any table cell to copy or export the table.
- Left-click table cells containing three vertical dots to view the notes for that table cell.
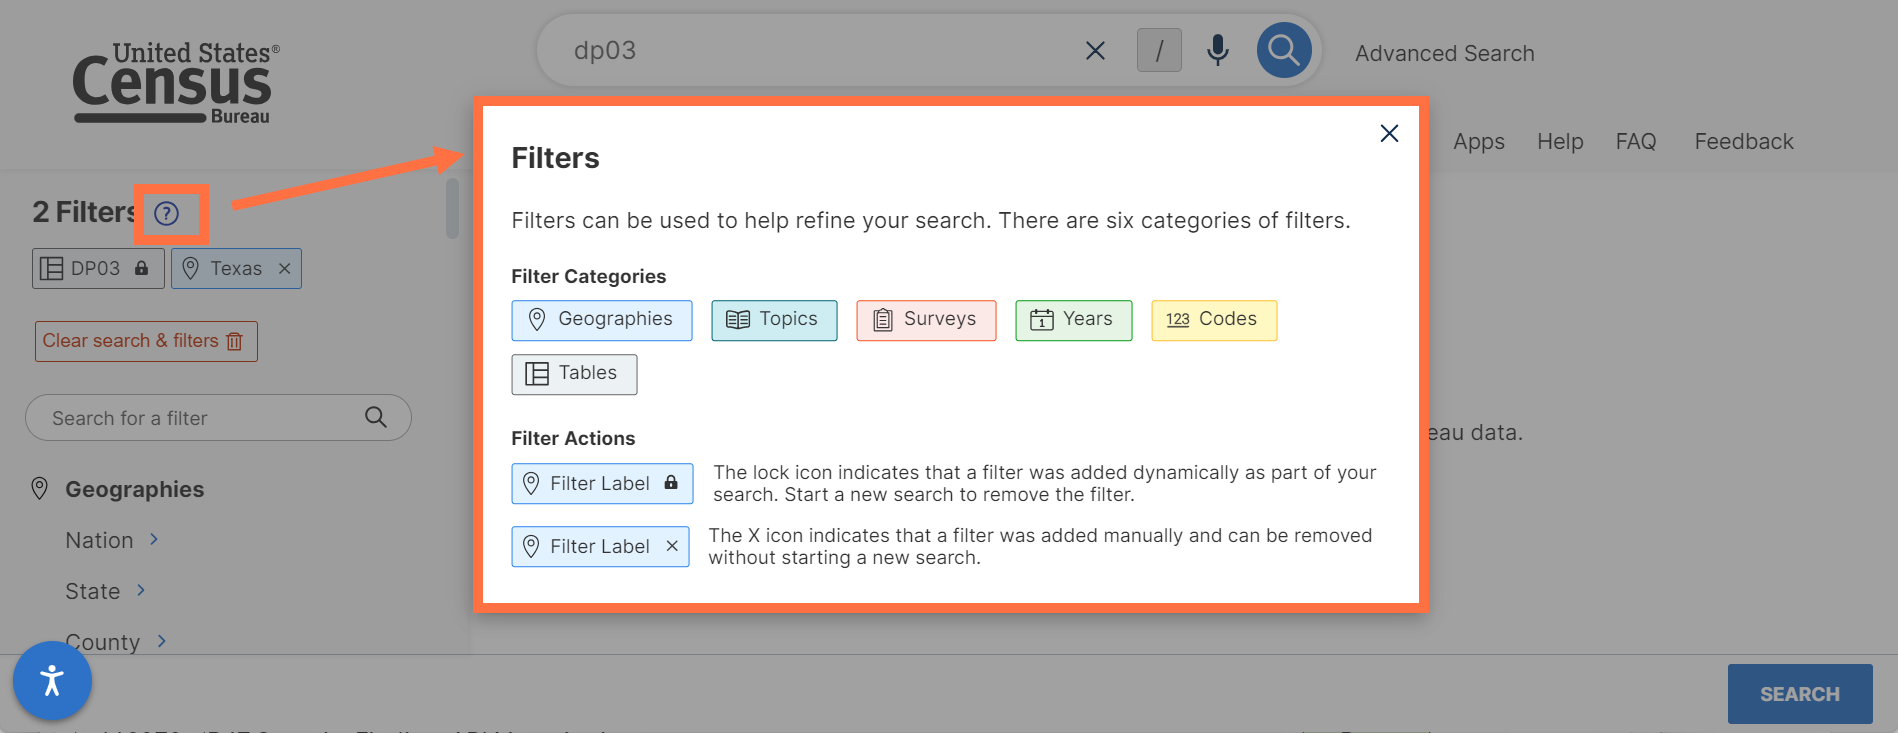
- Improved messaging after clicking the question mark icon to learn more about filters.
- Improved maps for the United States in the Geography Profiles. The updated maps more accurately display Alaska and Hawaii and no longer include a scale.
- Technical work to improve the Microdata Access Tool (MDAT) in future releases, along with other behind-the-scenes enhancements to data.census.gov.
- Fixes to 6 defects, including fixes that allow you to:
- View the correct boundaries for your map by default.
- View footer notes in your table download.
On May 23, we released the following updates to the site:
- New search by address functionality. After typing in an address, we provide a clickable list of Census Bureau geographies that an address falls within.
To access this new functionality, click the geography pin icon in the single search bar on the landing page of data.census.gov. Enter the street address in the pop-up window, as well as the city/state or ZIP code.
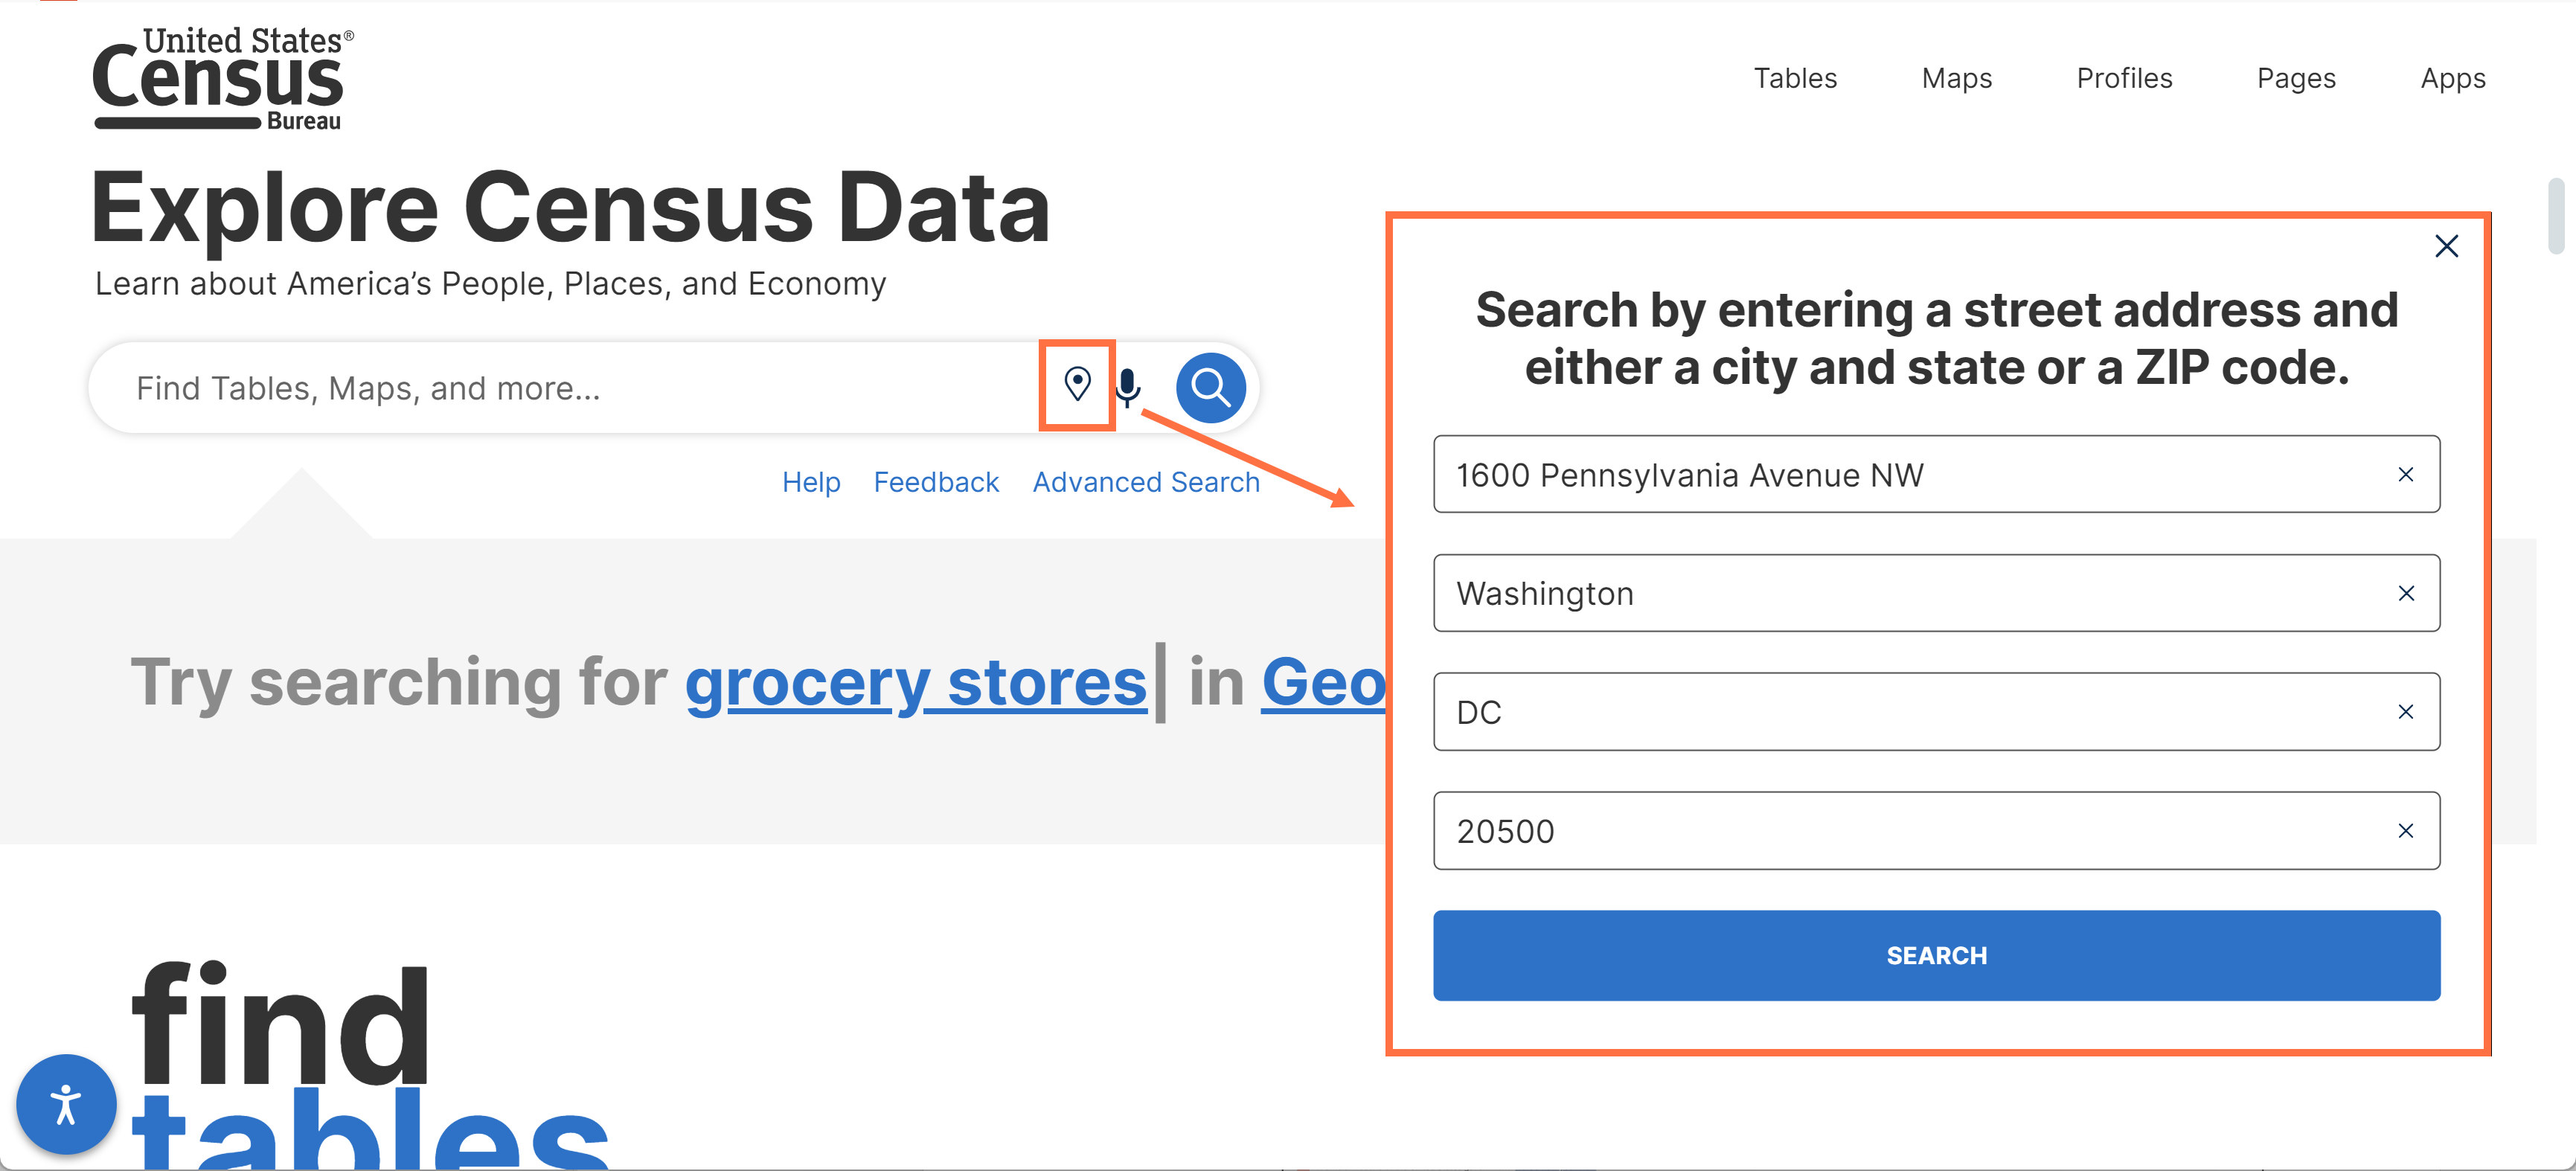
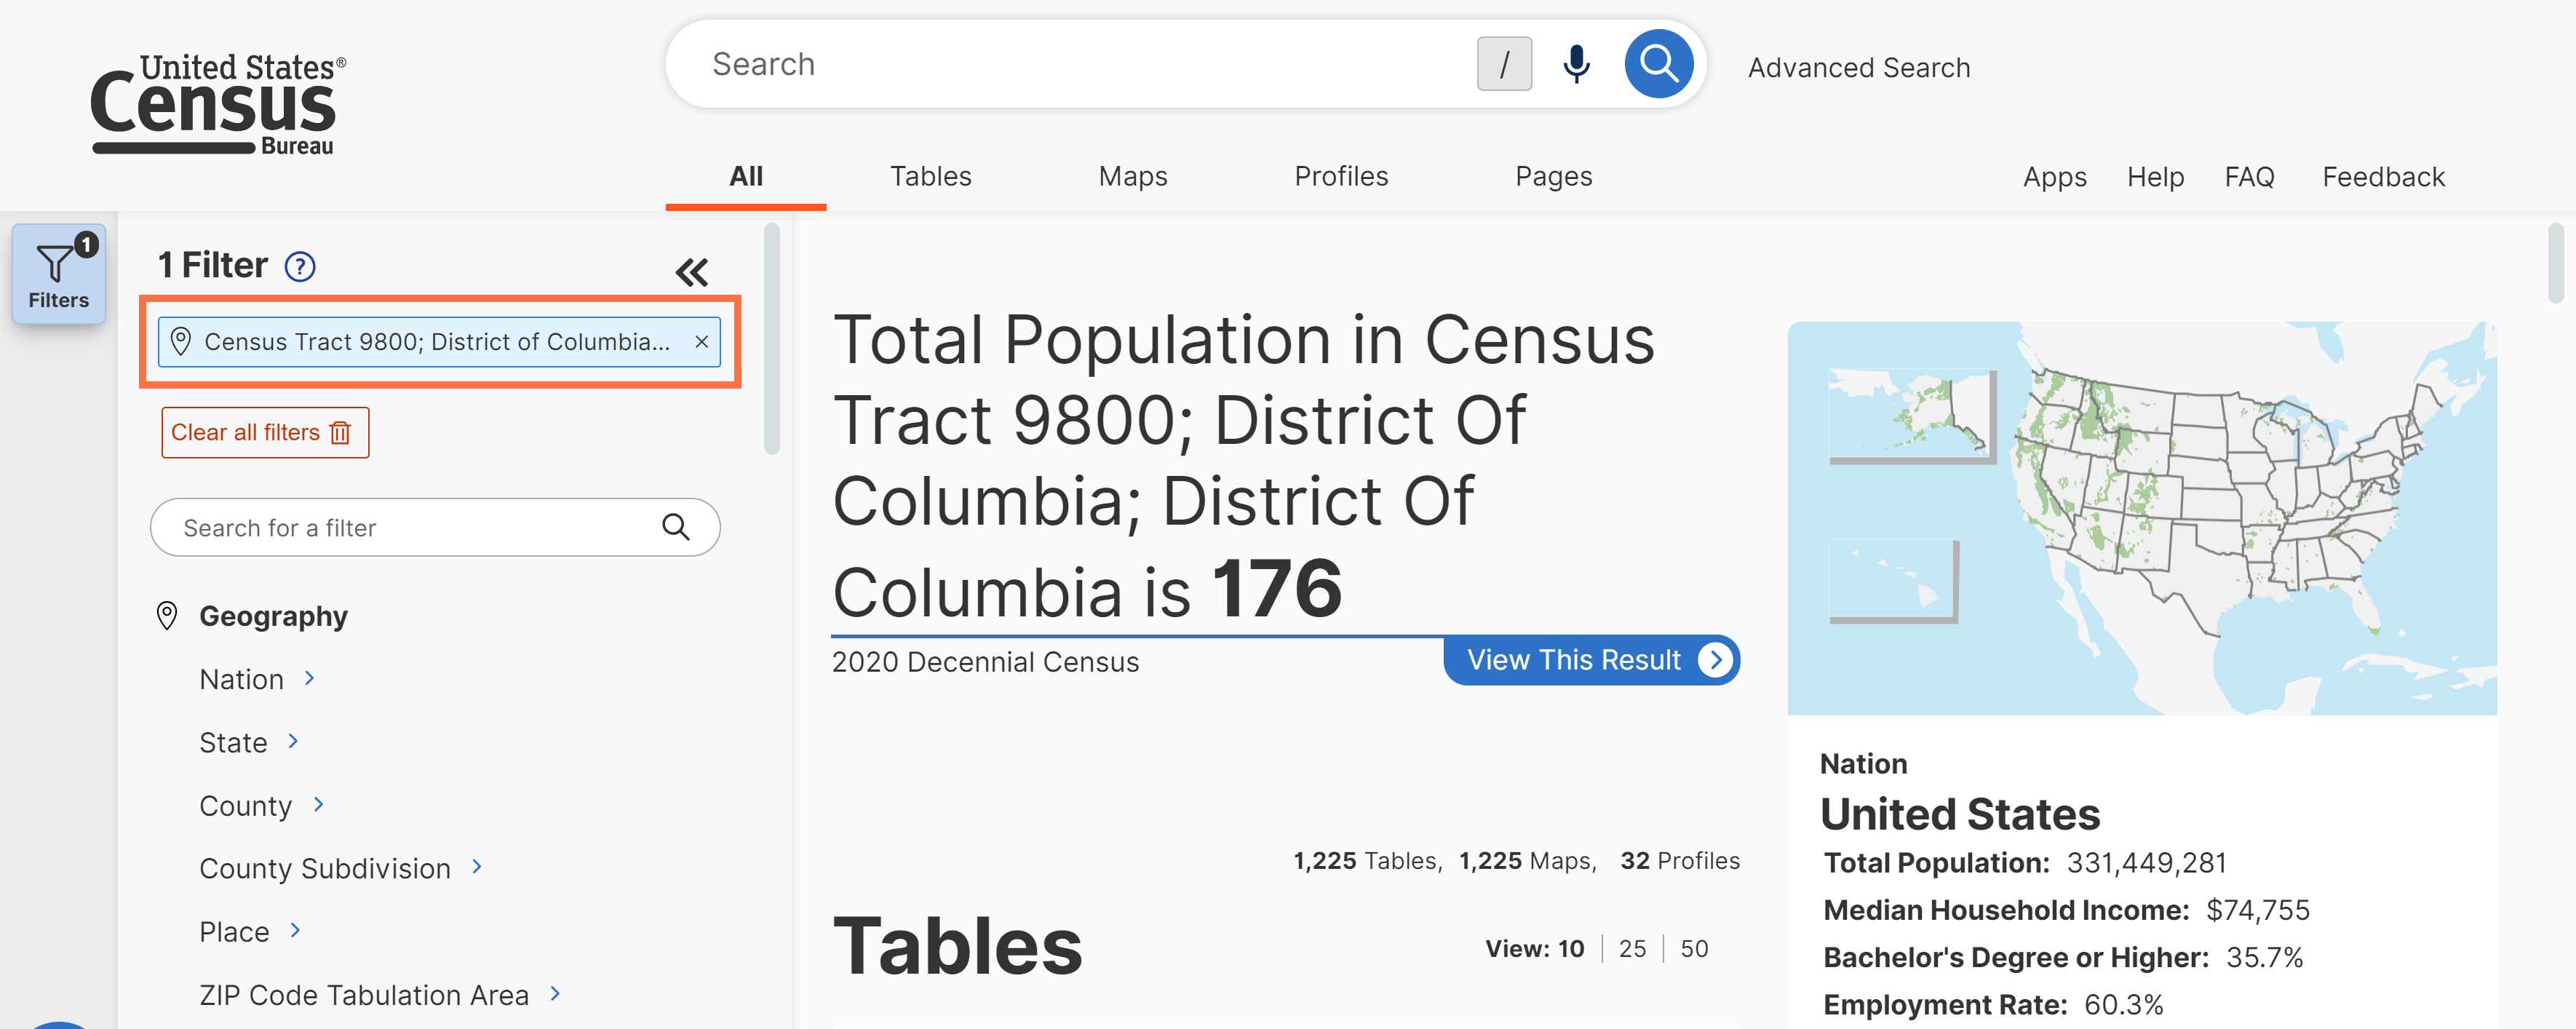
After running the search, you will see a list of geographies the address falls within. Click a geography to add it as a selected filter.
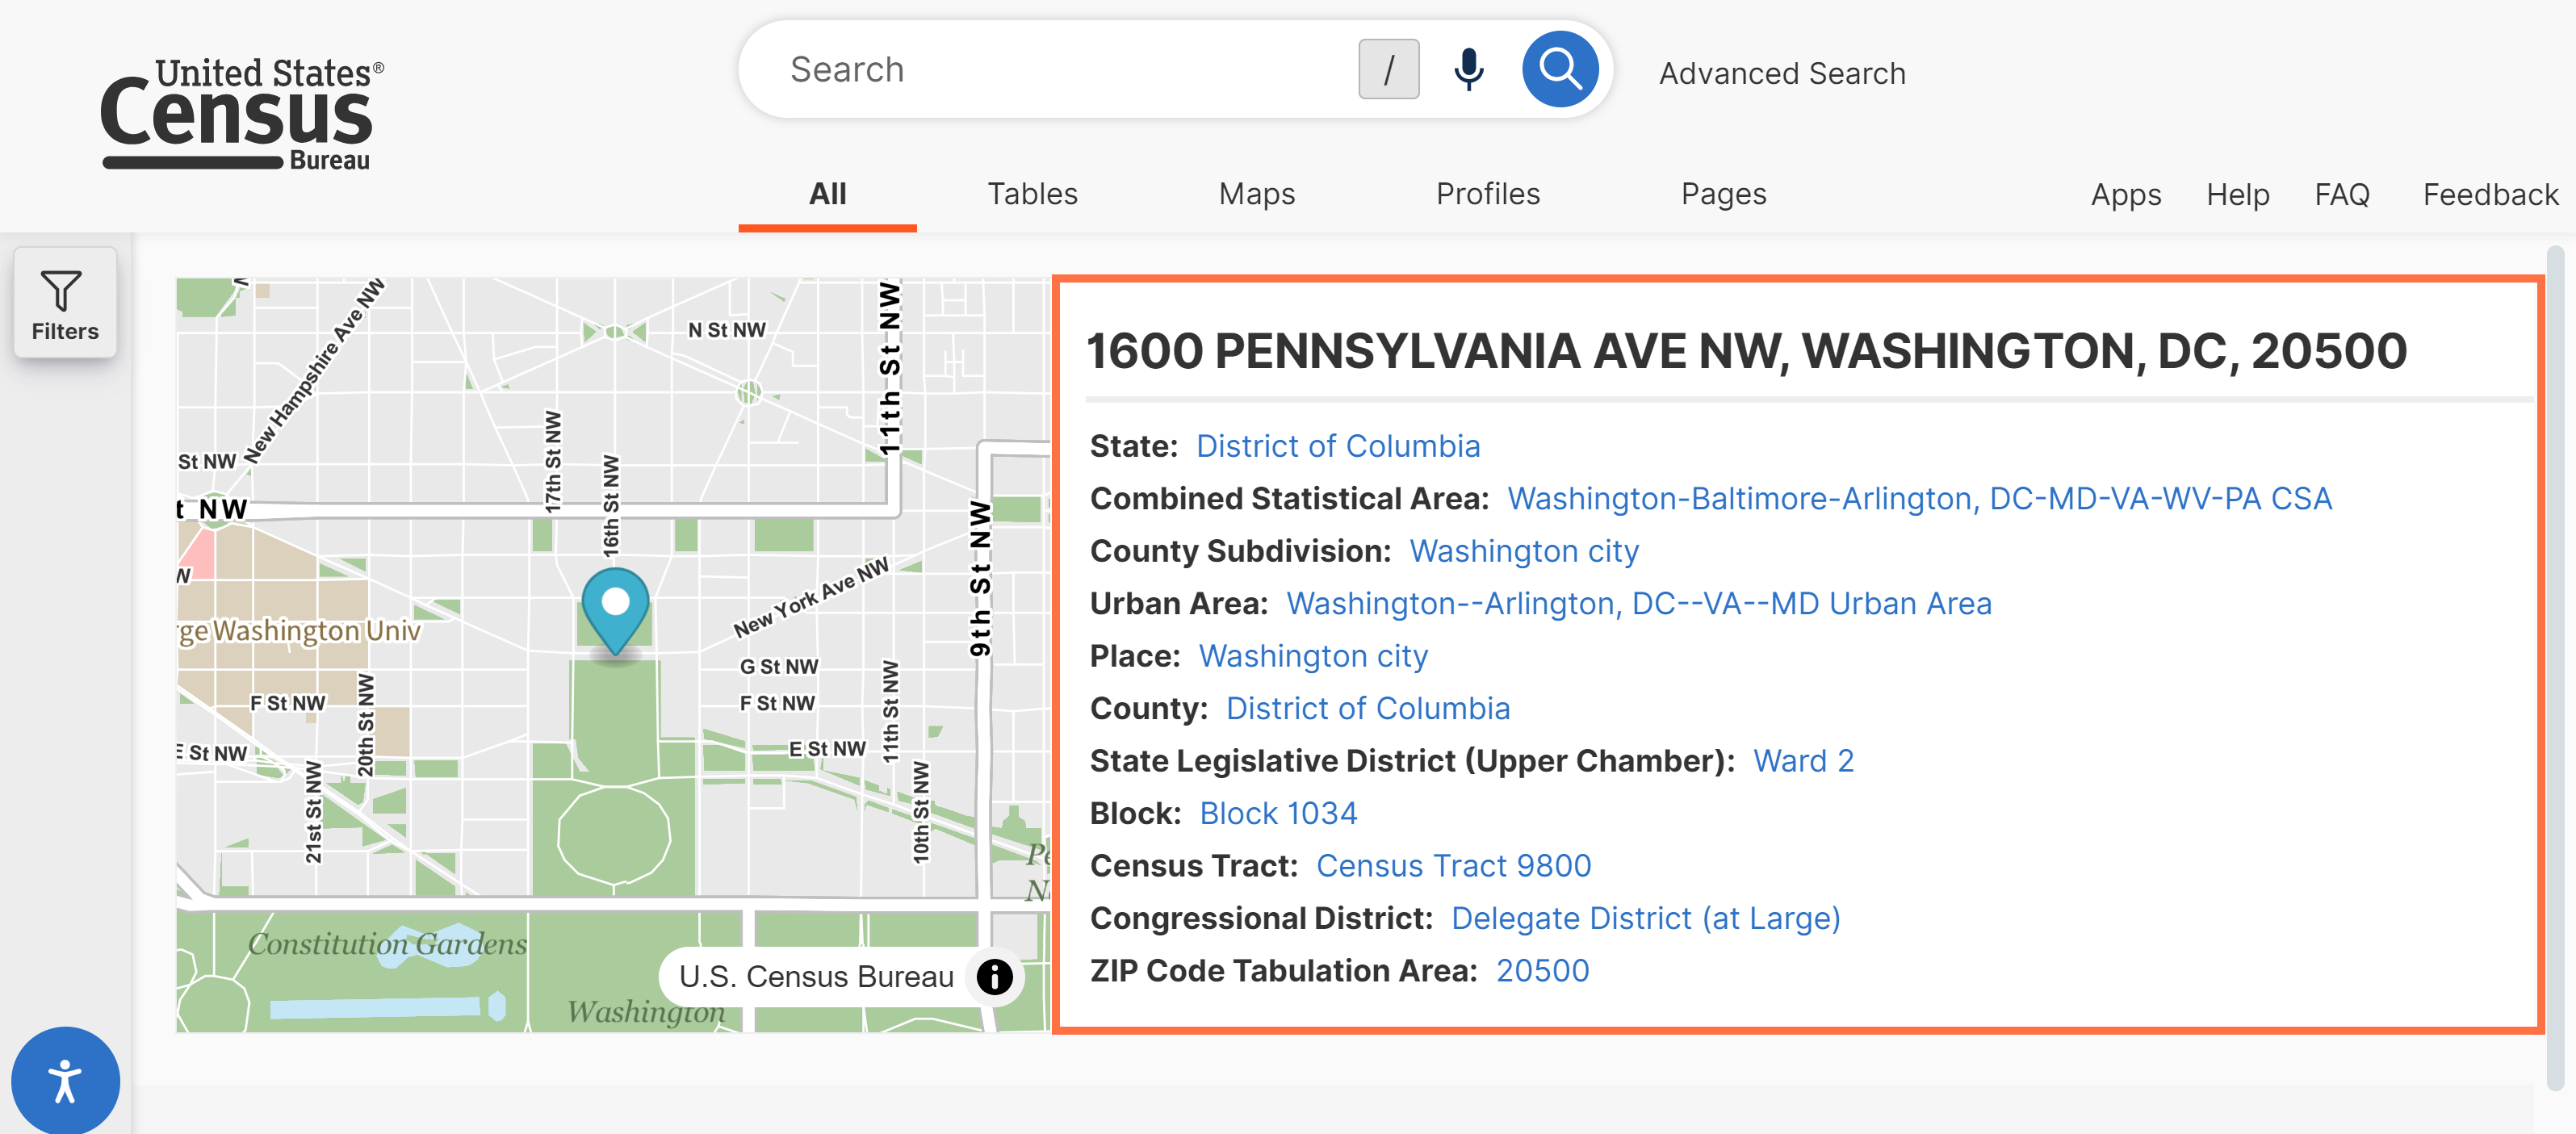
You will see the geography as a filter, allowing you to view results for that geography or apply other search criteria to narrow you search.
Please note:
- Address search functionality on data.census.gov is exclusively available through the landing page
- The address search is powered by and limited to addresses recognized by the Census Geocoder.
- Supported geographies include:
- State
- Combined Statistical Area
- County Subdivision
- Urban Area
- Place
- County
- State Legislative Districts (Upper and Lower Chambers)
- Block
- Census Tract
- Congressional District
- ZIP Code Tabulation Area
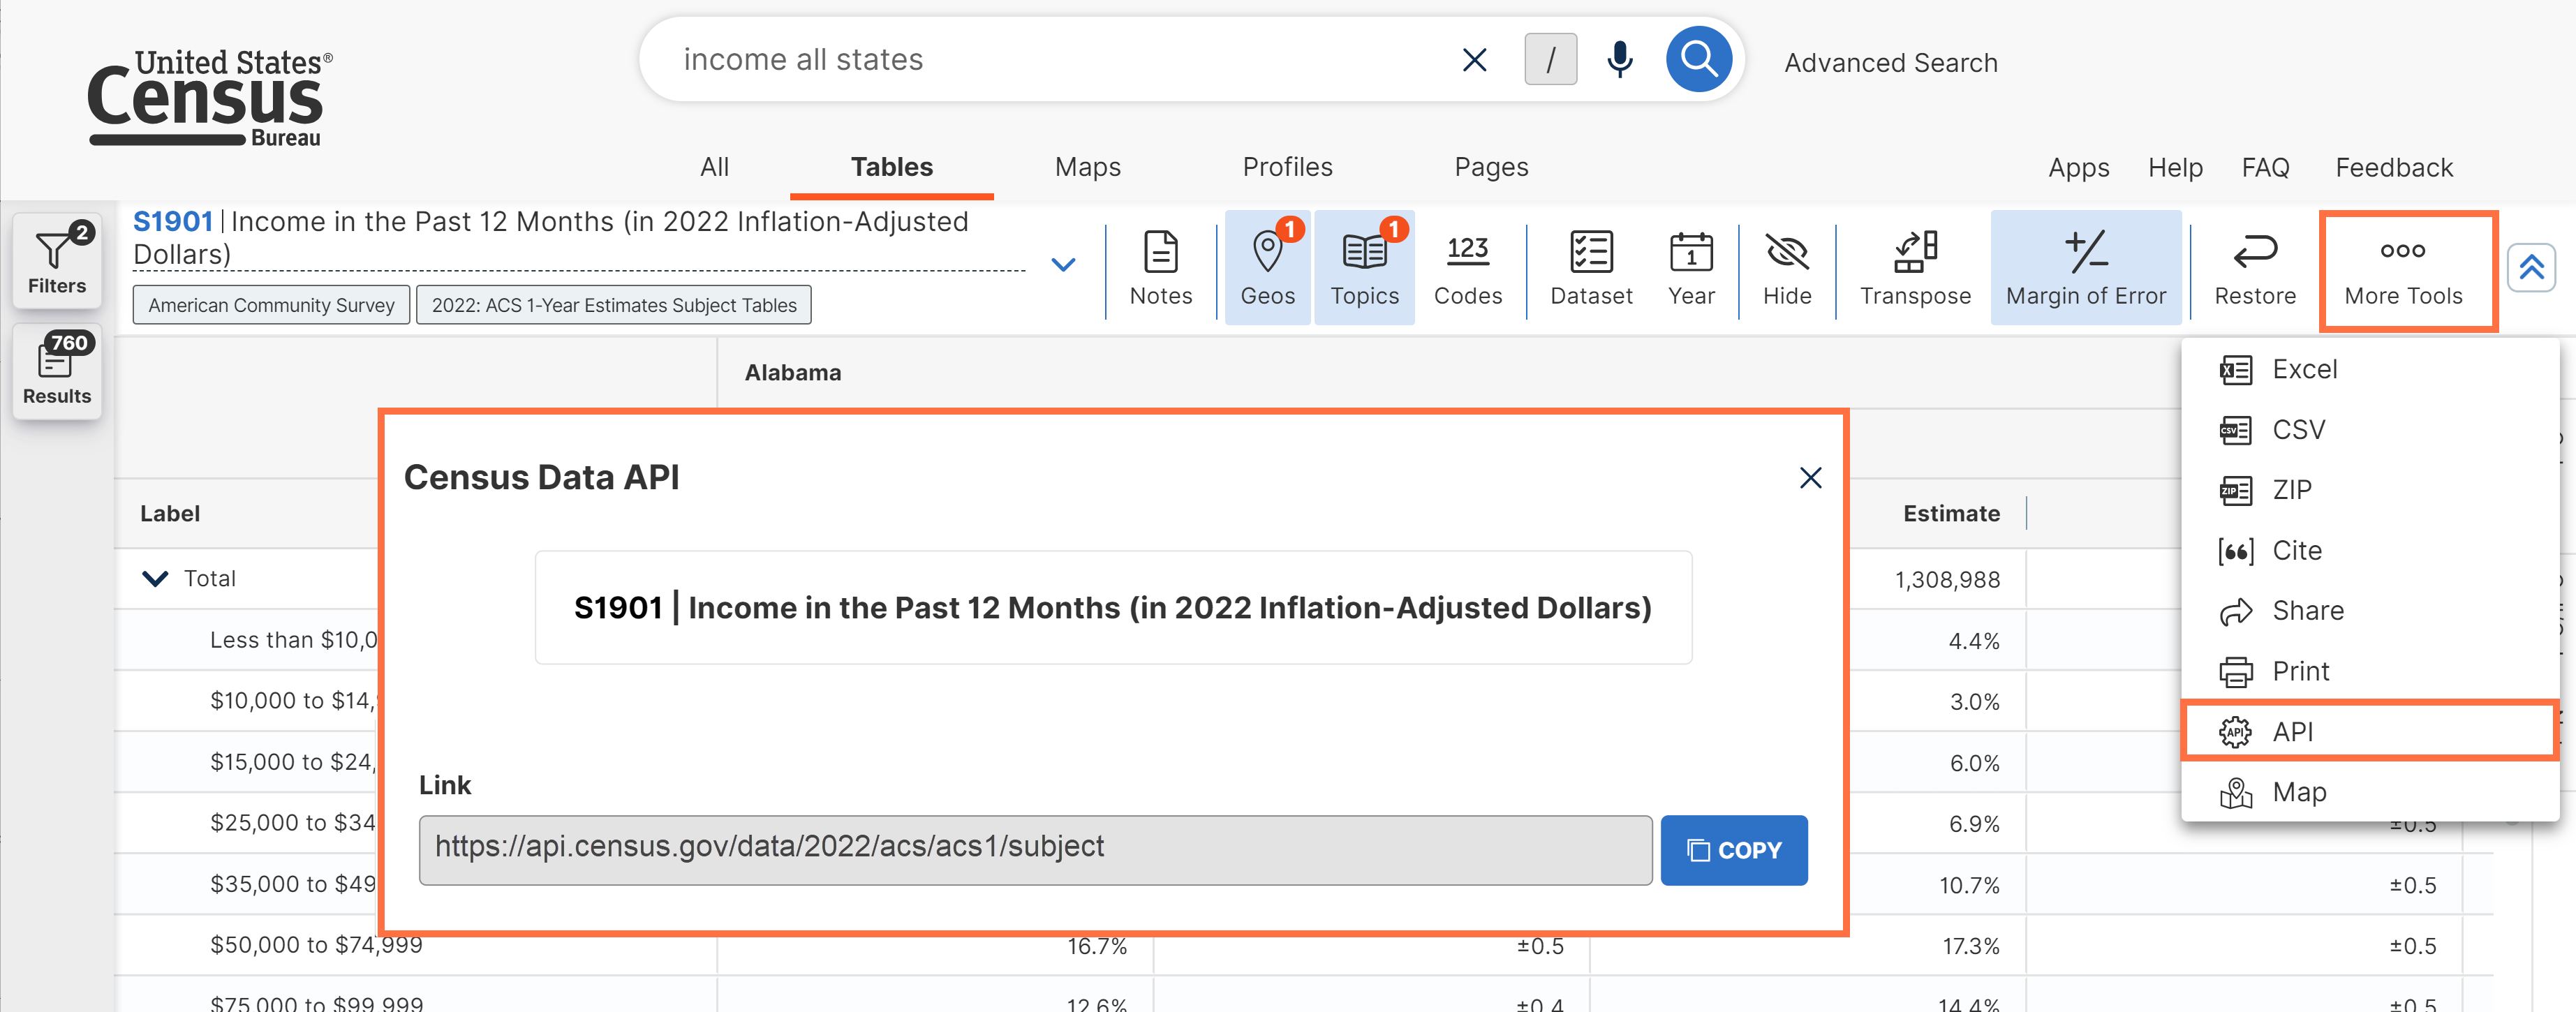
- Improved API button. After clicking the API button at the top of the table, you will now see data and metadata links in the pop-up window.
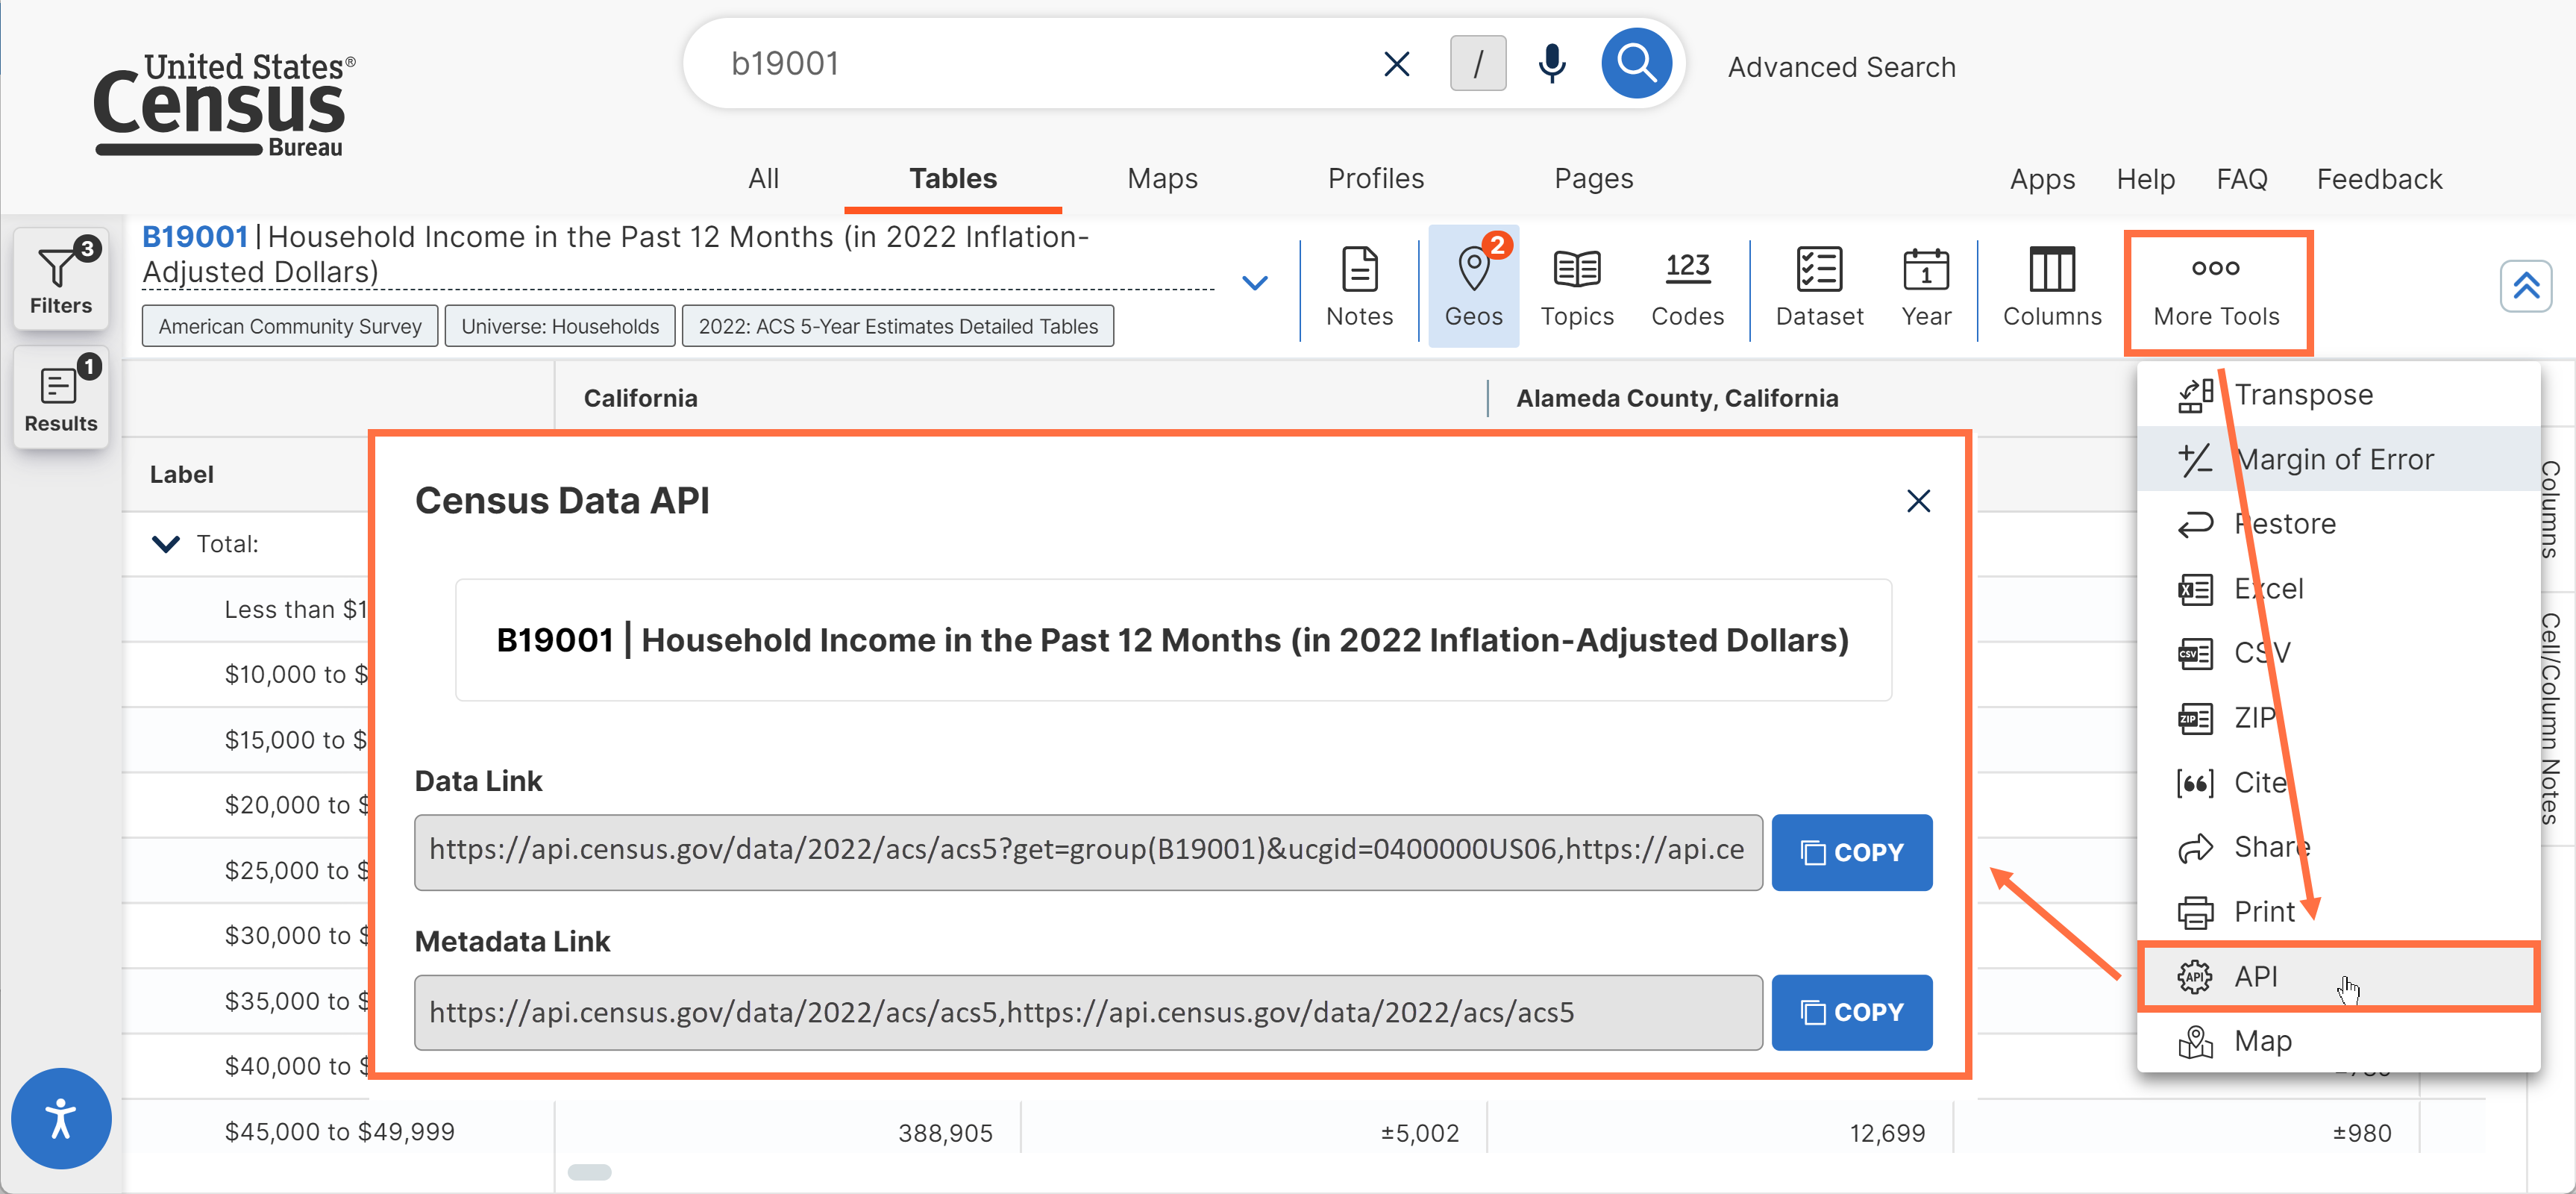
Data Link: Provides the corresponding API call to get data for your current table view.
NOTE: When viewing tables for multiple geography or code selections, you may receive multiple API queries separated by a comma. In the example below, the first query provides the table data for the state of California and the second query provides the table data for all counties in California. These must be run as separate API queries to return data.
https://api.census.gov/data/2022/acs/acs5?get=group(B19001)&ucgid=0400000US06,https://api.census.gov/data/2022/acs/acs5?get=group(B19001)&ucgid=pseudo(0400000US06$0500000)
Metadata Link: Provides the API call to the overall dataset that is relevant to your table. This provides reference material such as lists of variables, geographies, and tables for the dataset.
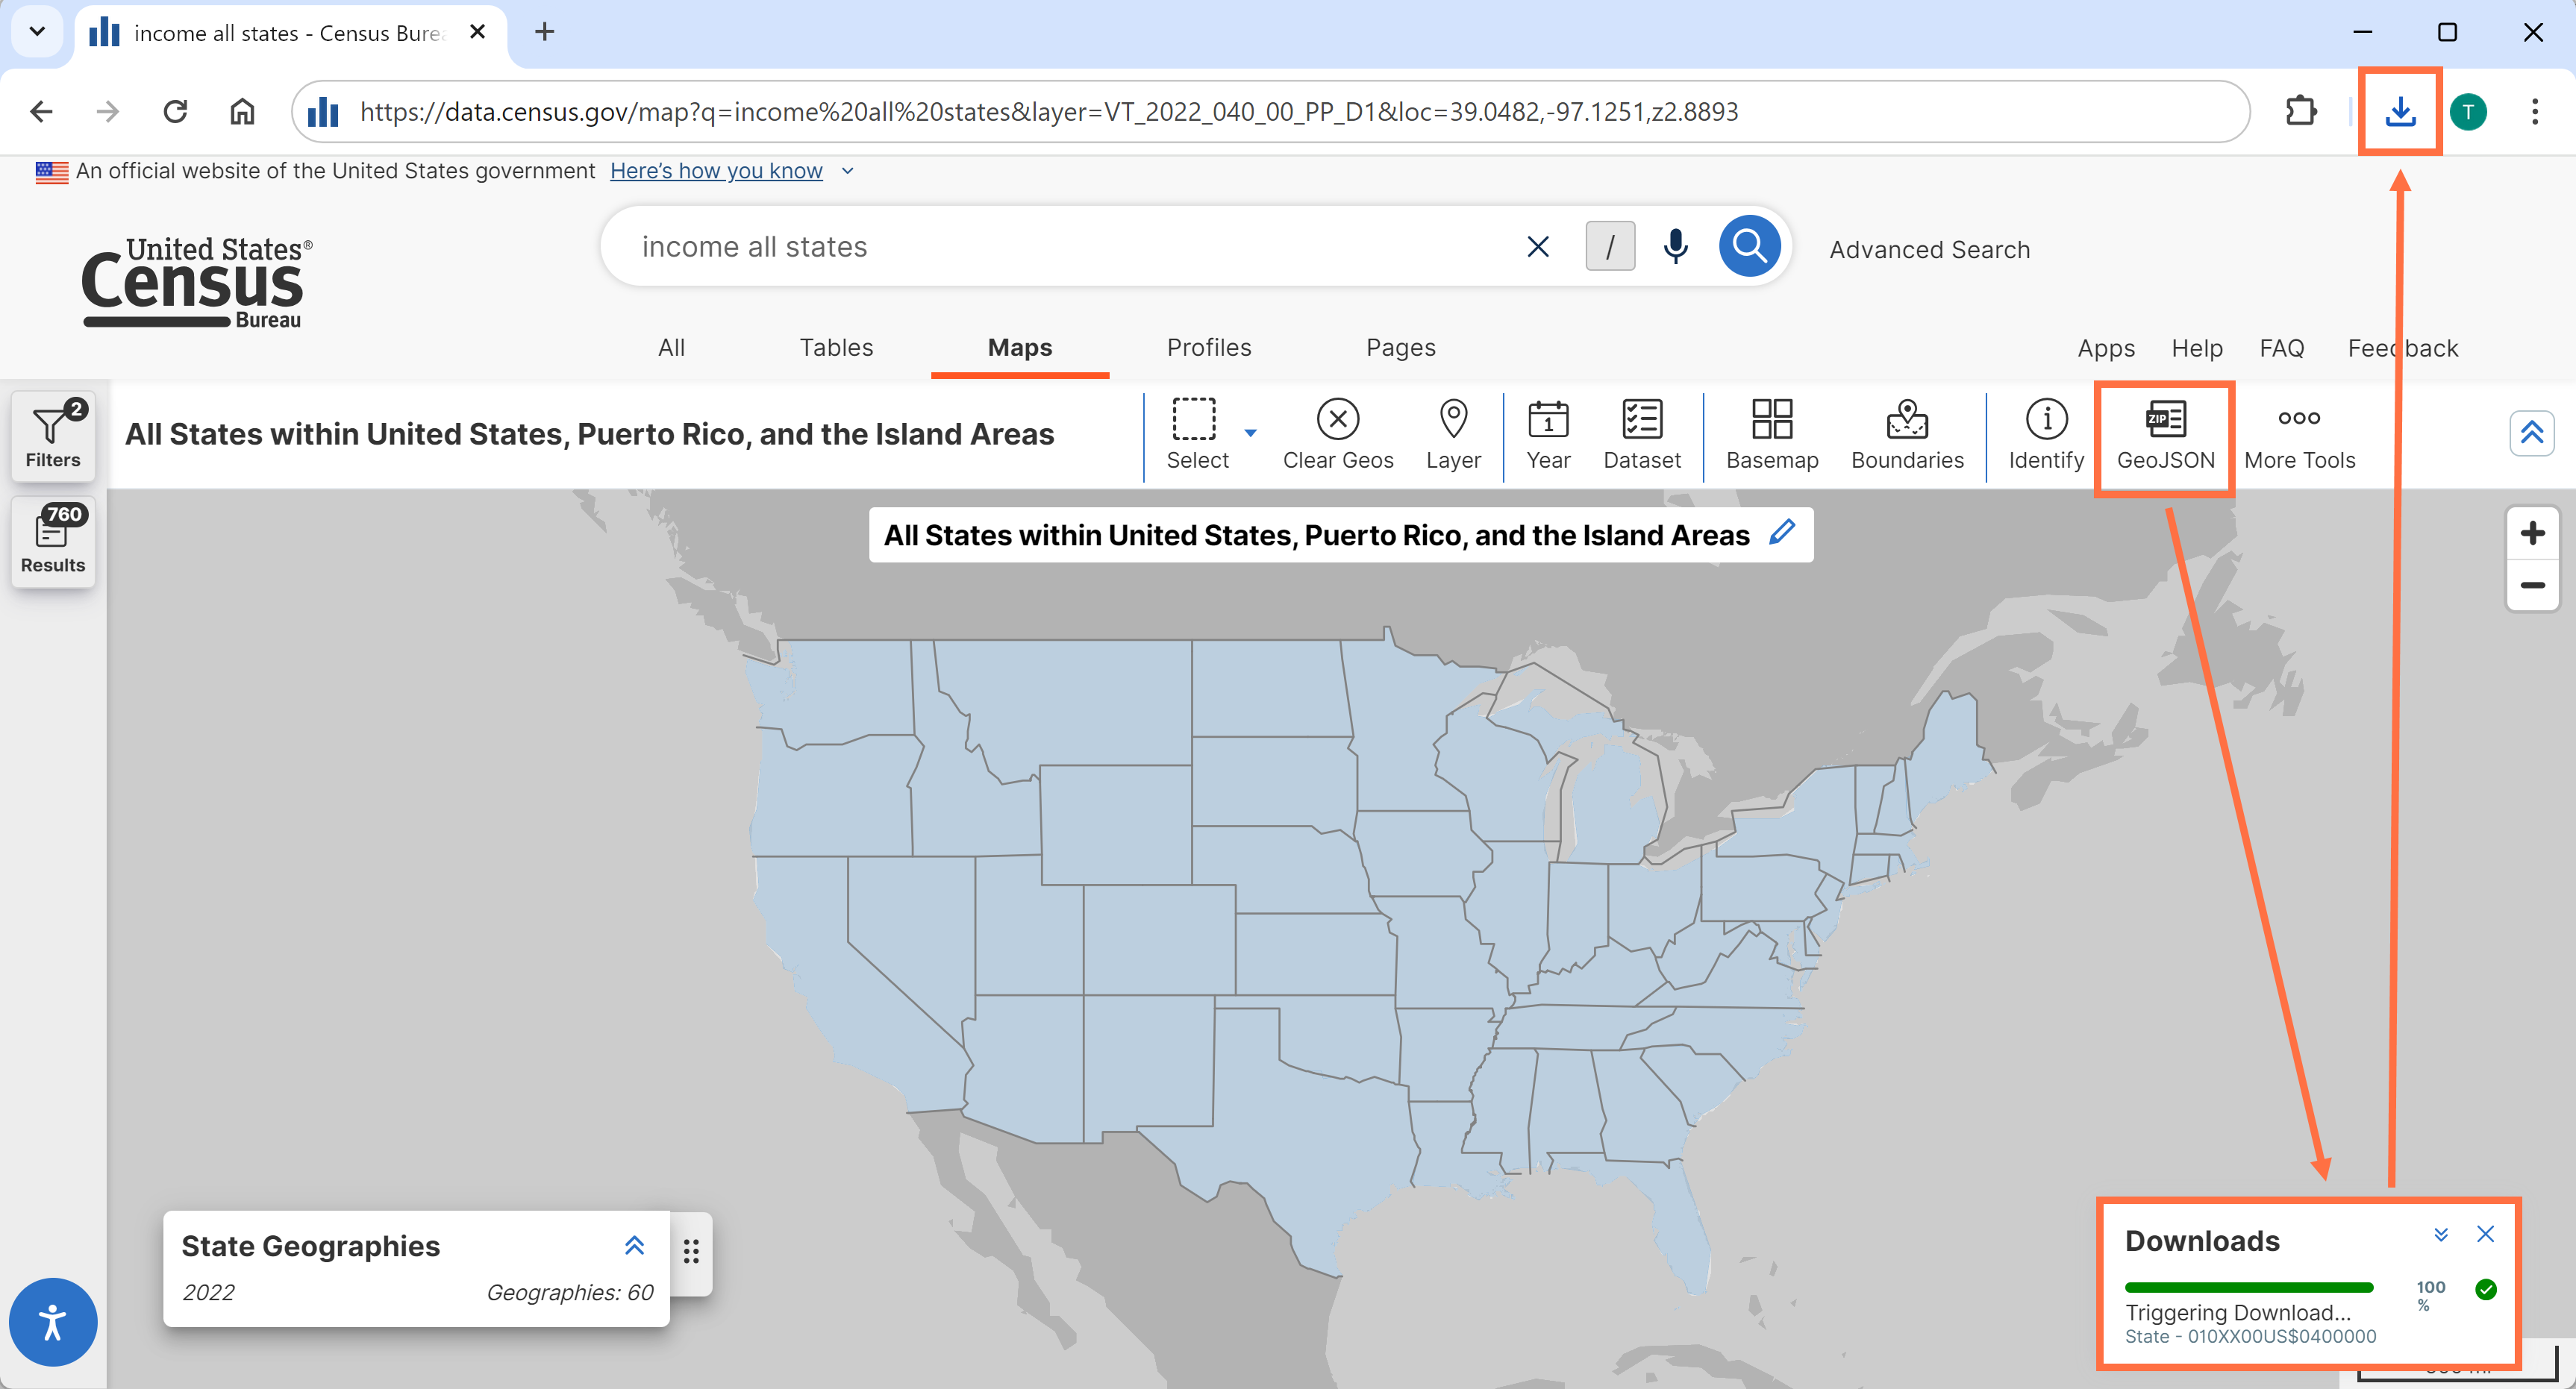
- New GeoJSON button. When you click the button at the top of the map, it will start a ZIP file download of the currently visible map boundaries in GeoJSON format. These boundary files can be used to create custom maps using your own software.
The process of downloading the GeoJSON file is the same as downloading other ZIP files:
o Click the GeoJSON button to start the download
o Wait for the progress bar to load to 100%
o Open the ZIP file in your downloaded files
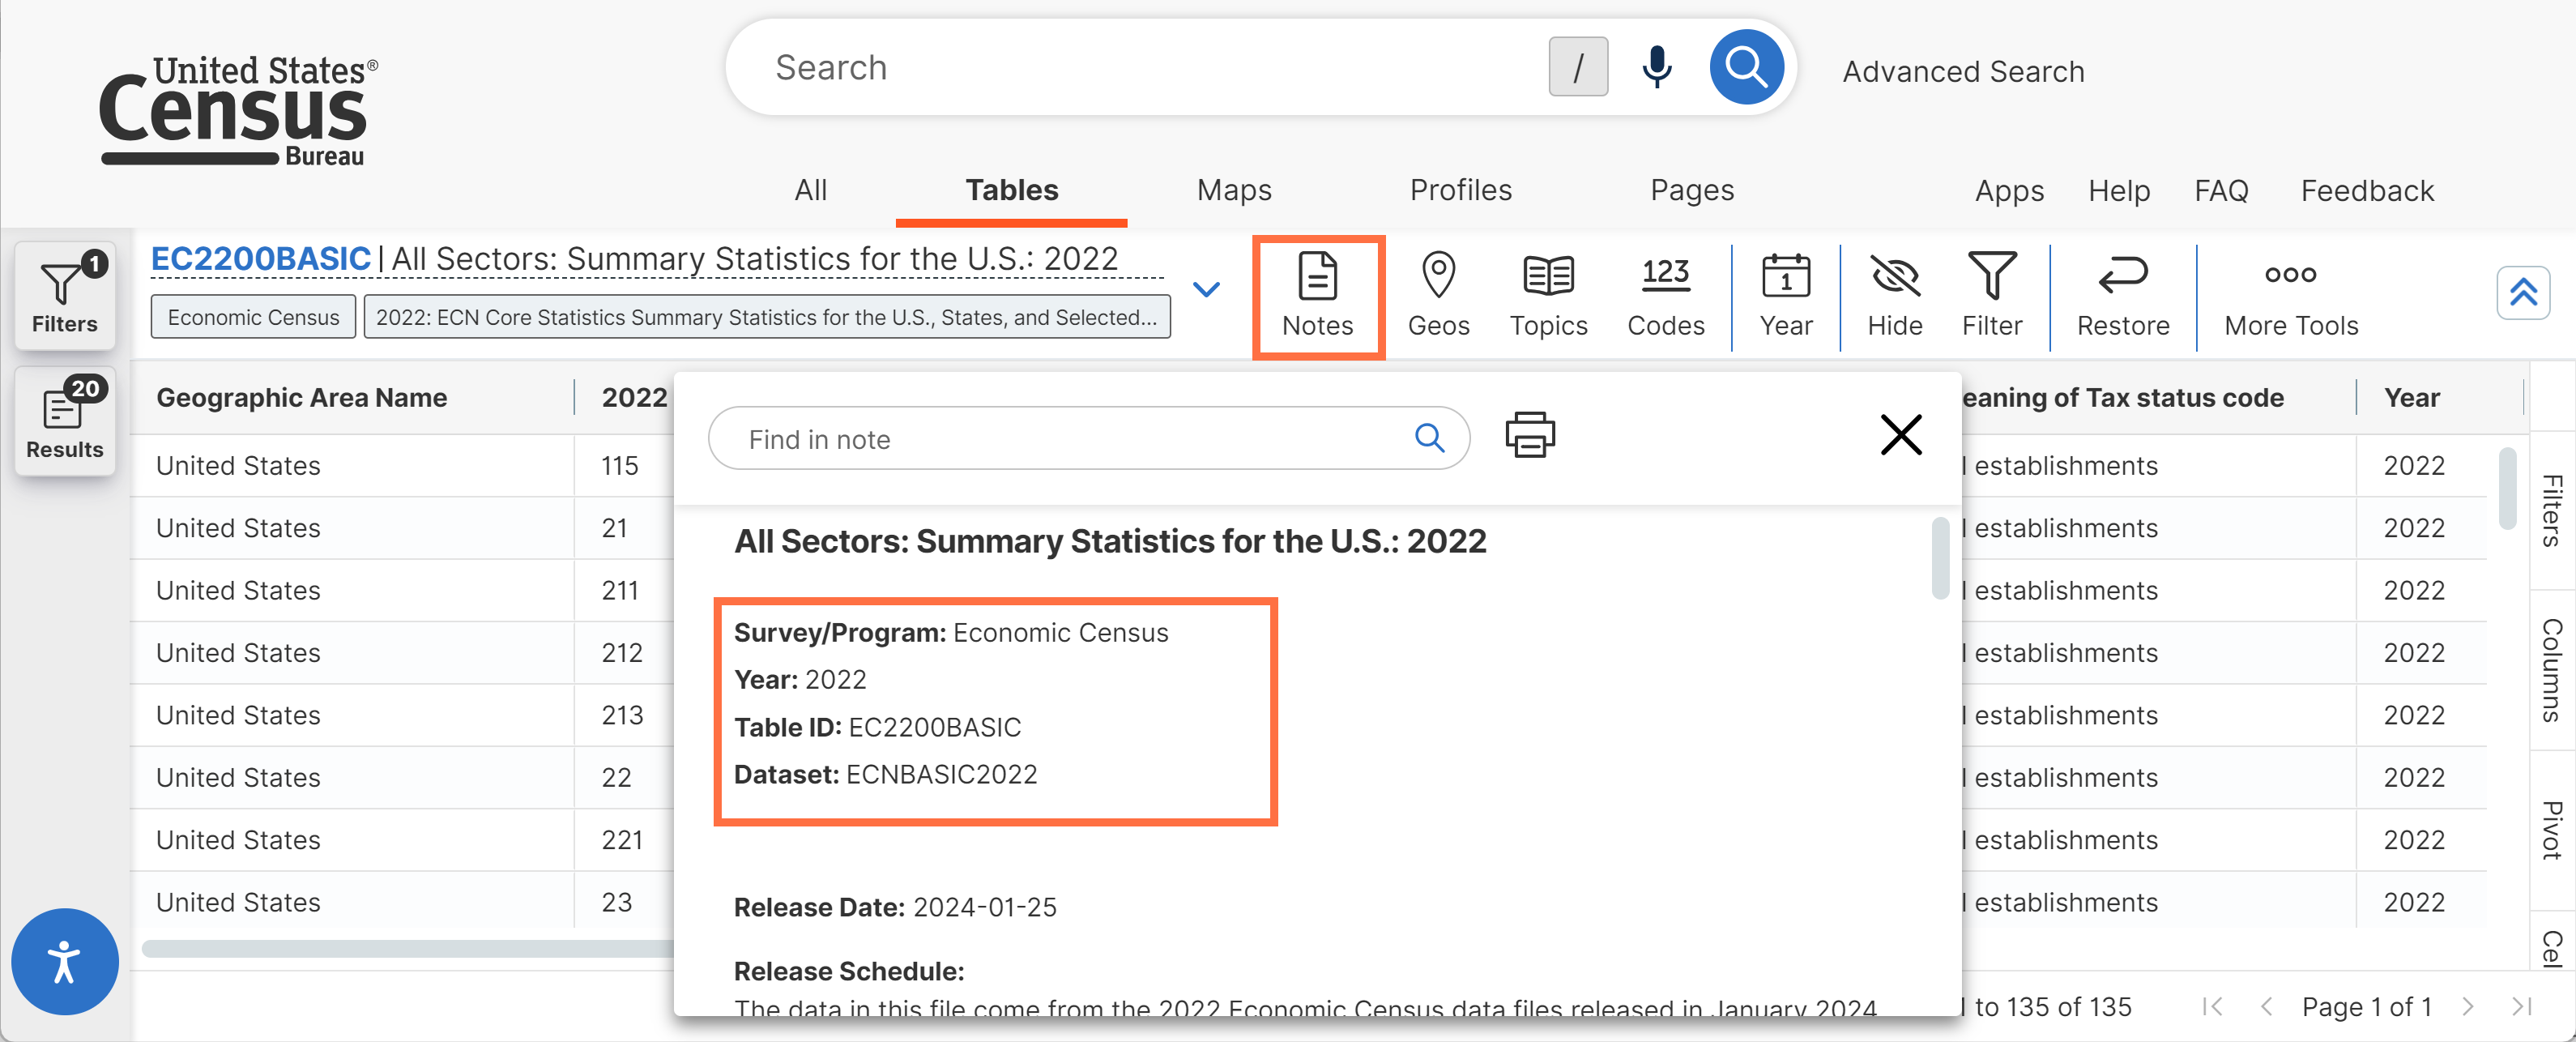
- Fixes to ensure that the survey/program, name, year, and dataset appear correctly after clicking the Notes button.
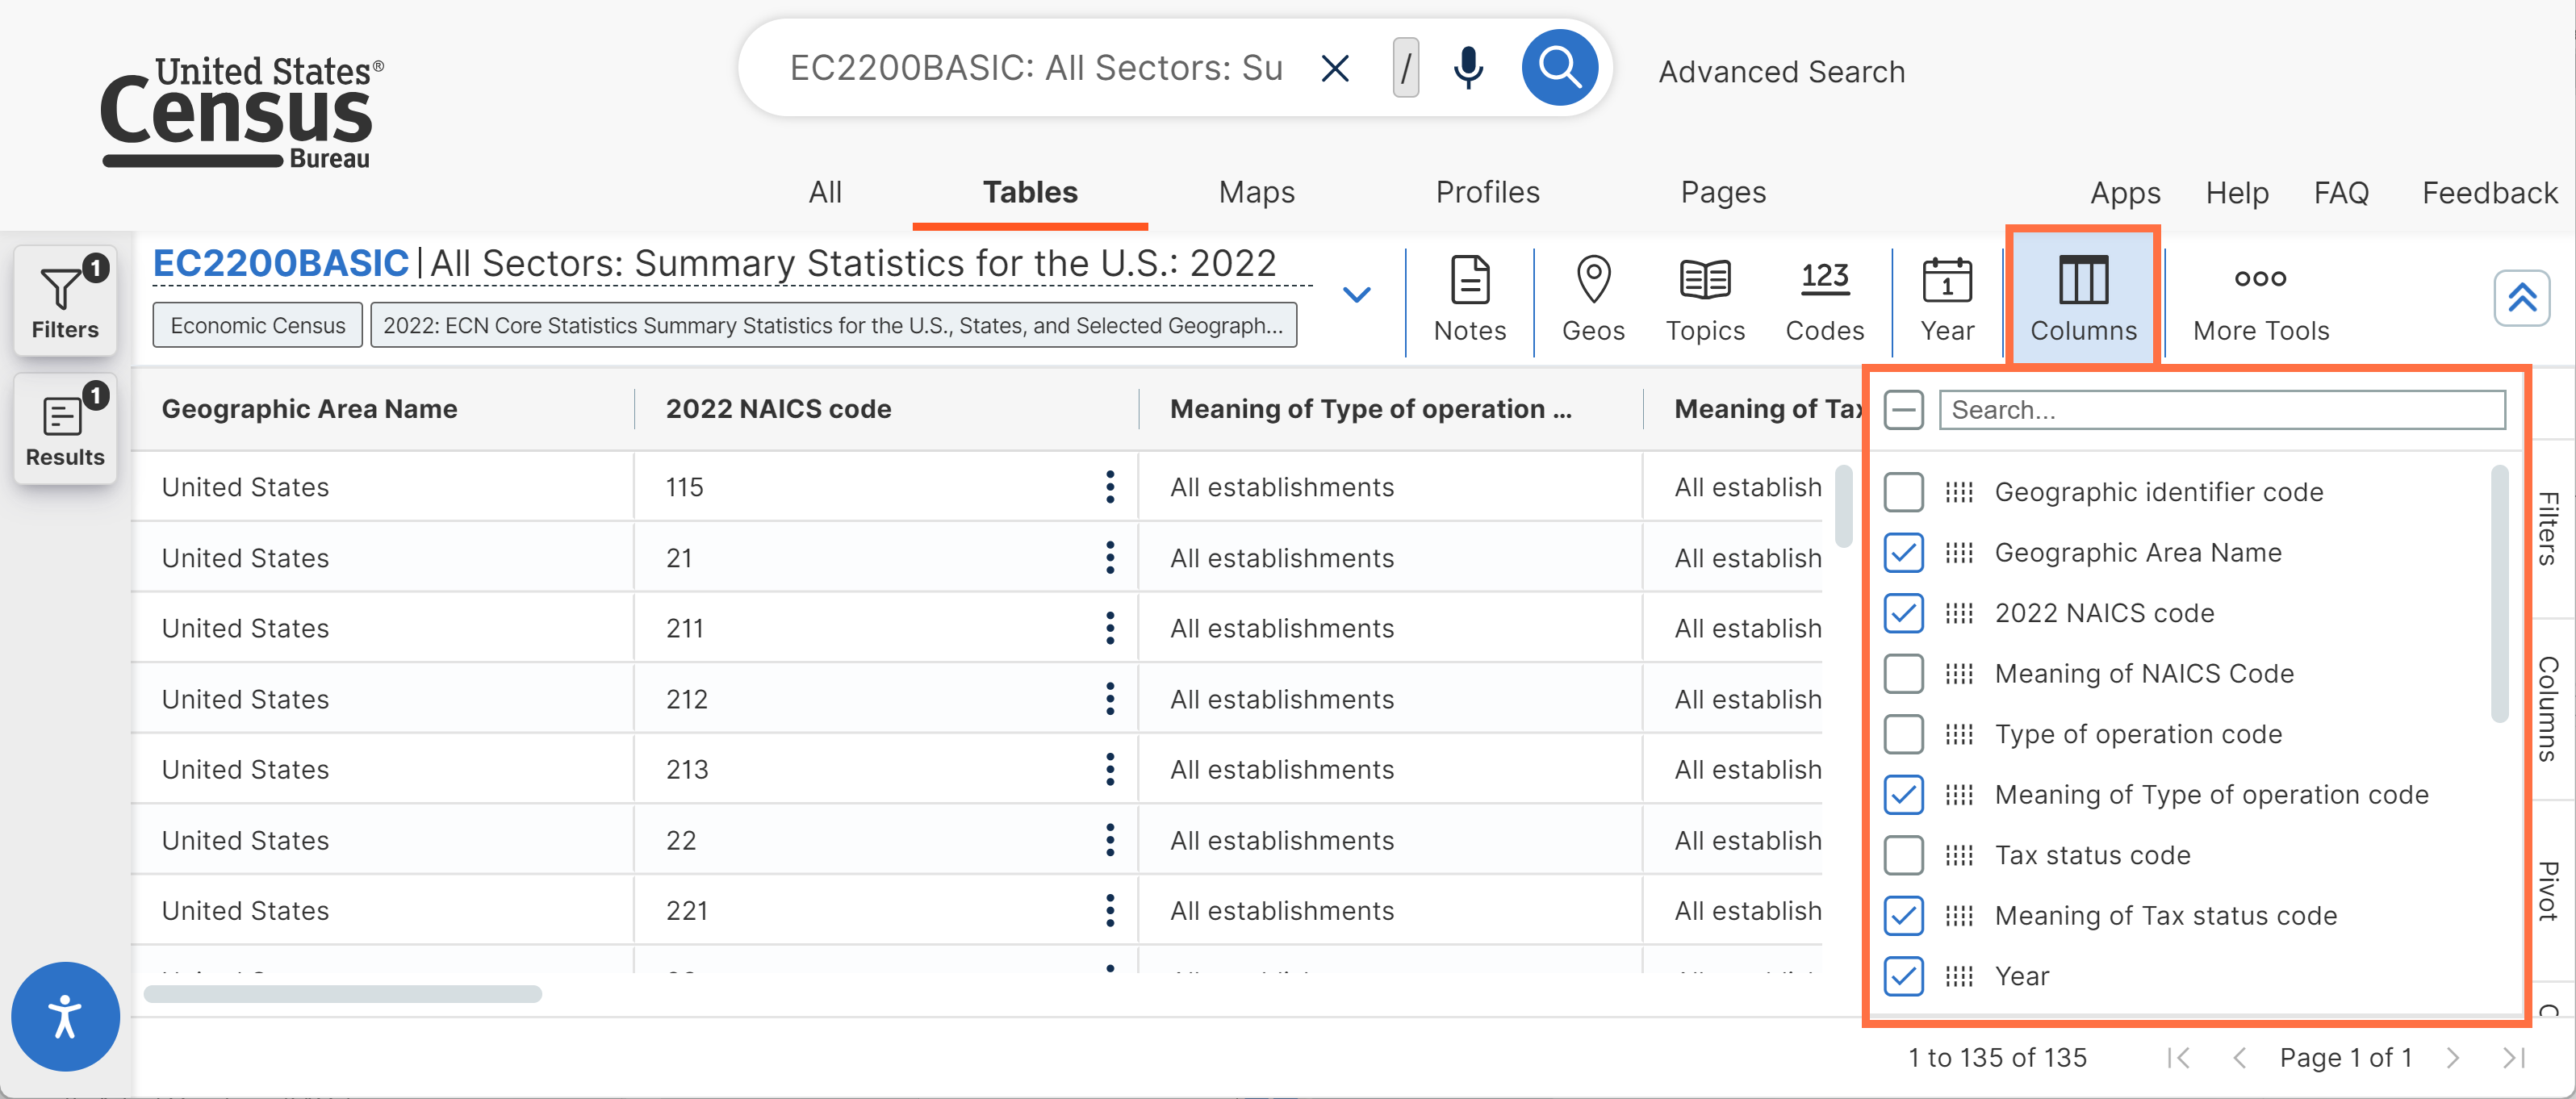
- Renamed button to adjust table columns. The previous “Hide” button is now called “Columns” to clarify that you can use the button to hide or show columns in the table.
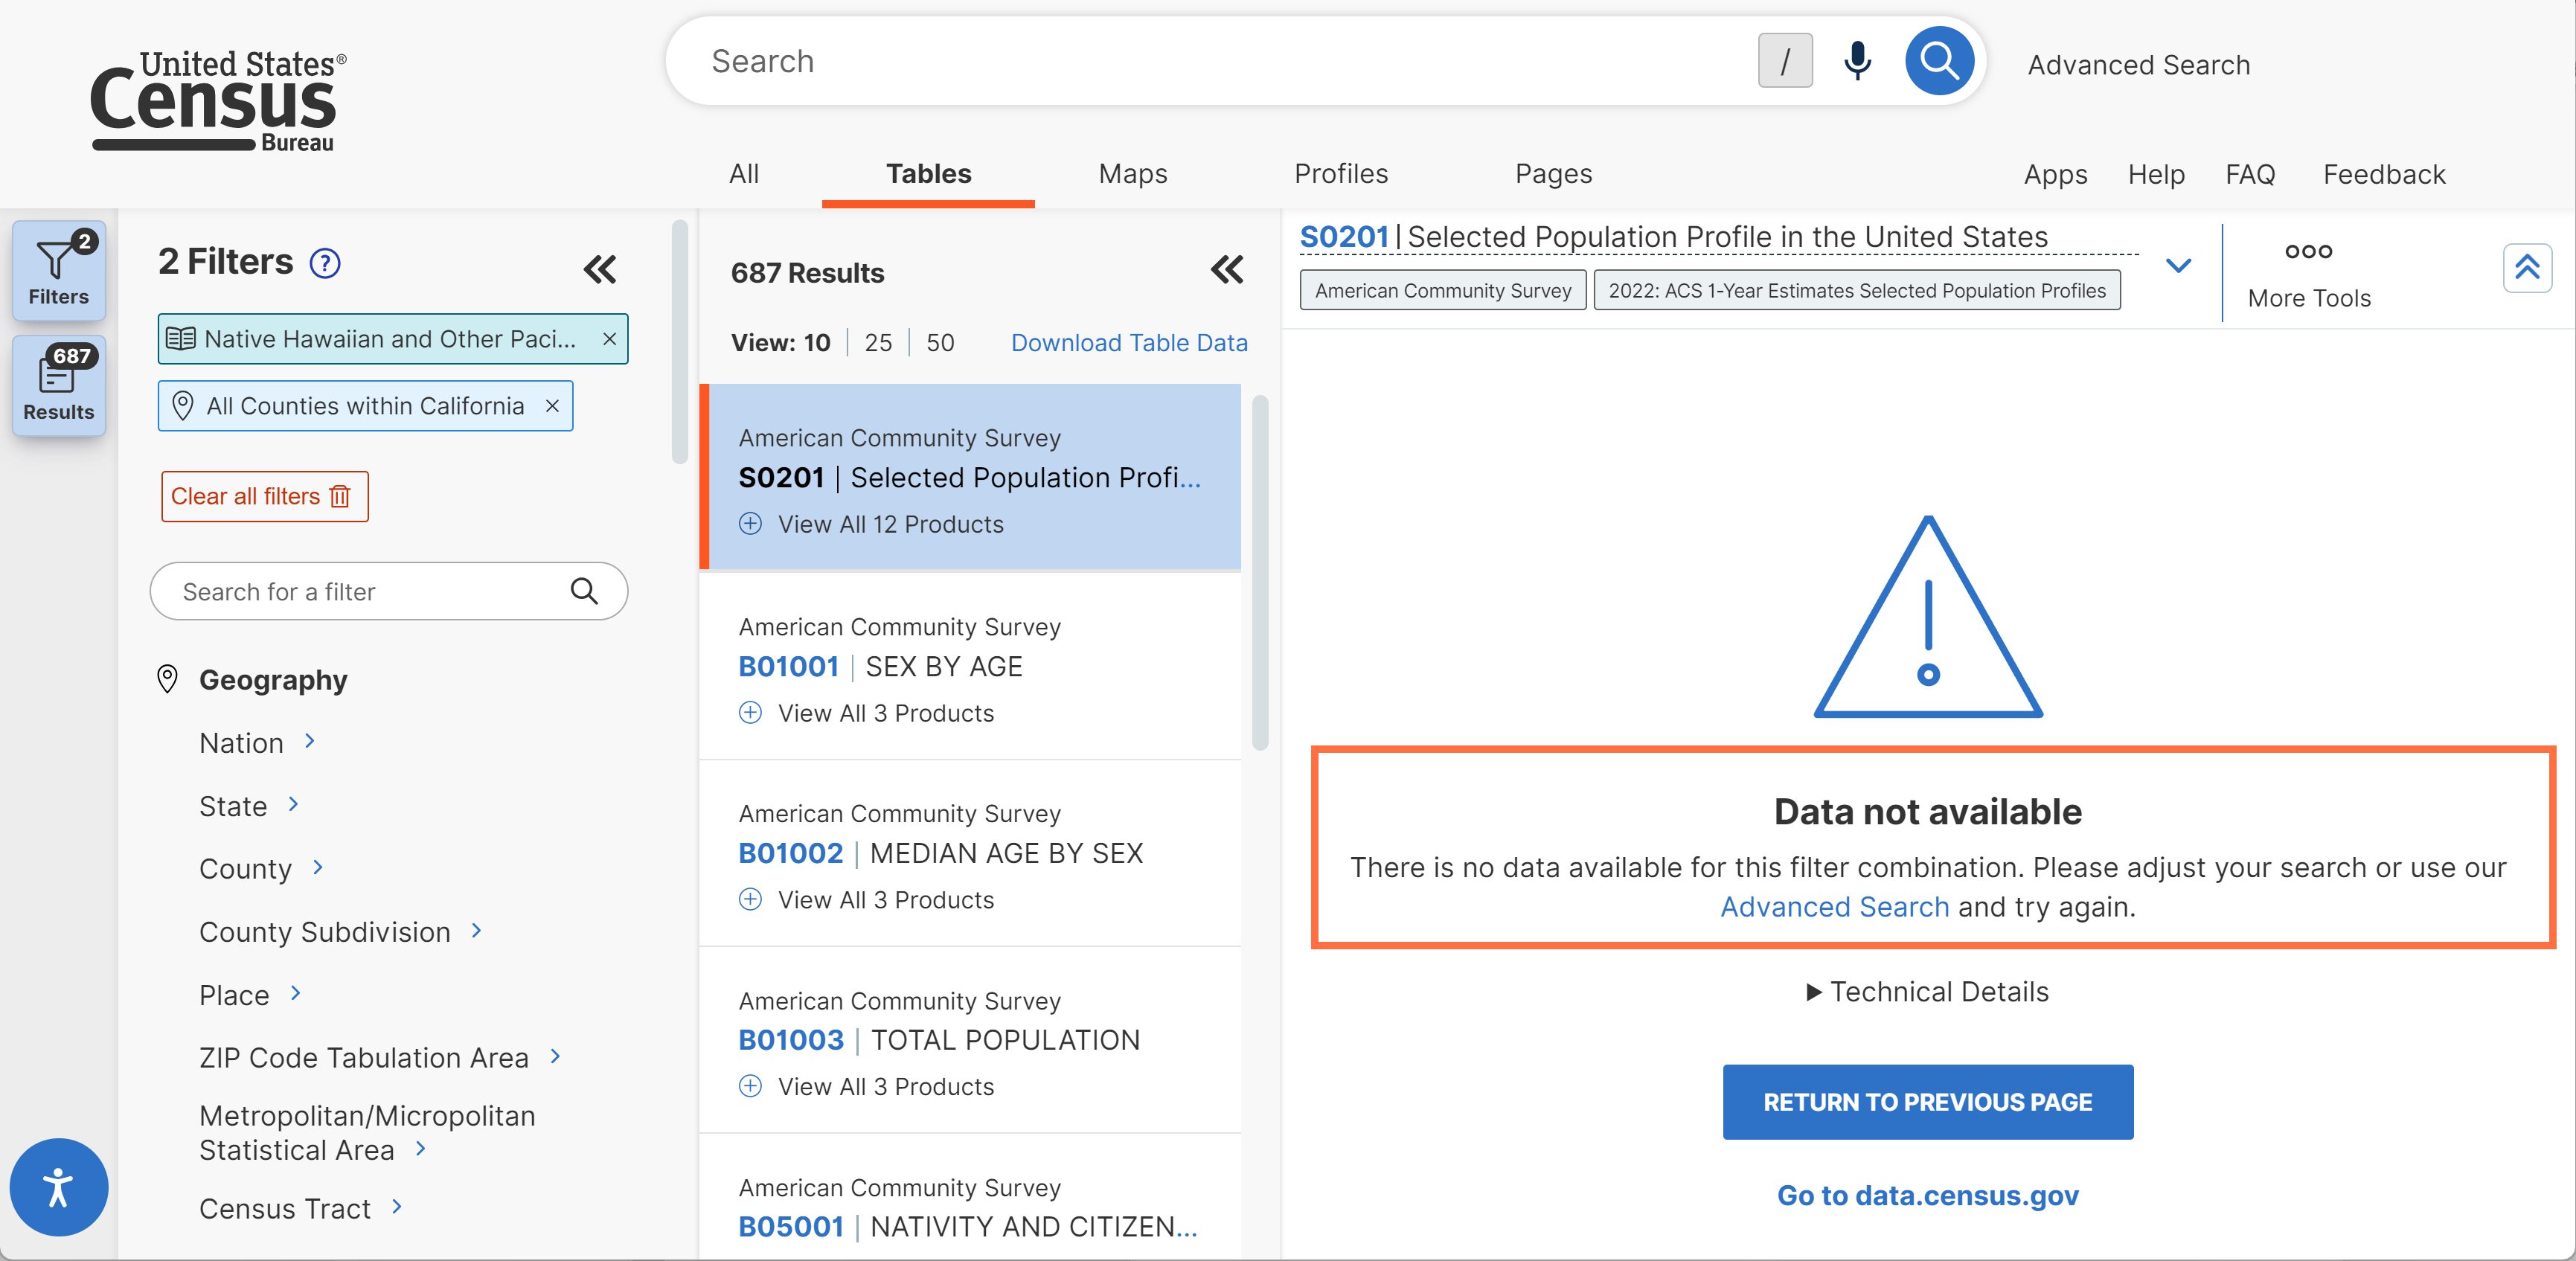
- Improved table messaging:
- Improved “Data Not Available” message. The message now includes clearer text that reads “There is no data available for this filter combination.”
- Text wrapping applied to technical details of error messages, allowing you to view the full message more easily.”
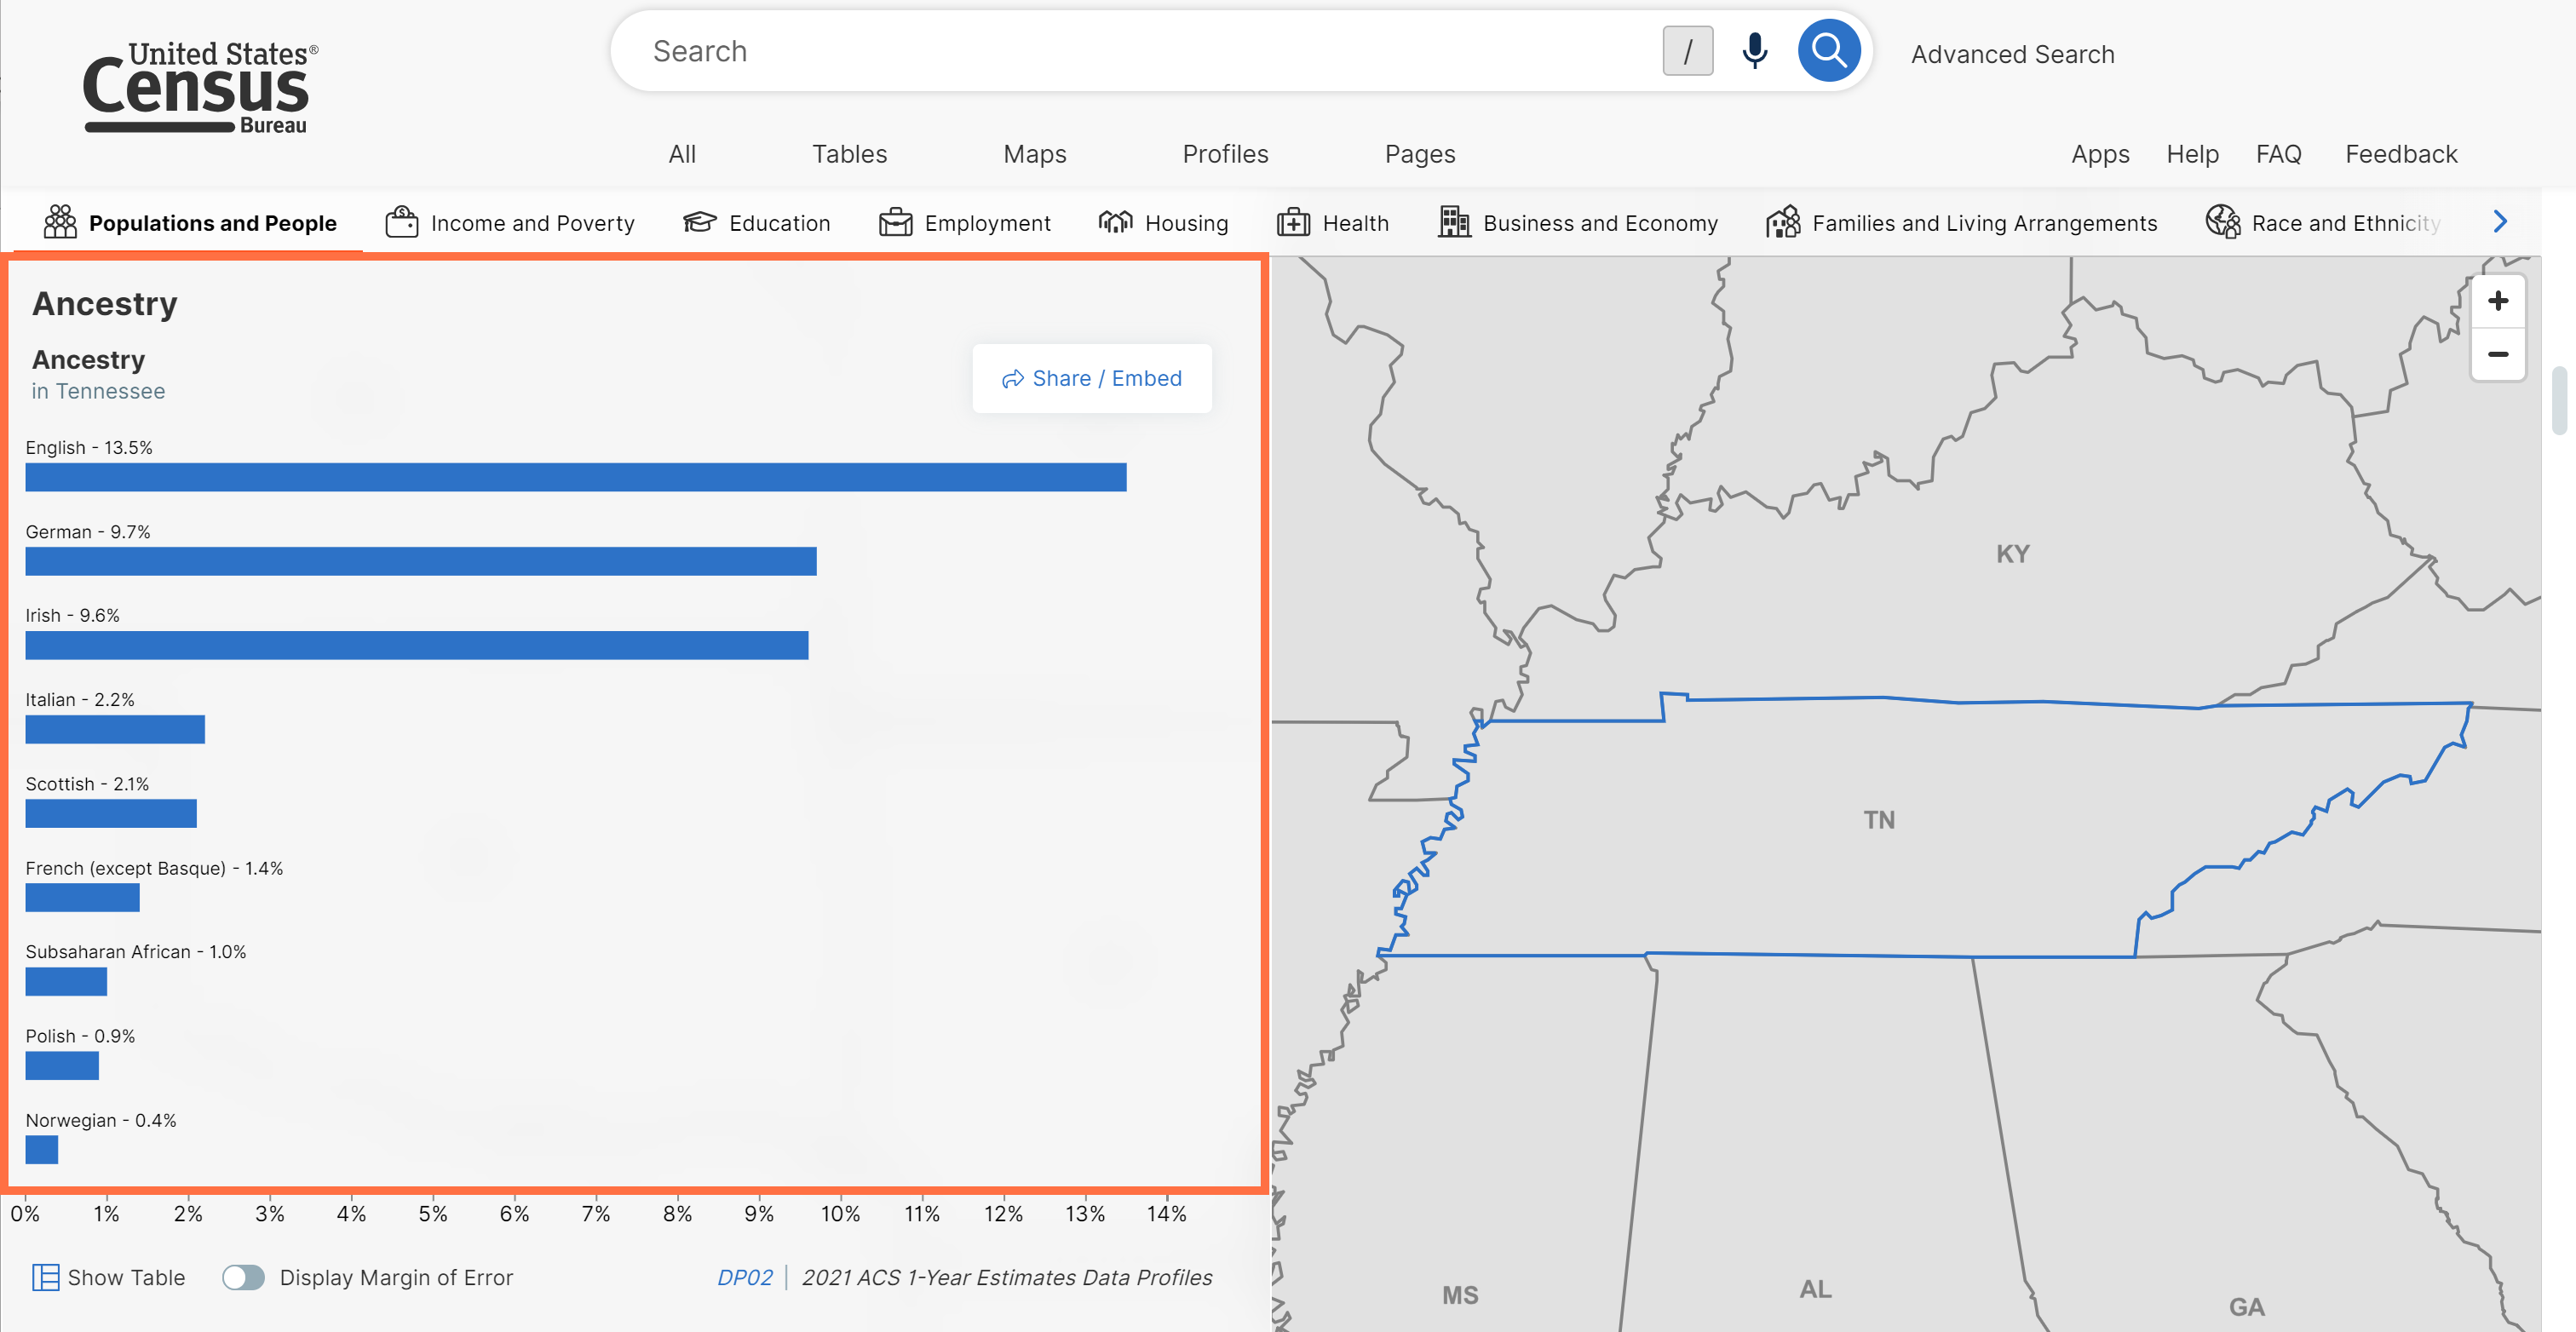
- Improvements to the Ancestry bar charts in the Geography Profiles. The ancestries are now sorted in descending order, so the most popular ancestries appear at the top of the list.
- Behind-the-scenes work to support the display of margins of error in the map table view in future releases.
- Technical work to improve the Microdata Access Tool (MDAT) in future releases.
- Fixes to 14 defects, including fixes that allow you to:
- Use the interactive map in the Geography Profiles to change the race and ethnicity.
- Maintain your selection map view when interacting with map toolbar controls.
On April 9, we released the following updates to the site:
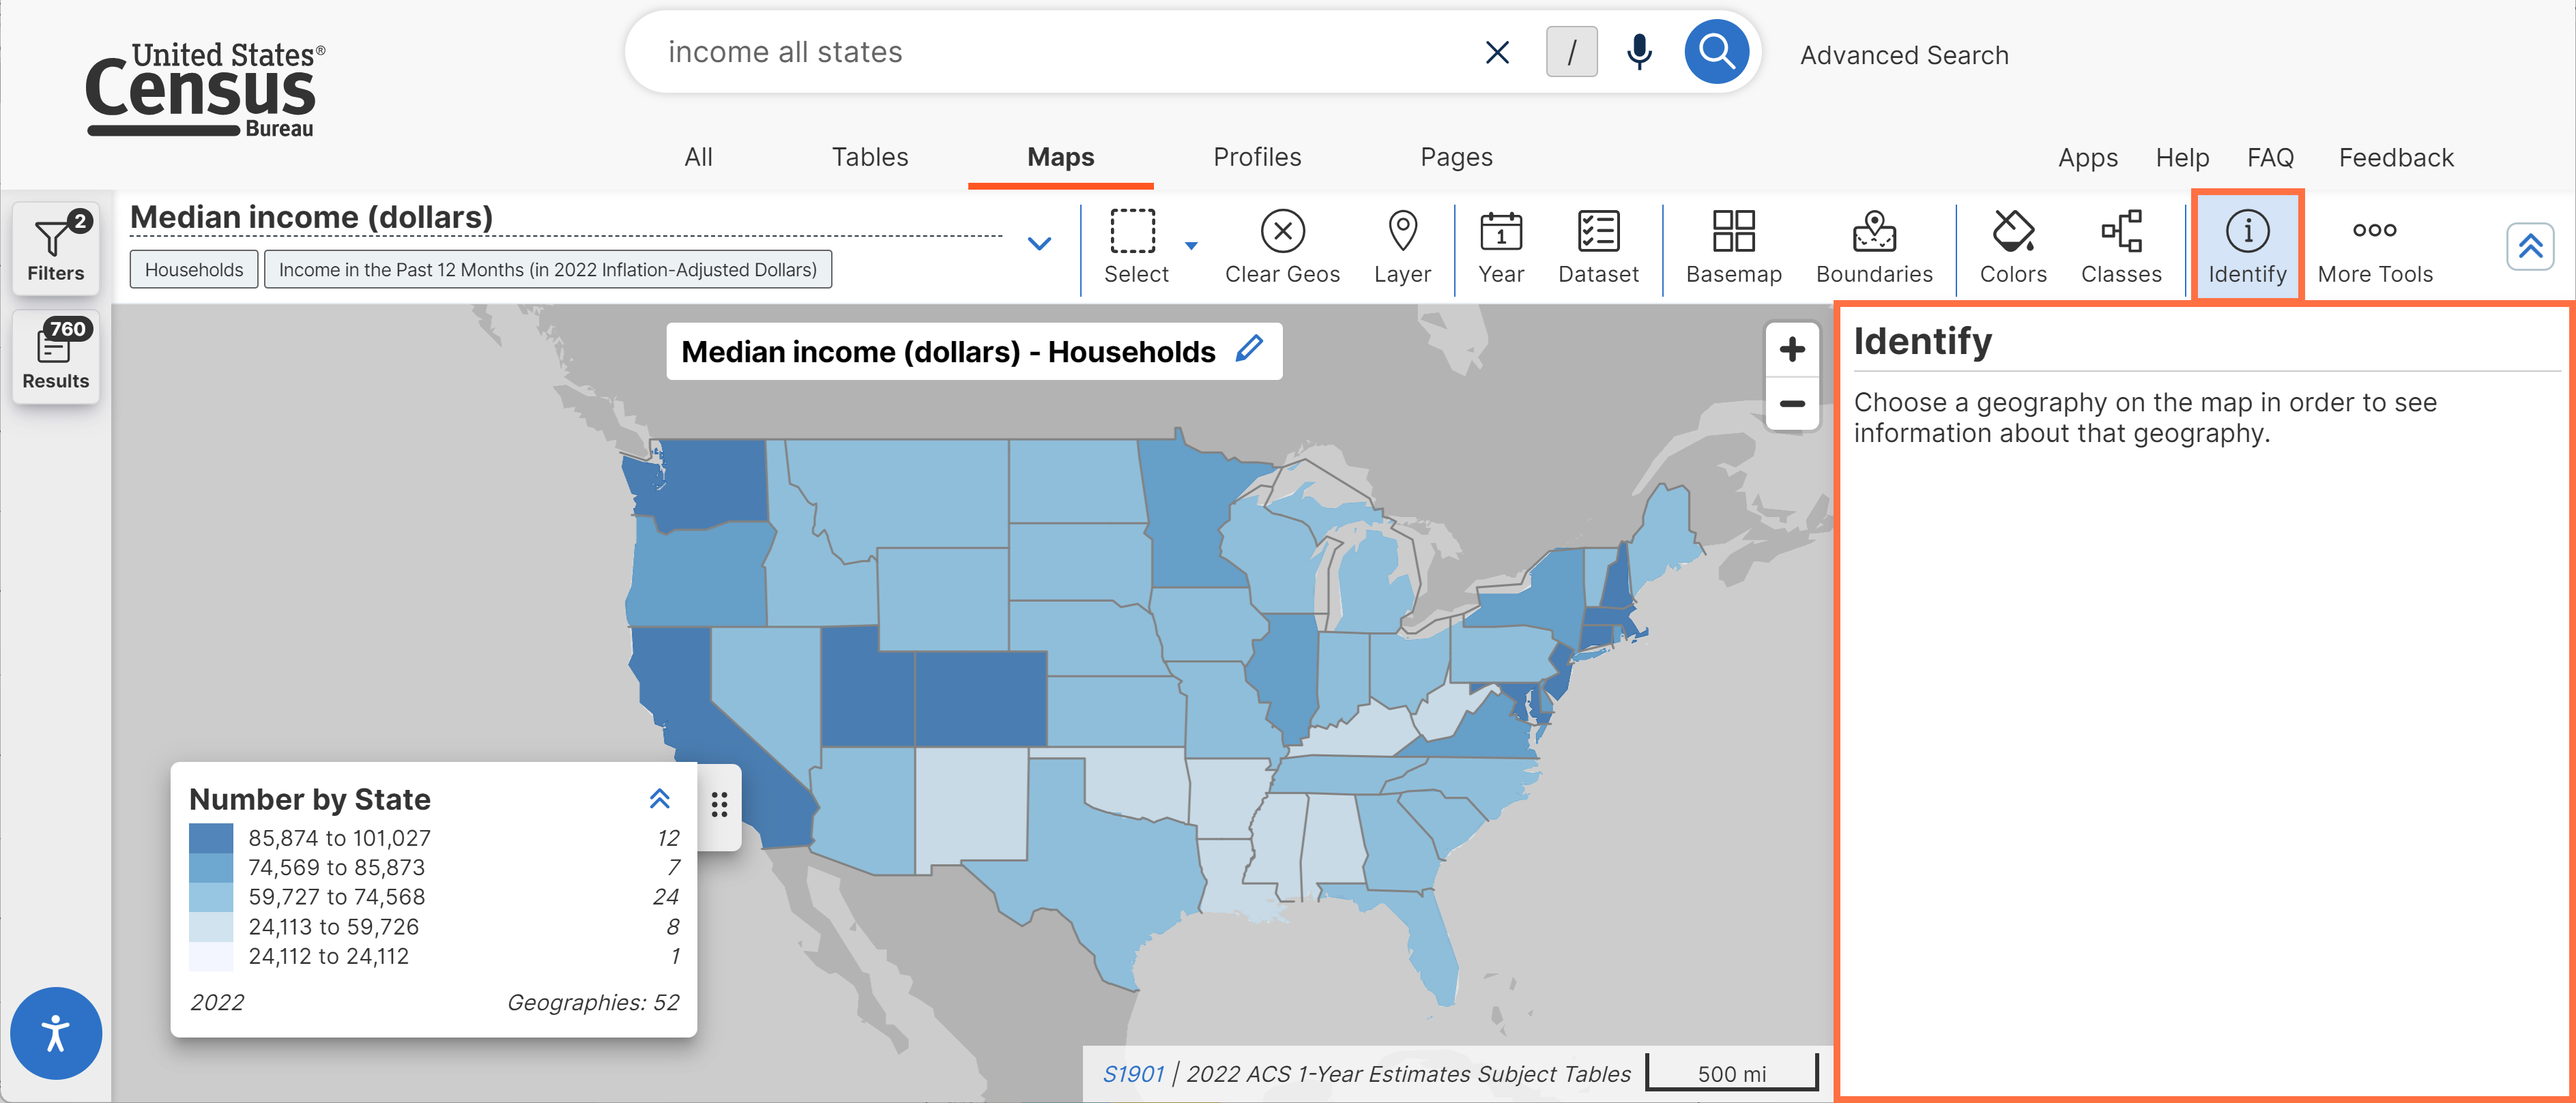
- Enhancements to the navigation and instructions for the Identify feature on the map. When you click the Identify button, a panel will now appear on the right side of the map with instructions prompting you for the next action to take.
- New API button in the table ribbon. This option provides the corresponding API query for the dataset related to the table you are currently viewing.
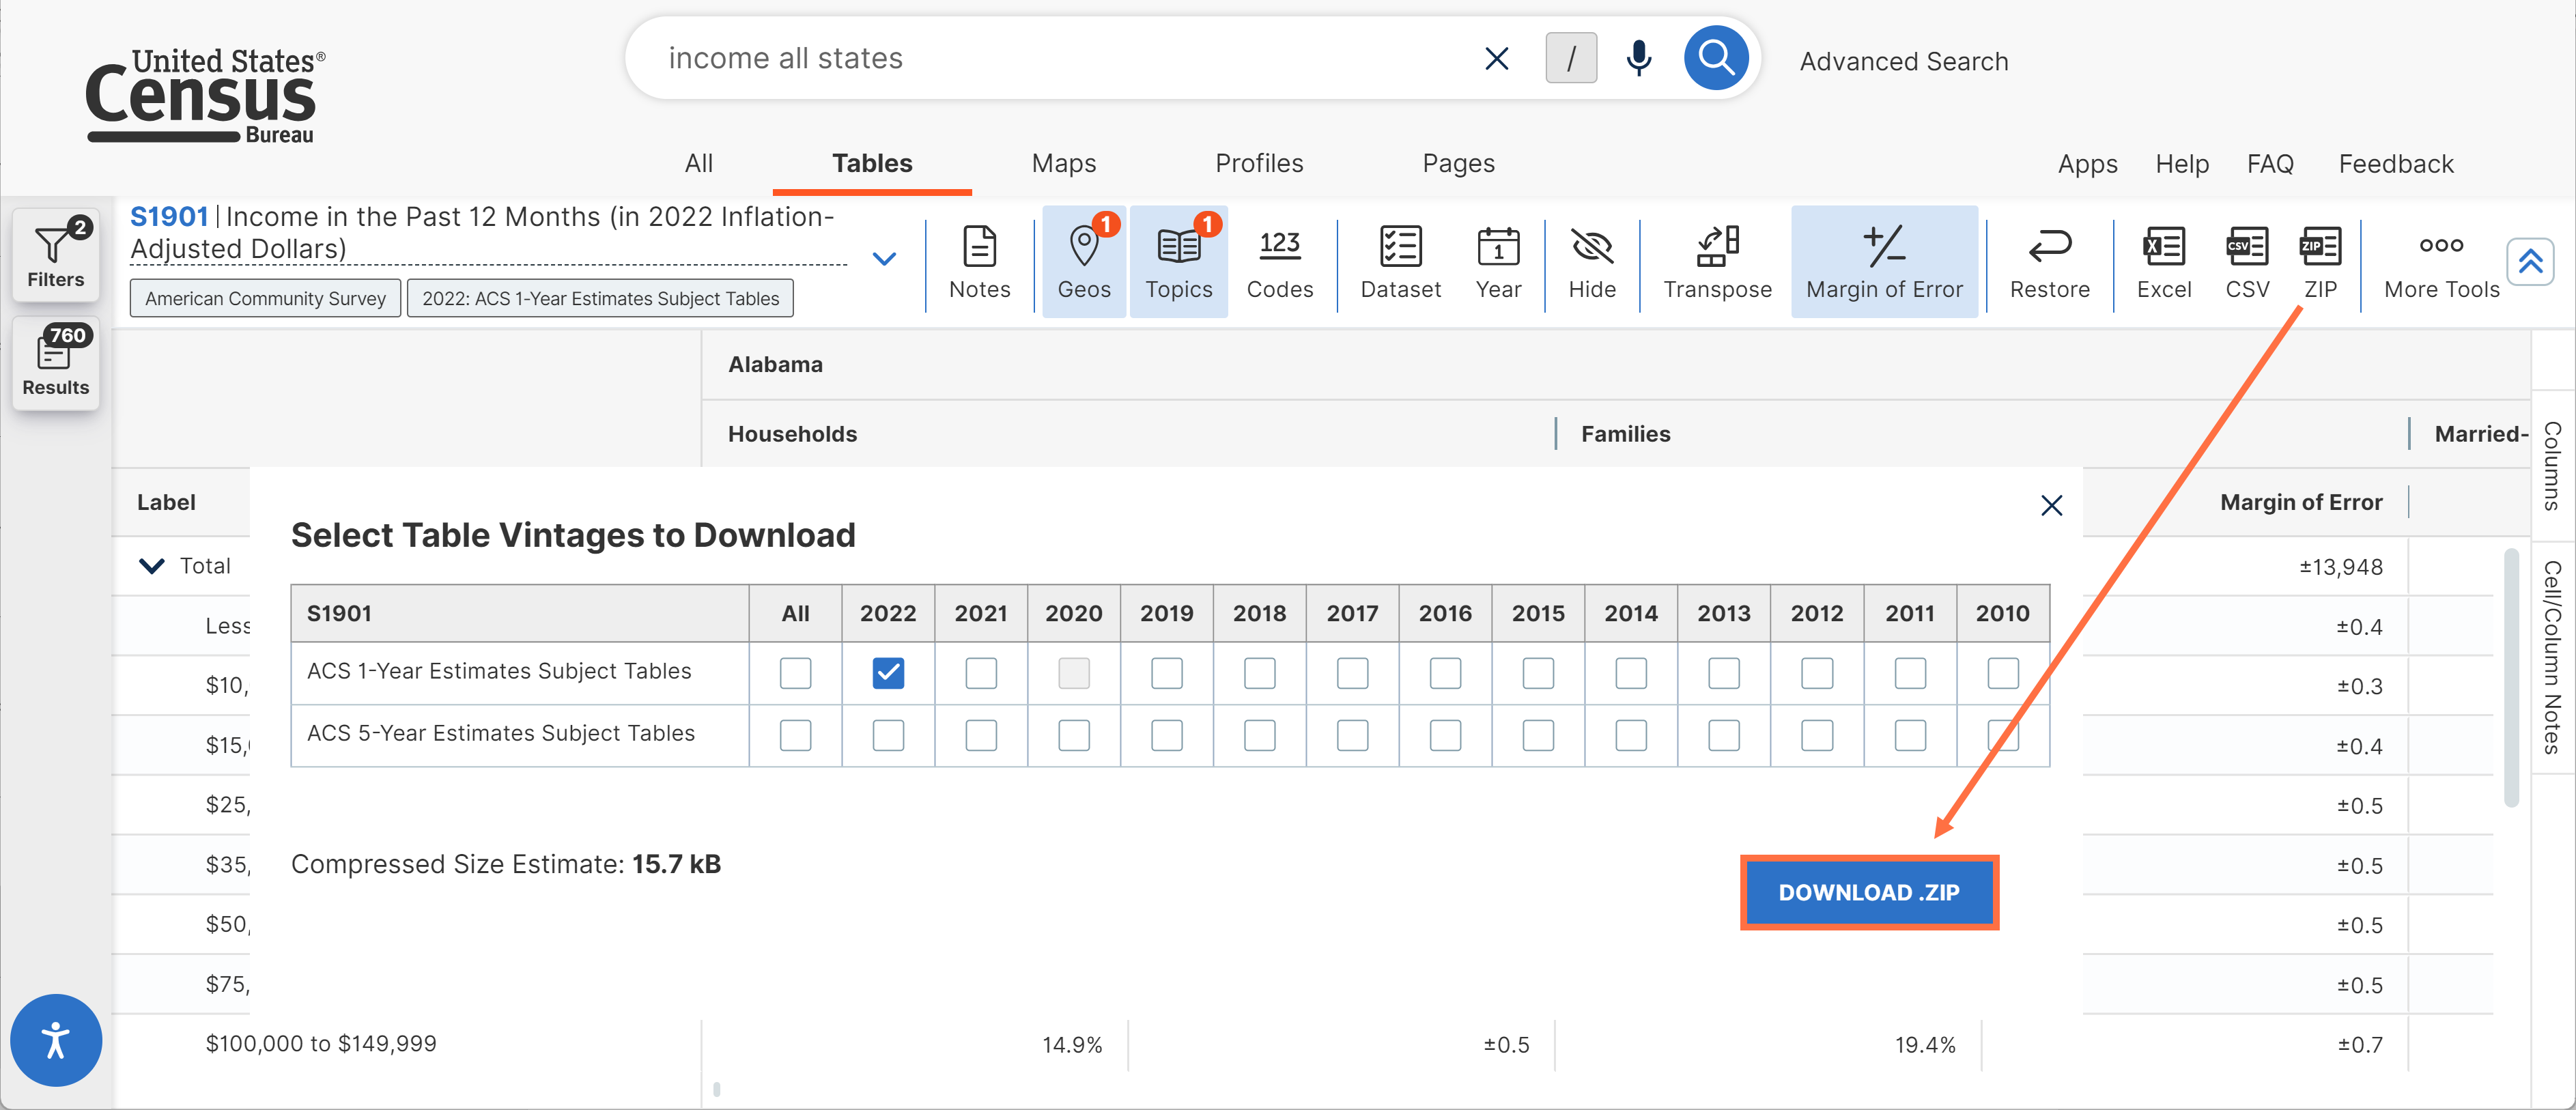
- Updated language for ZIP downloads. With this update, the pop-up window indicates that downloads are in a ZIP file format.
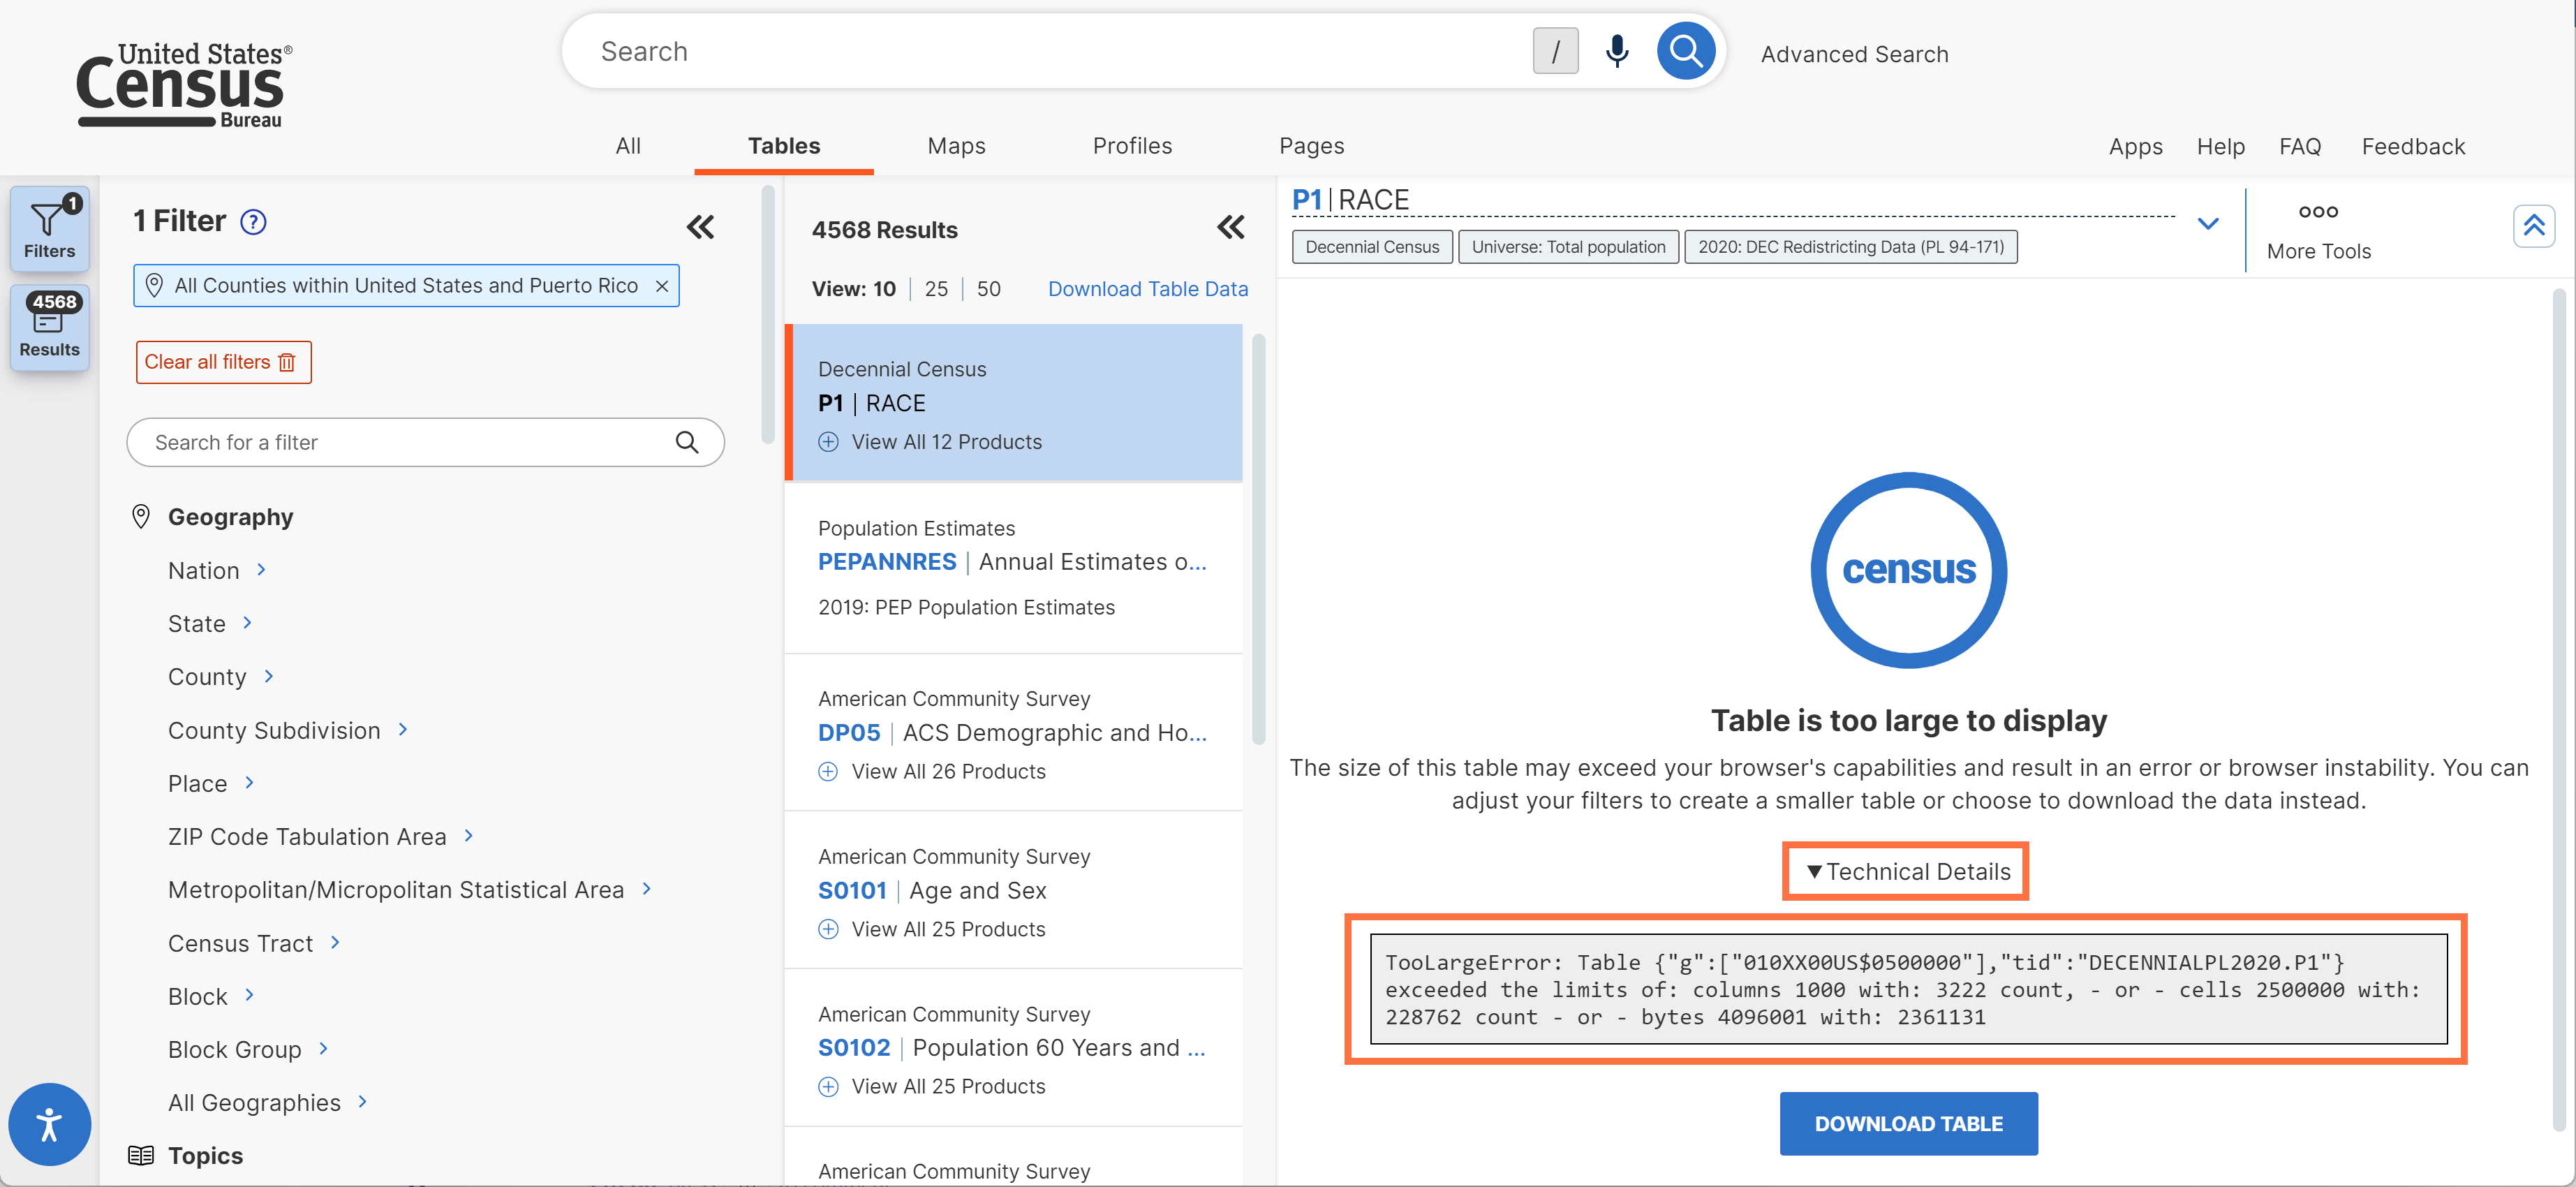
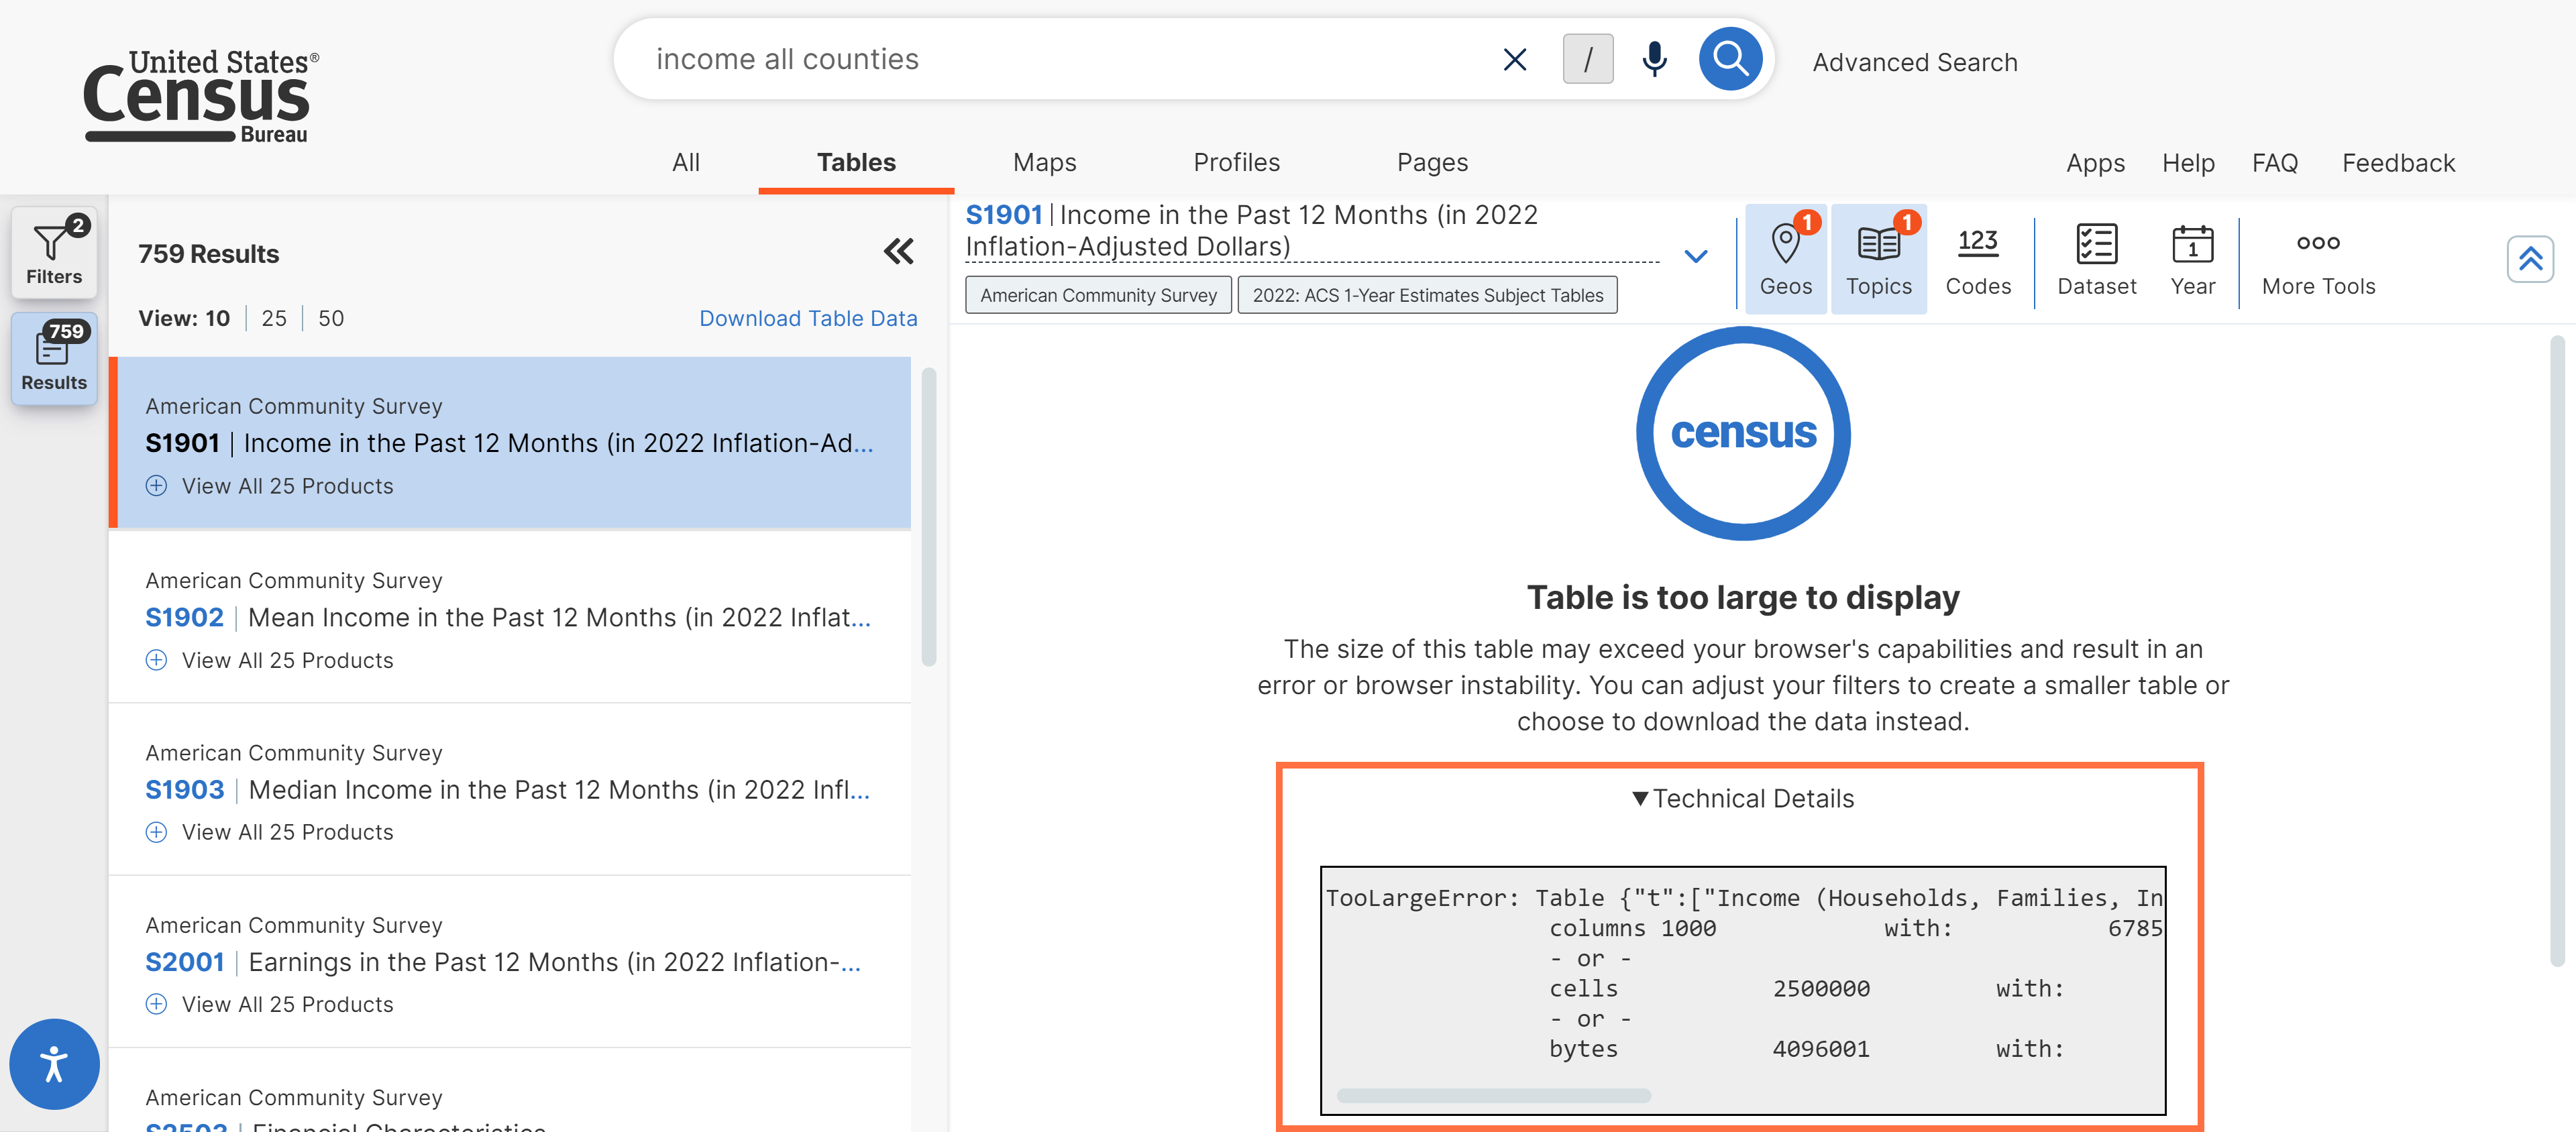
- Technical details added to table messages. These expandable messages allow you to view more details explaining why a table does not display. For example, the below message shows that the table is too large to display because it contains 6,785 columns, exceeding the 1,000-column maximum.
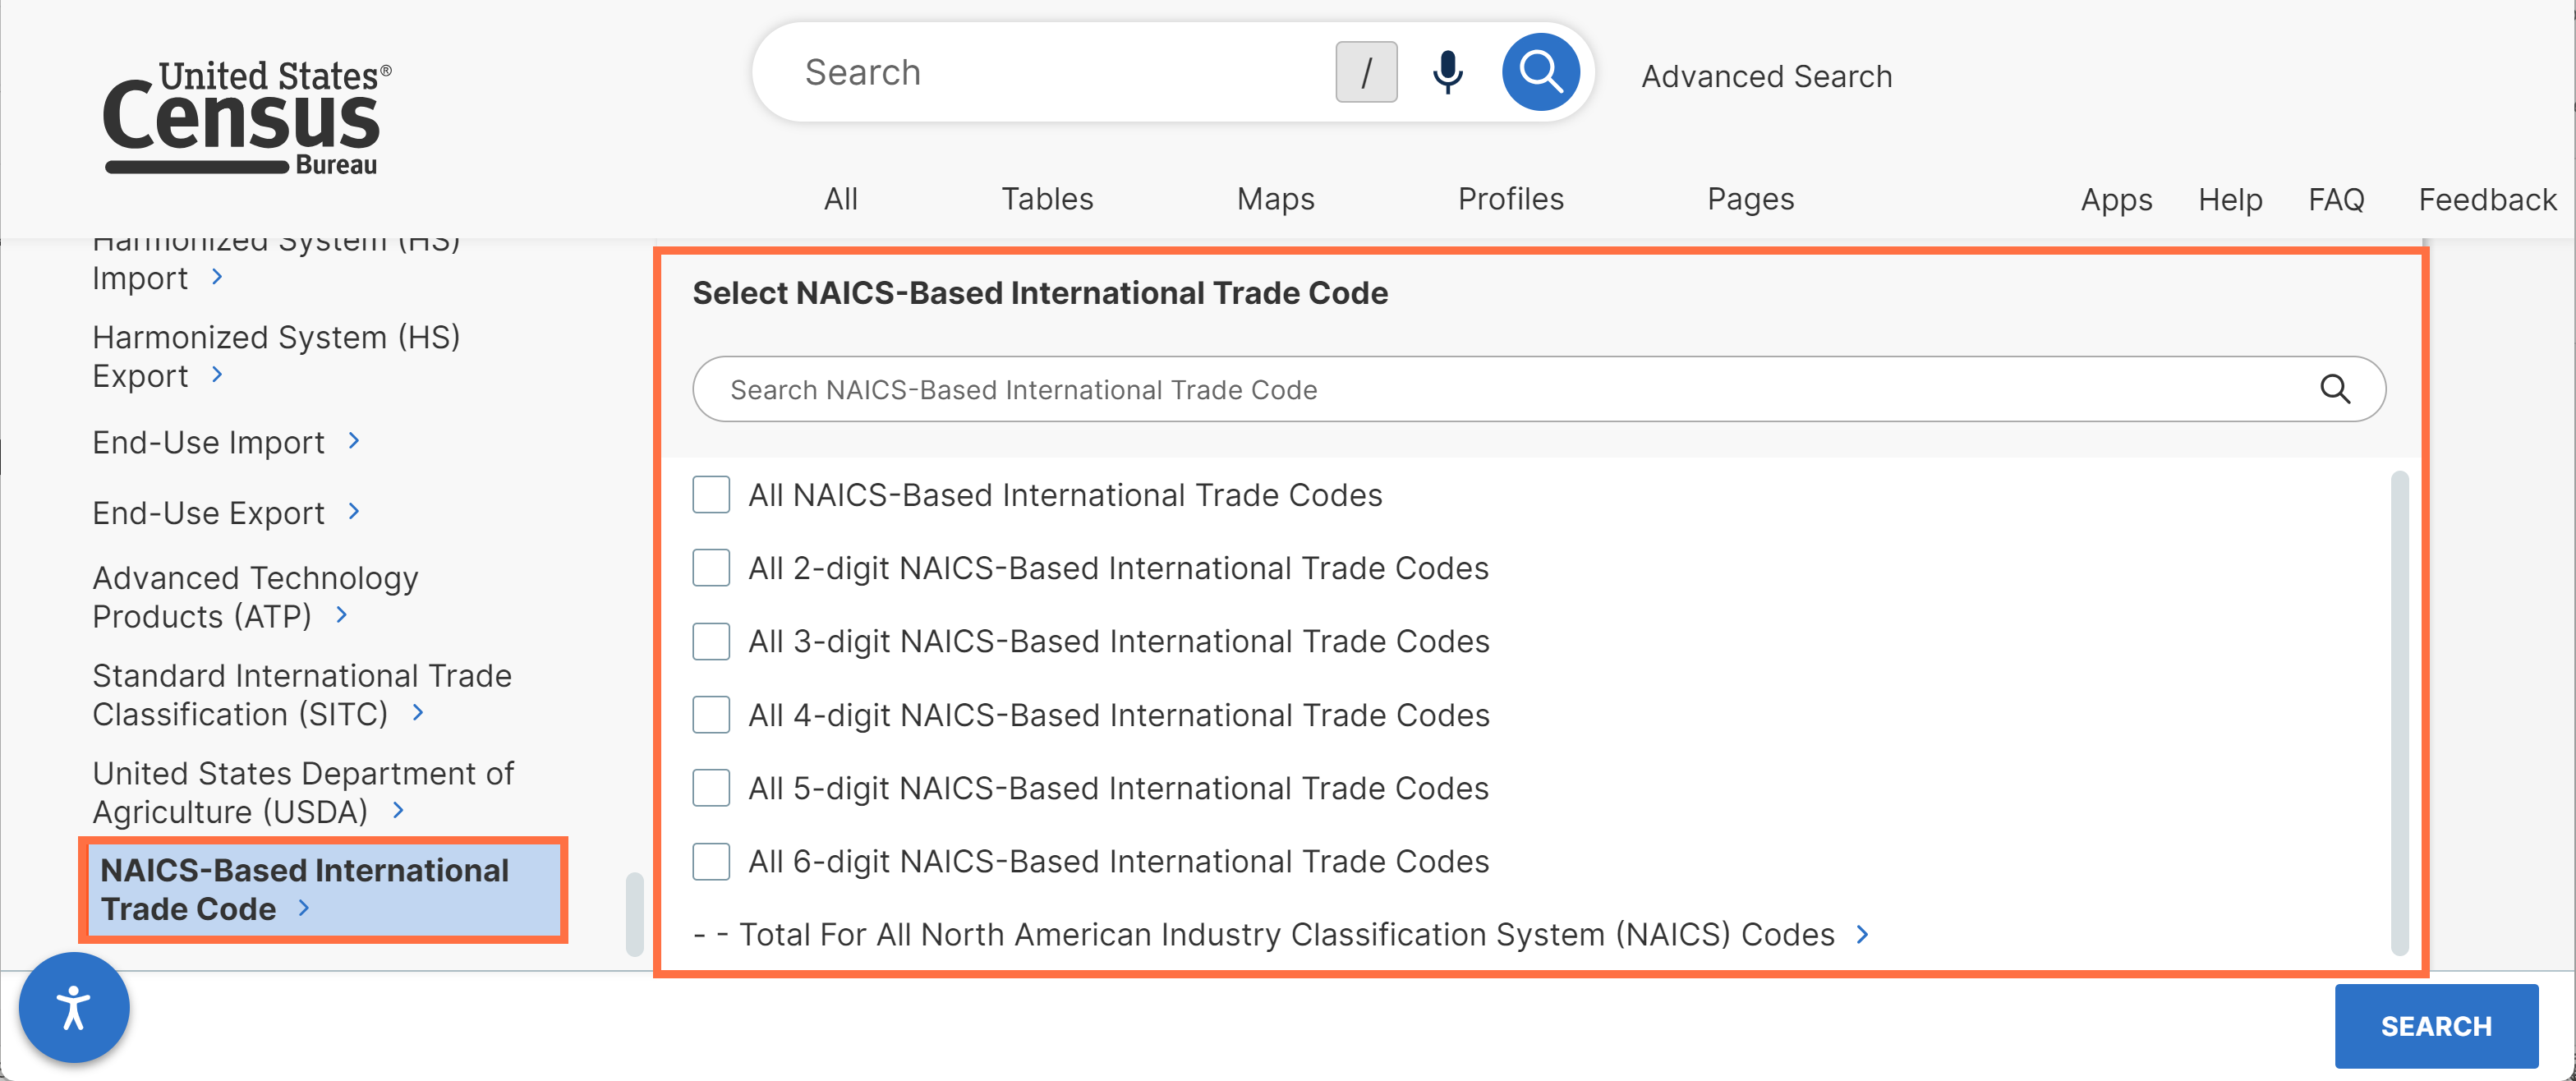
- New option to select NAICS-Based International Trade Codes, allowing you to access import/export data for different North American Industry Classification System (NAICS) Codes.
- Enhancements to the Population Pyramids App, including
- Clickable progress bar to navigate between the different sections of the app, or to start over from the beginning.
- New legend to show the meaning of each color in the pyramid.
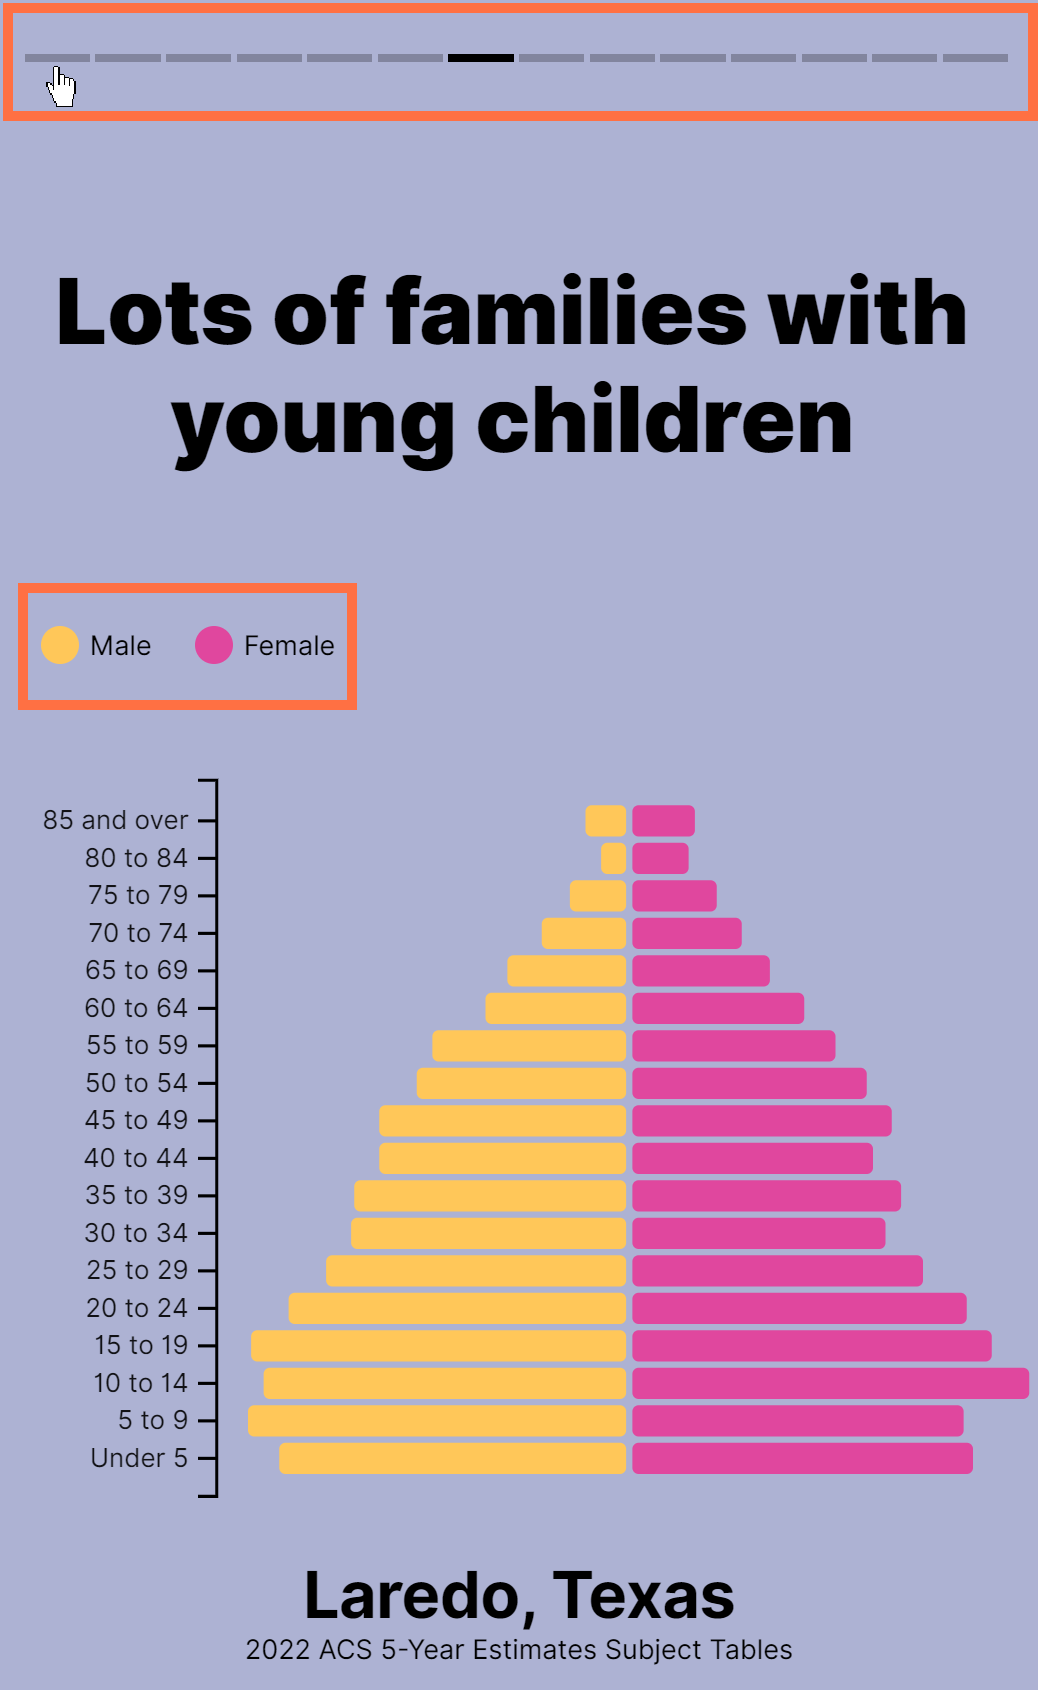
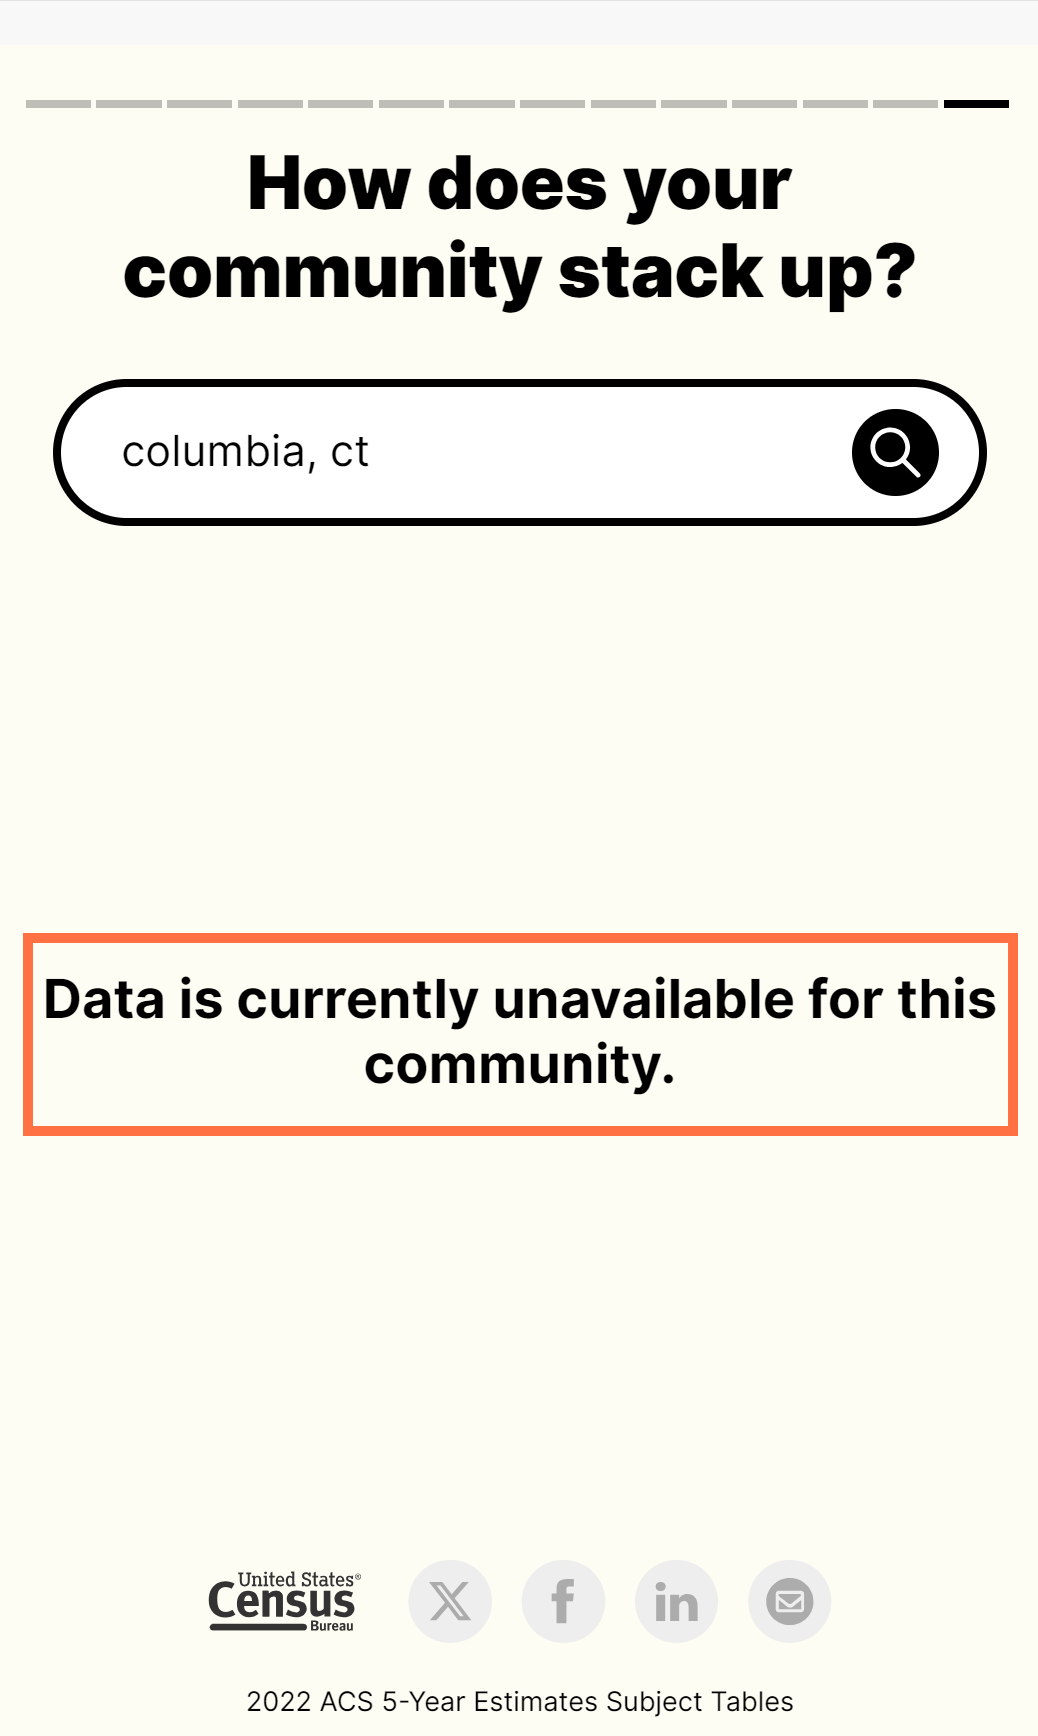
- Improved messaging when a population pyramid search does not show results.
- Back-end work to support future enhancements to mapping capabilities.
- Fixes to 12 defects, including fixes that allow you to:
- Map data from 2020 Census data tables for Island Areas.
- View data in custom tables after selecting multiple types of geographic areas in the Microdata Access Tool (MDAT).
On March 21, we released the following updates to the site:
- Enhancements to the Population Pyramids application, including:
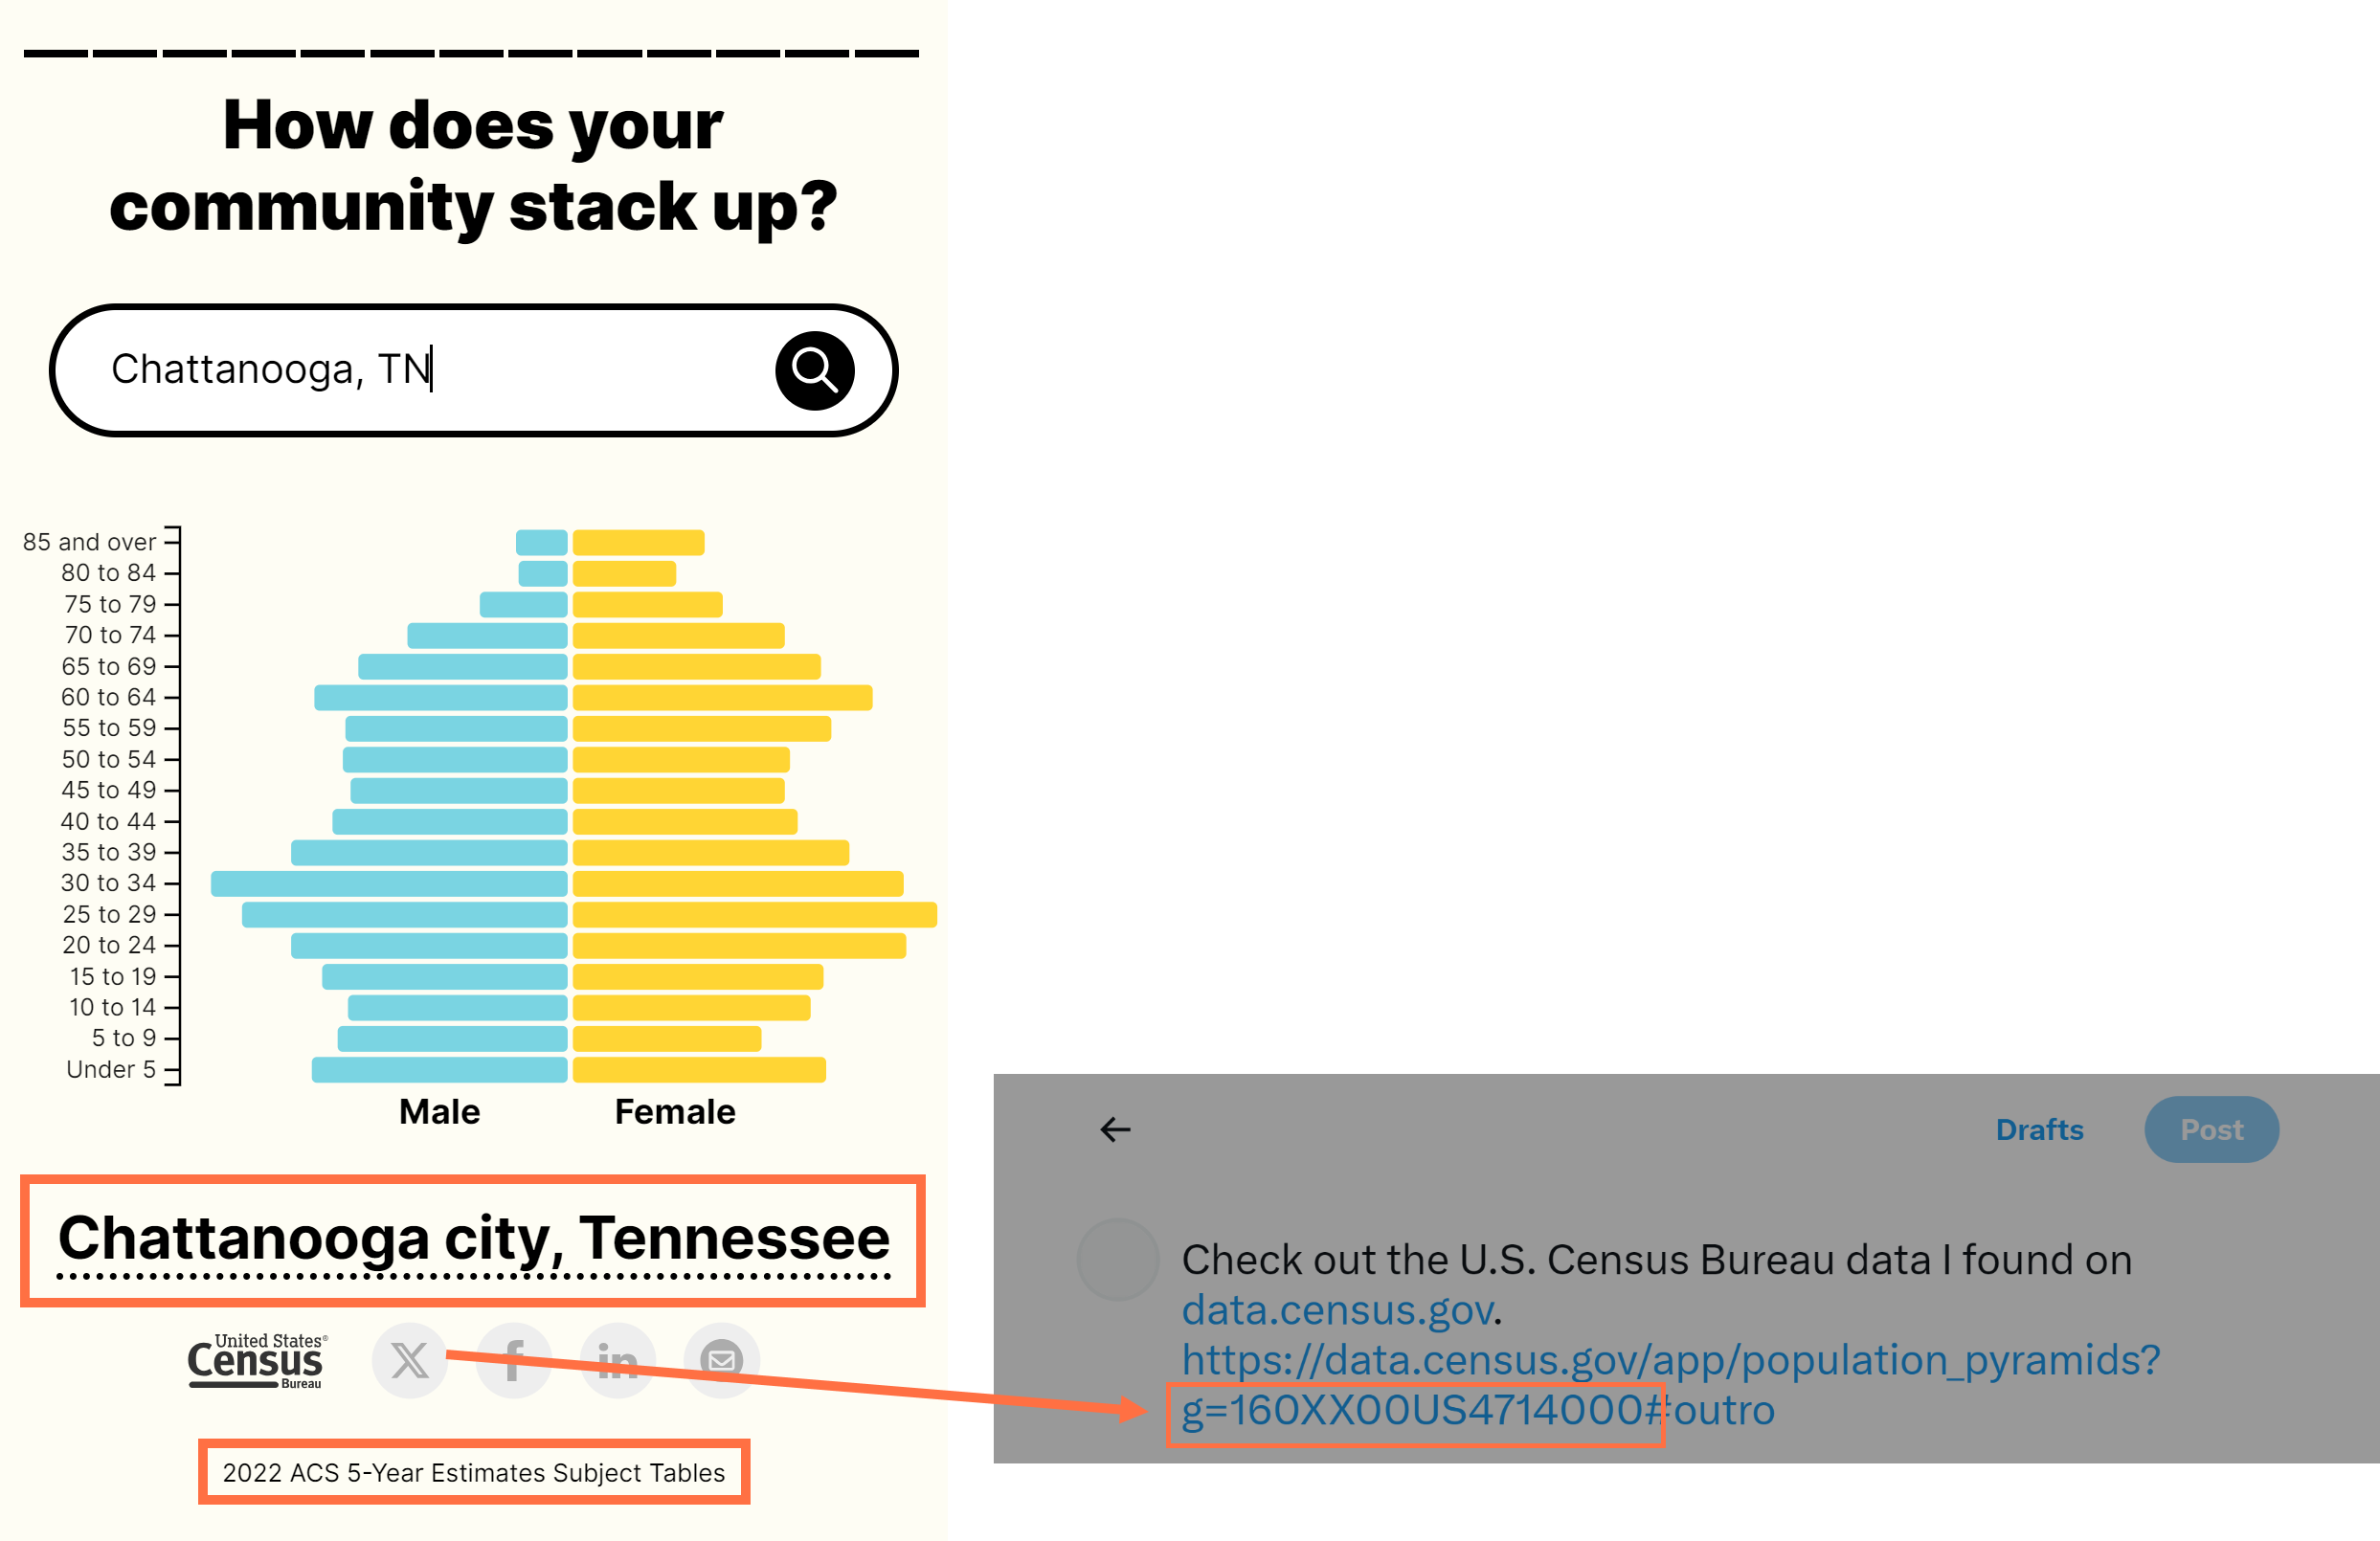
- Updated navigation to the related Geography Profile, accessible by clicking the geography name underlined with dotted lines.
- Improved links to share population pyramids. These URLs include the GEO ID to capture your geography selection, allowing you to share results to specific population pyramids.
- New source statement added to the widget.
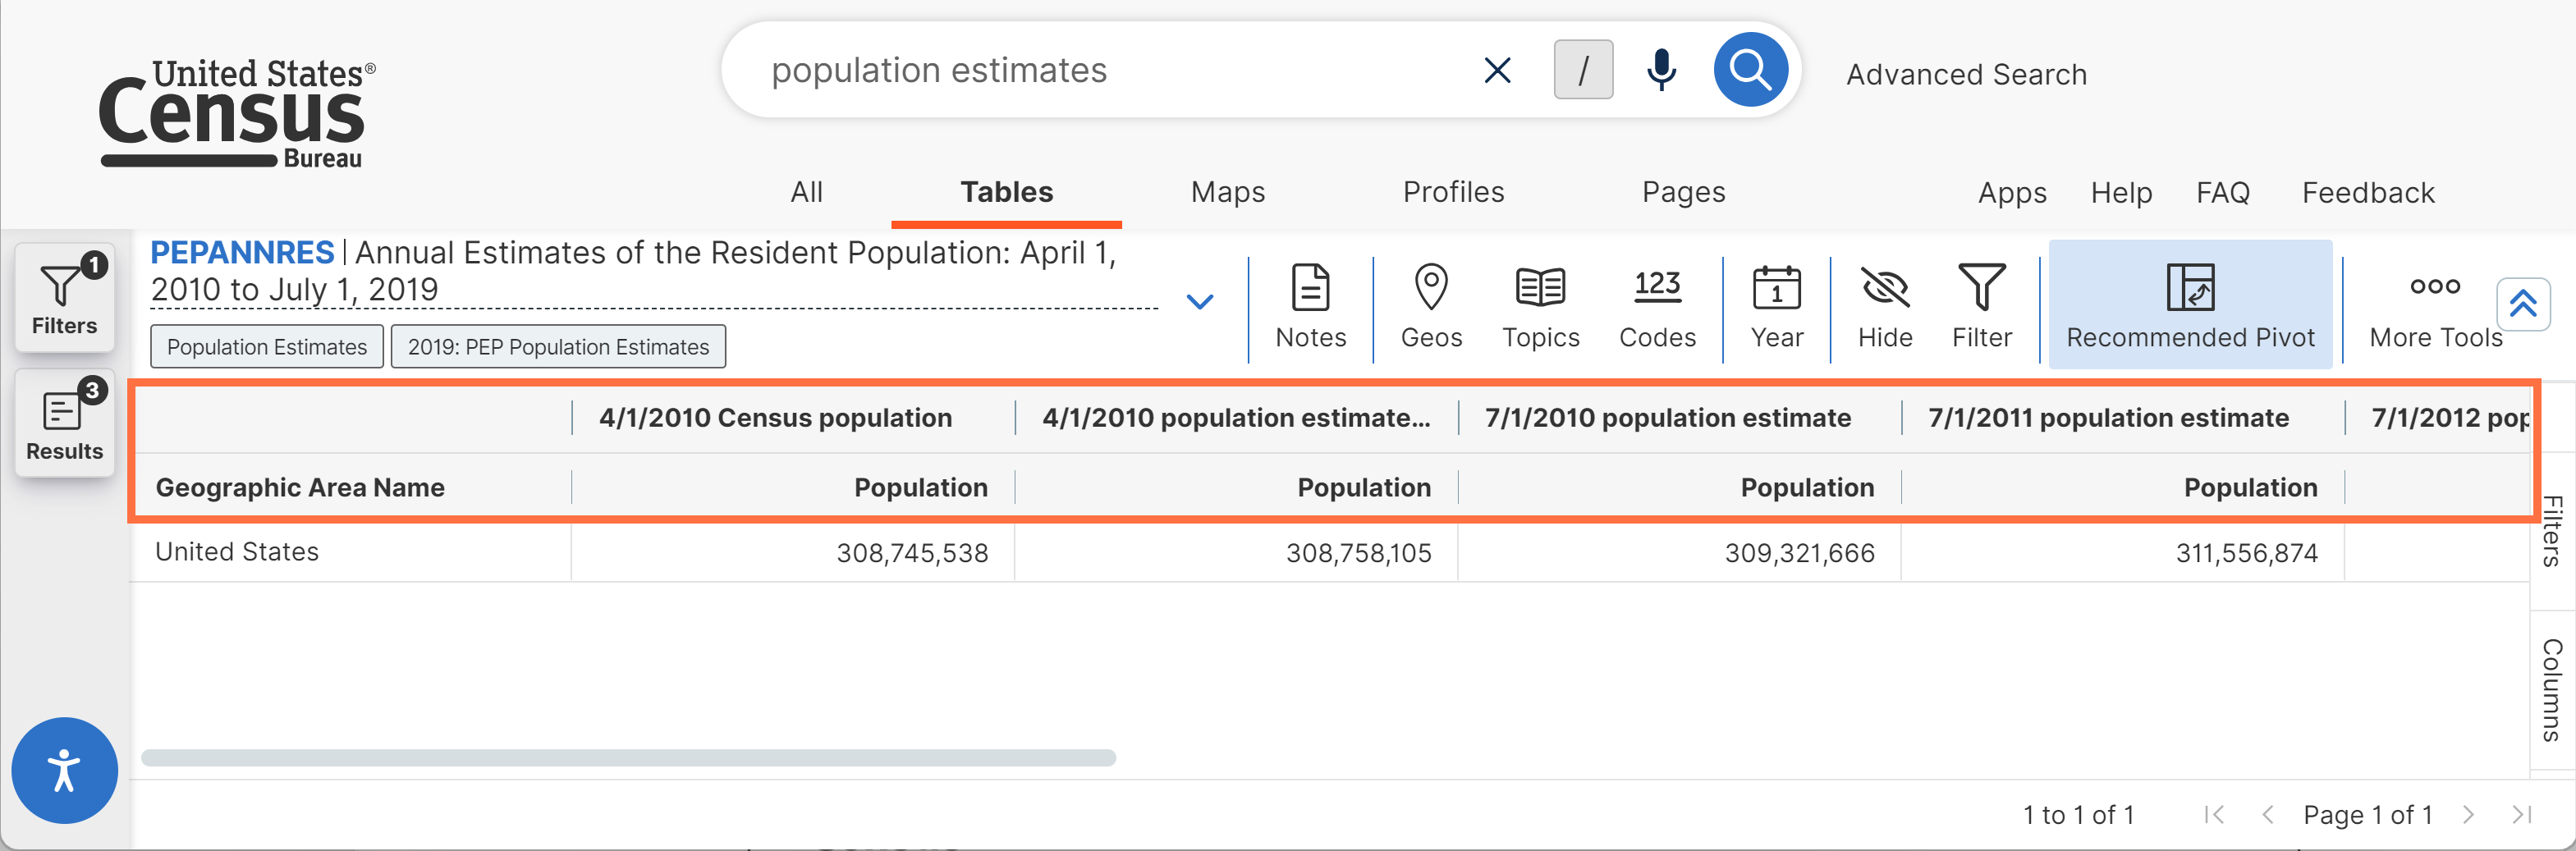
- Improved table headers. This update displays all table headers by default, including instances when tables have a recommended pivot automatically applied.
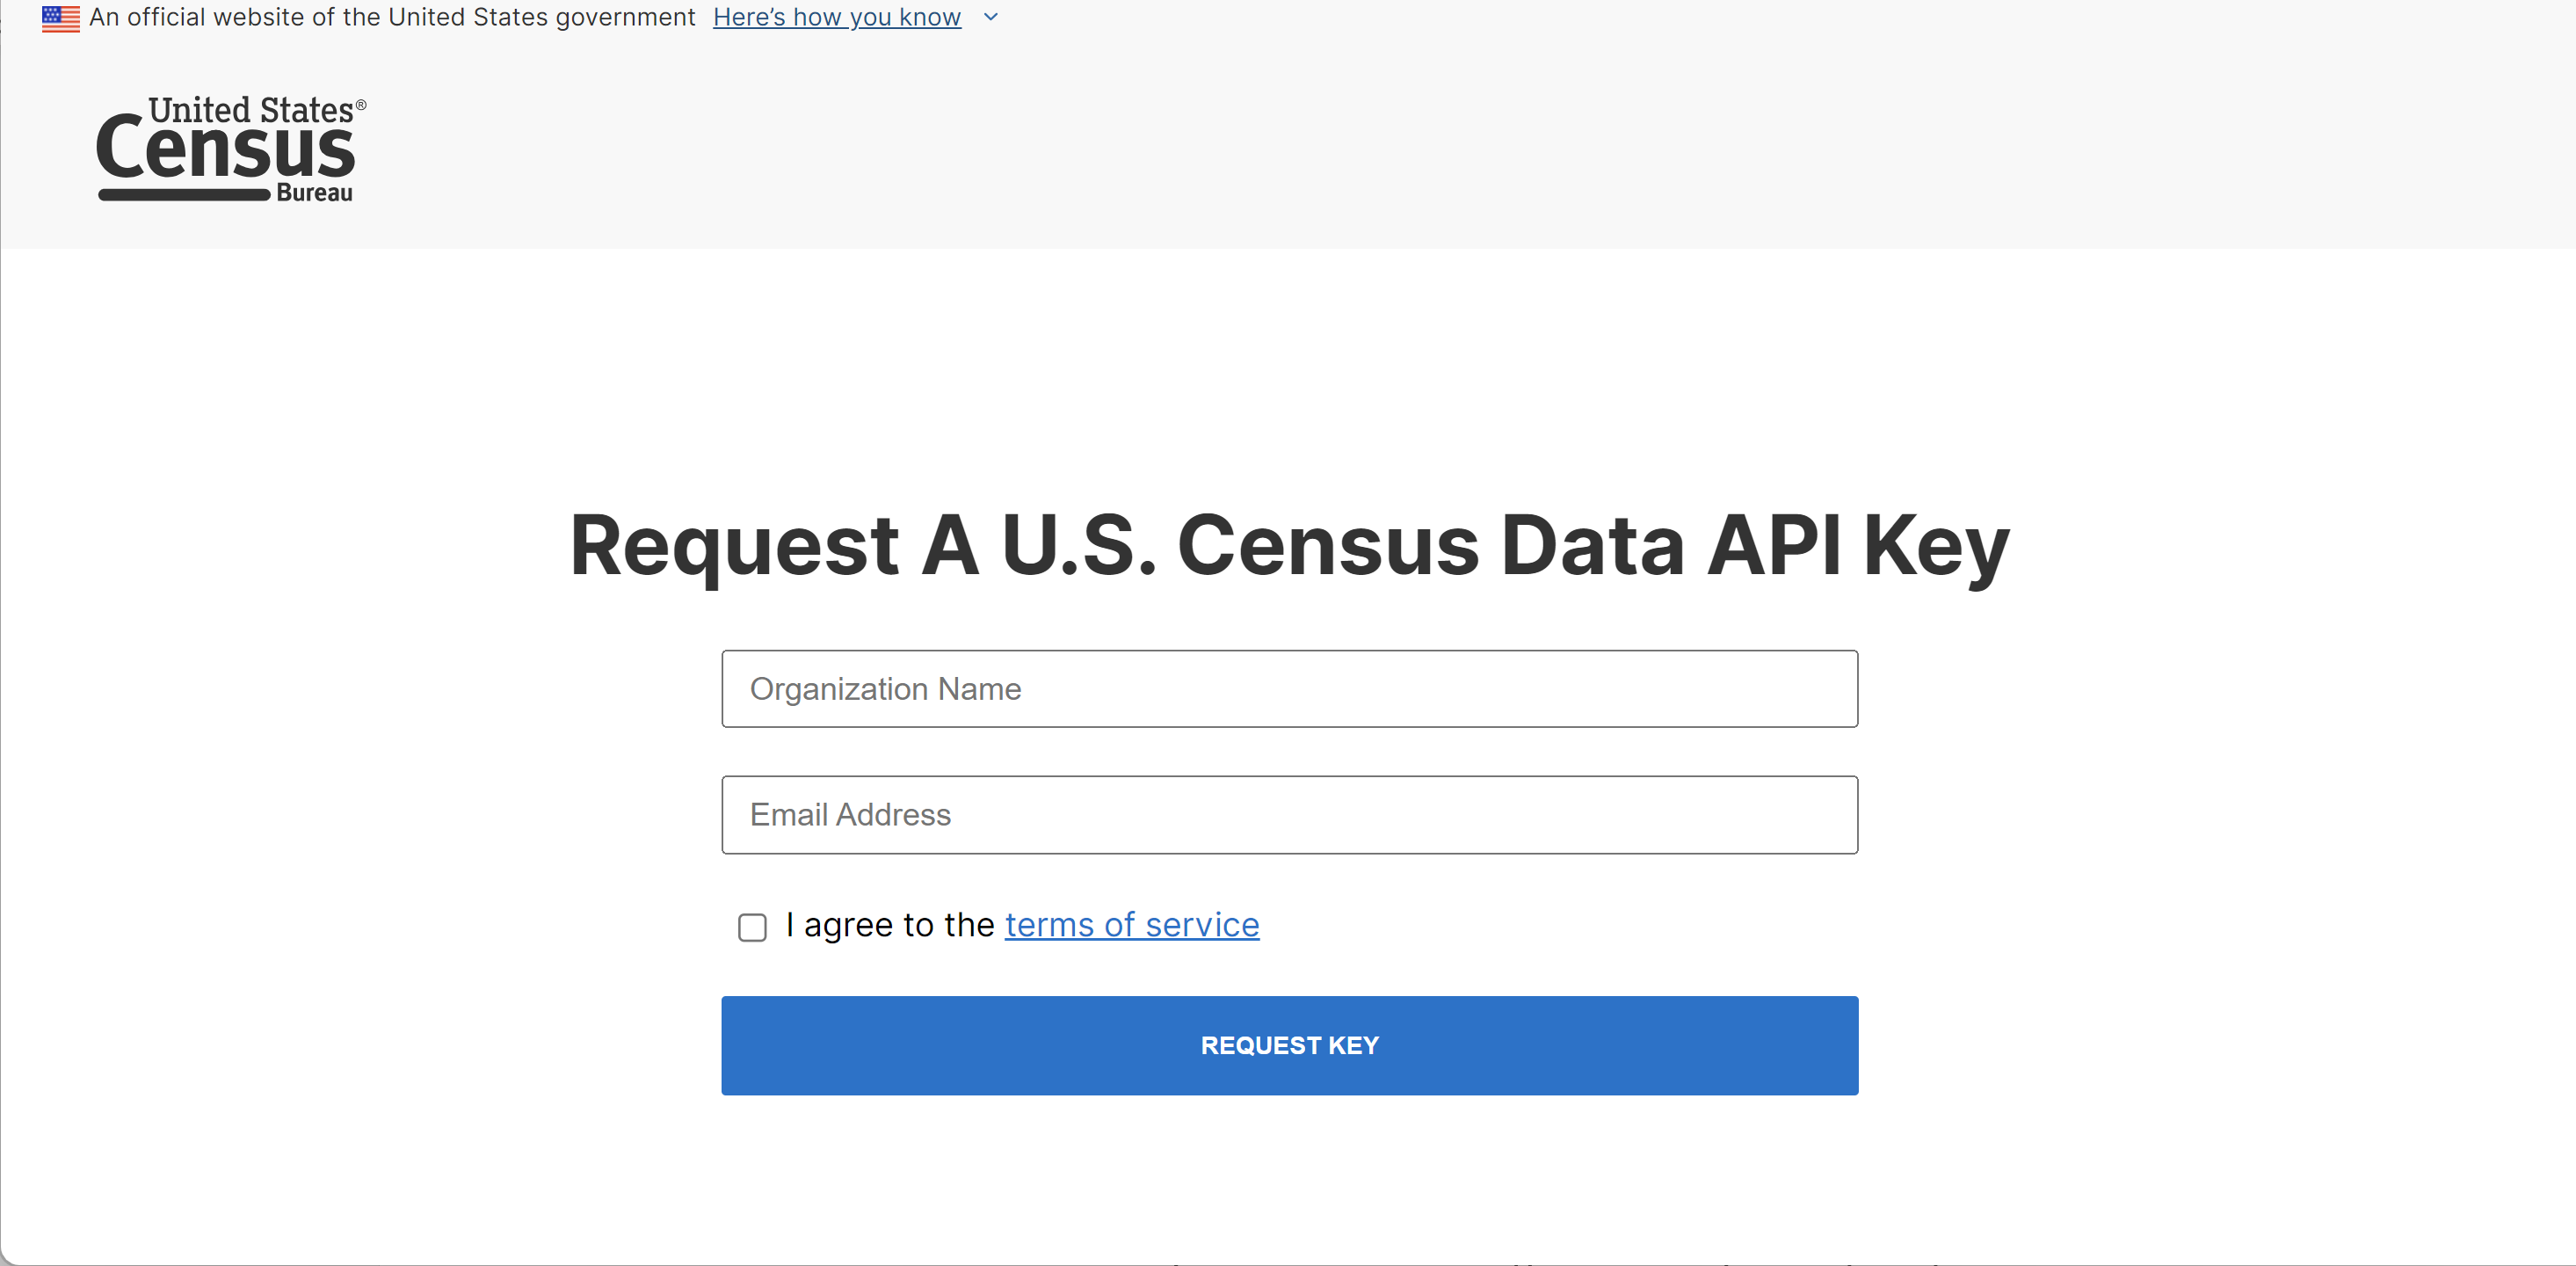
- Updated design for the webpage to sign-up for an API key. The new design includes Census Bureau branding and a consistent look and feel with other webpages.
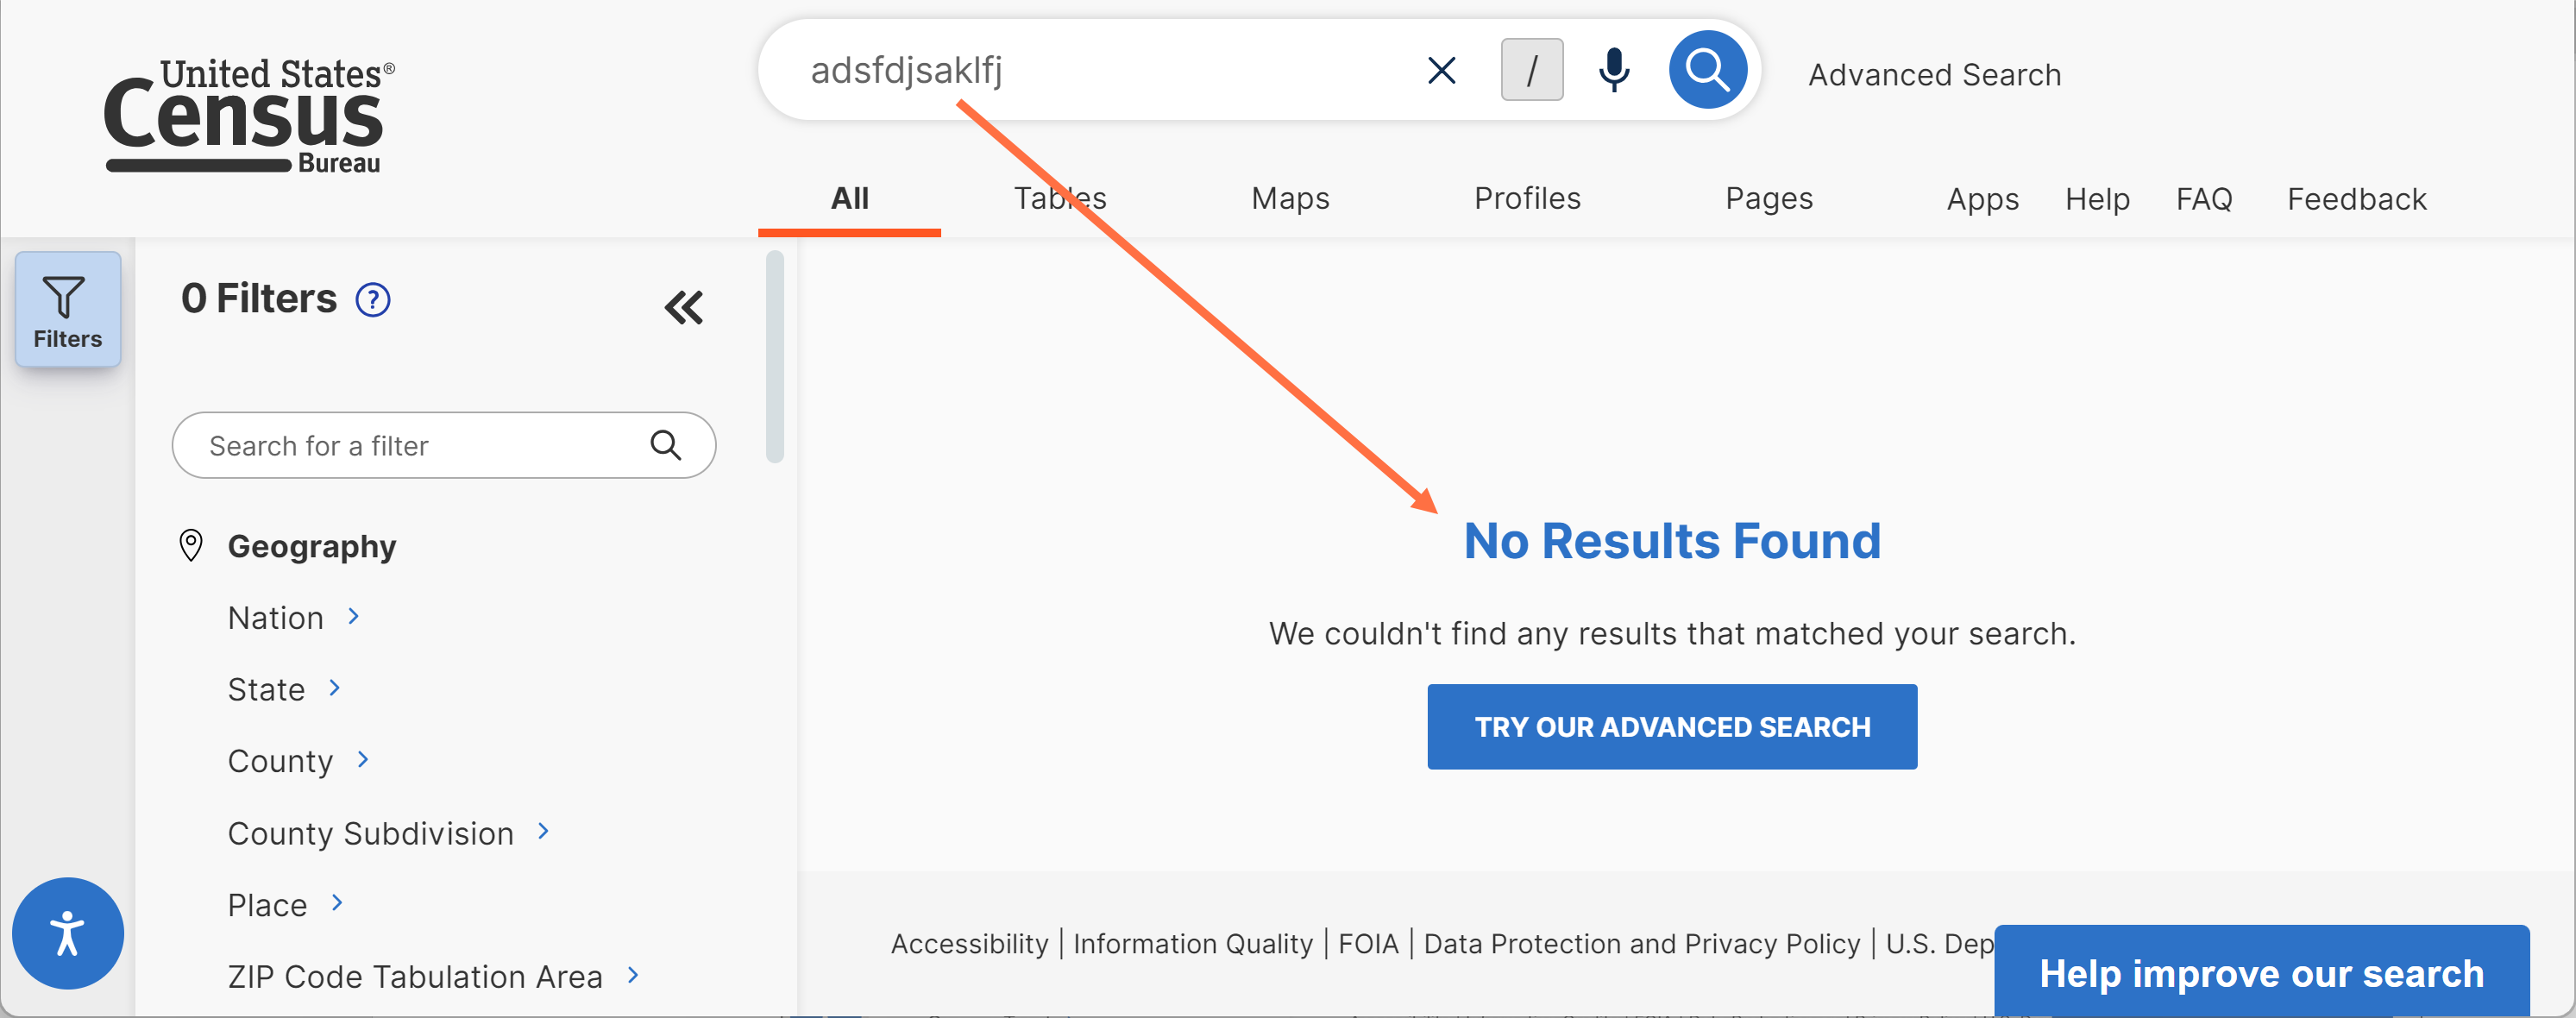
- Improved messaging when no results match the search. This update provides “No Results Found” messages when there are no matching results, without providing irrelevant Profile suggestions.
On February 29, we released the following updates to the site:
- Technical work to allow for downloading of geometric files in GeoJSON format. This work supports future enhancements to provide the ability for you to download these files at the click of a button after creating a map on data.census.gov.
- Behind-the-scenes updates that allow you to request data from the full range of values from variables in the Survey of Income and Program Participation (SIPP) dataset.
- Technical upgrades to help prevent defects associated with older technology.
- Other back-end updates to improve the speed of internal processes.
- Fixes to 22 defects, including fixes that allow you to:
- Navigate throughout map features with buttons that are responsive to your selections.
- View map labels in full even on small screen sizes.
- Navigate backwards throughout the filter panel by clicking applicable words and phrases.
On February 22, we released the following updates to the site:
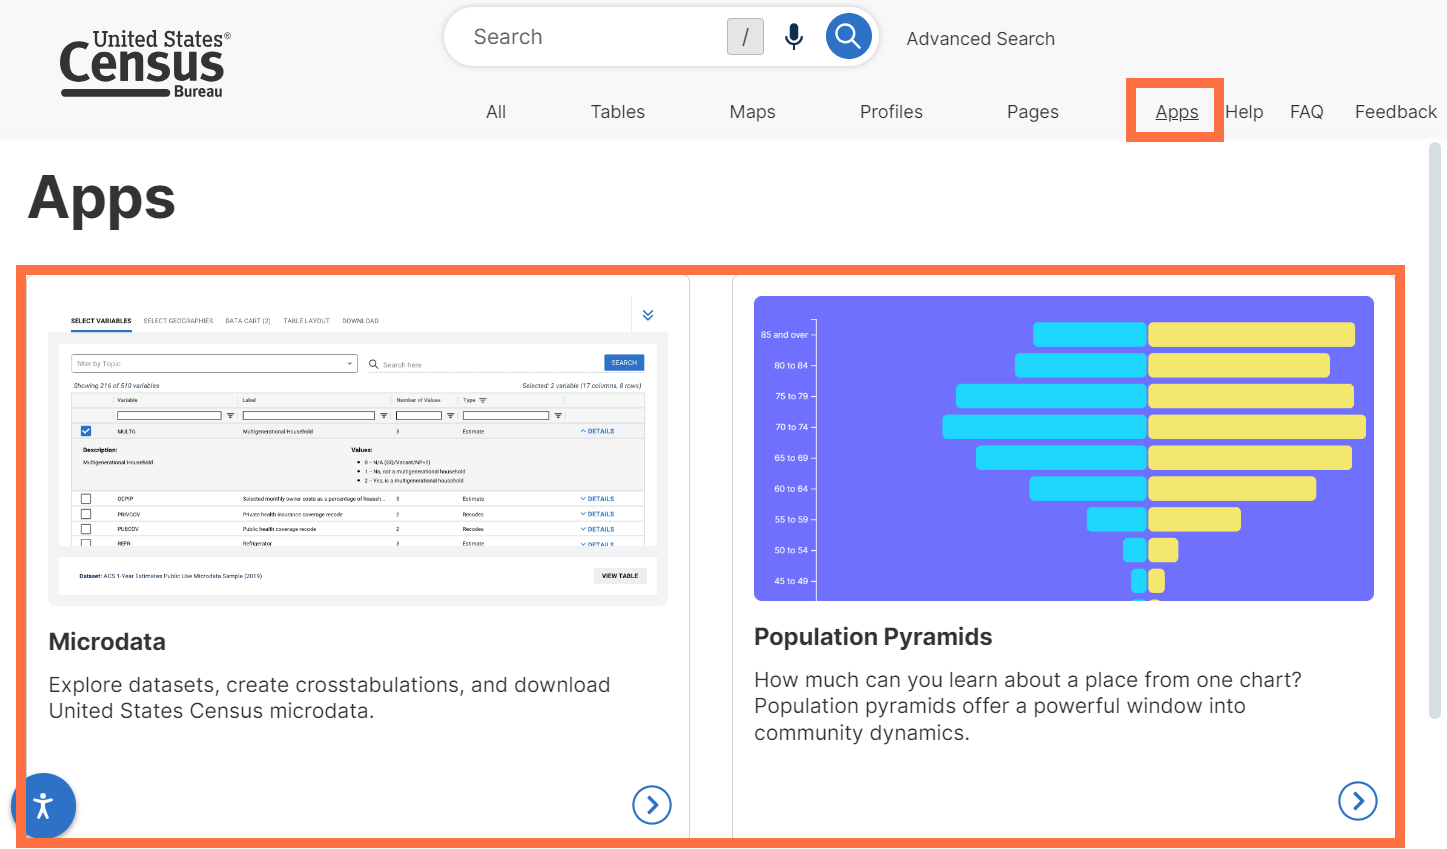
- New Apps tab at the top of the screen. This provides easy access to special applications that have been developed for data.census.gov, such as the Pop Story App and the Microdata Access Tool. The tab allows you to access these applications without having to know the special link for each application.
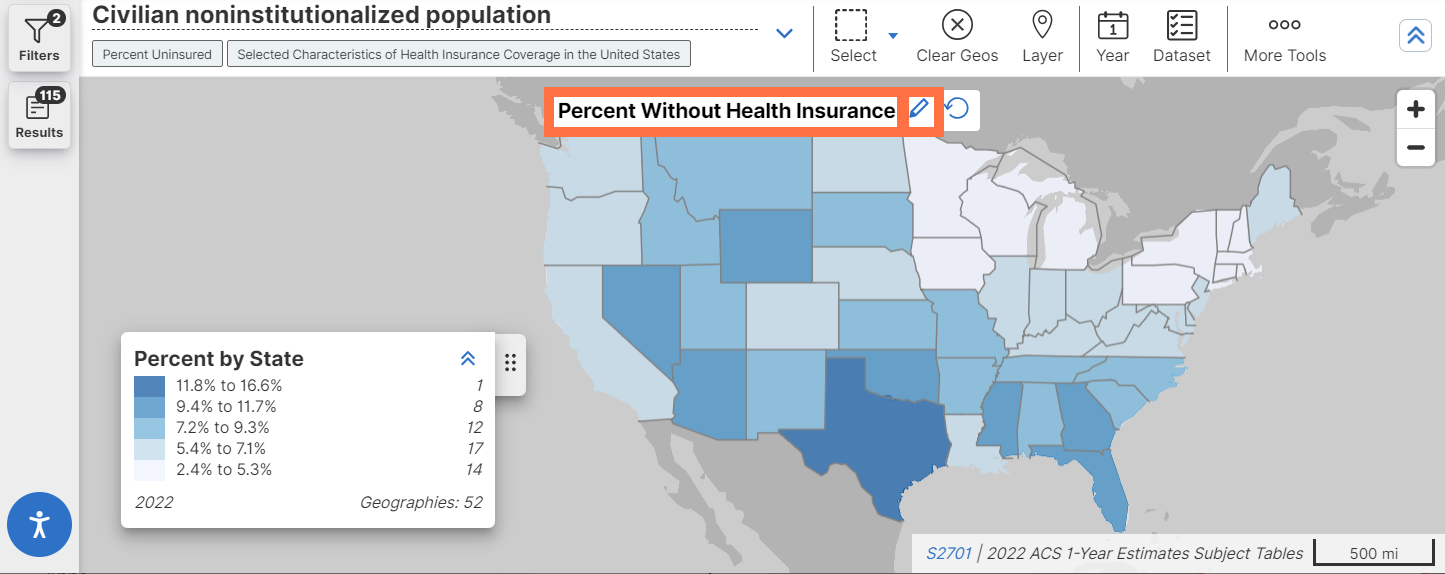
- New edit button for map titles, allowing you to create custom titles that best describe your map.
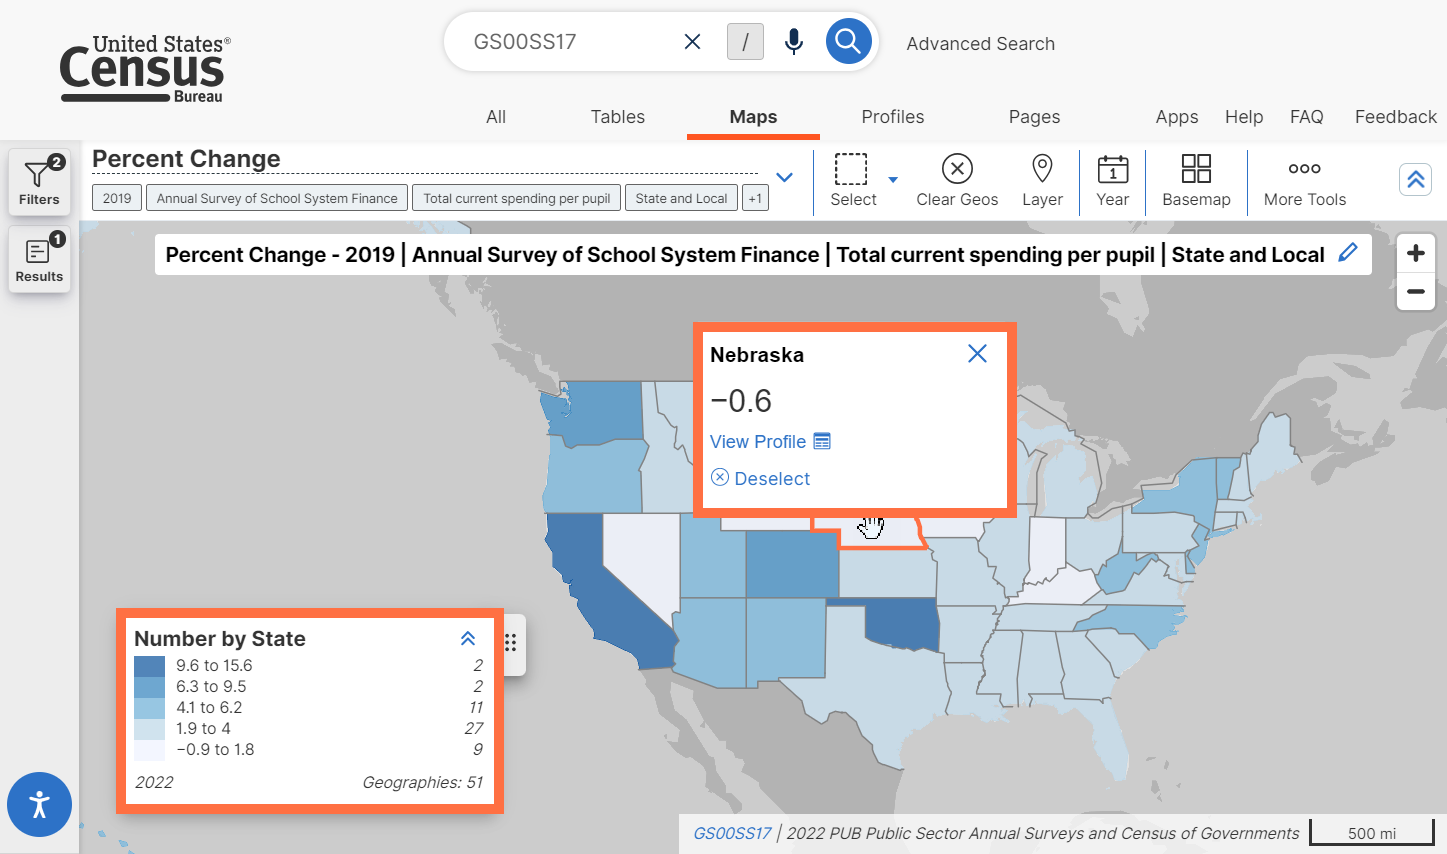
- Enhancements to show the full range of positive and negative data values on a map. This improvement incorporates negative values seamlessly into the legend when applicable (for example, when mapping data that shows percent change over time).
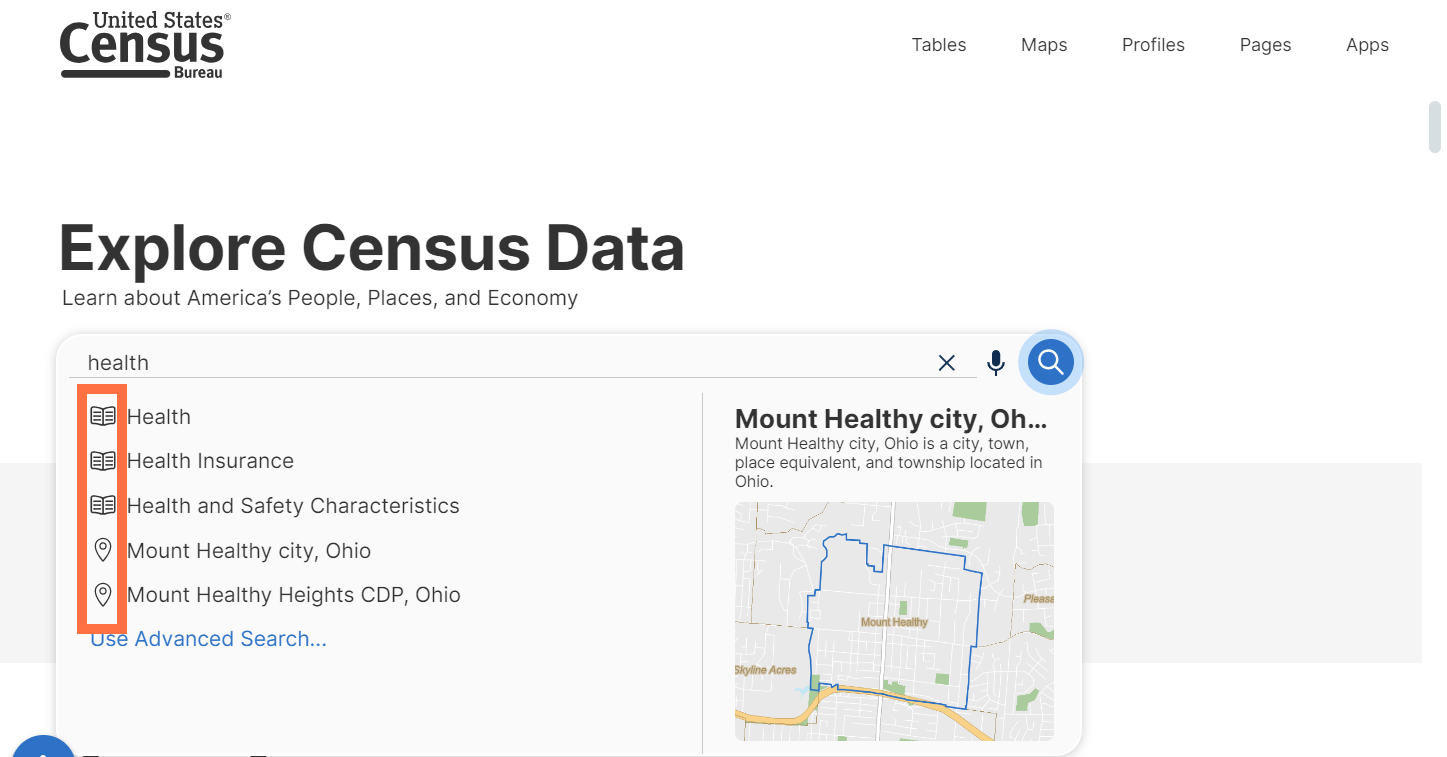
- New icons added to the suggested search terms in the single search bar. These icons provide more context to indicate whether the suggested phrase is a geography, code, survey, topic, year, or table.

- Technical work to improve the ability to add fully qualified table citations that include sponsor agencies.
- Behind-the-scenes updates to labels for page headers throughout the site. This update improves organization and accessibility through screen readers.
- Technical work to improve the ability to quickly access large datasets, such as data from the International Trade program.
- Fixes to 12 defects, including fixes that allow you to:
- Scroll through all options after clicking the “More Tools” button at the top of the table or map.
- Click between the “Codes” and “Year” buttons at the top of the table seamlessly.
- Access controls on the right side of the table to adjust the columns, pivot, and cell notes.
On Jan 18, we released the following updates to the site:
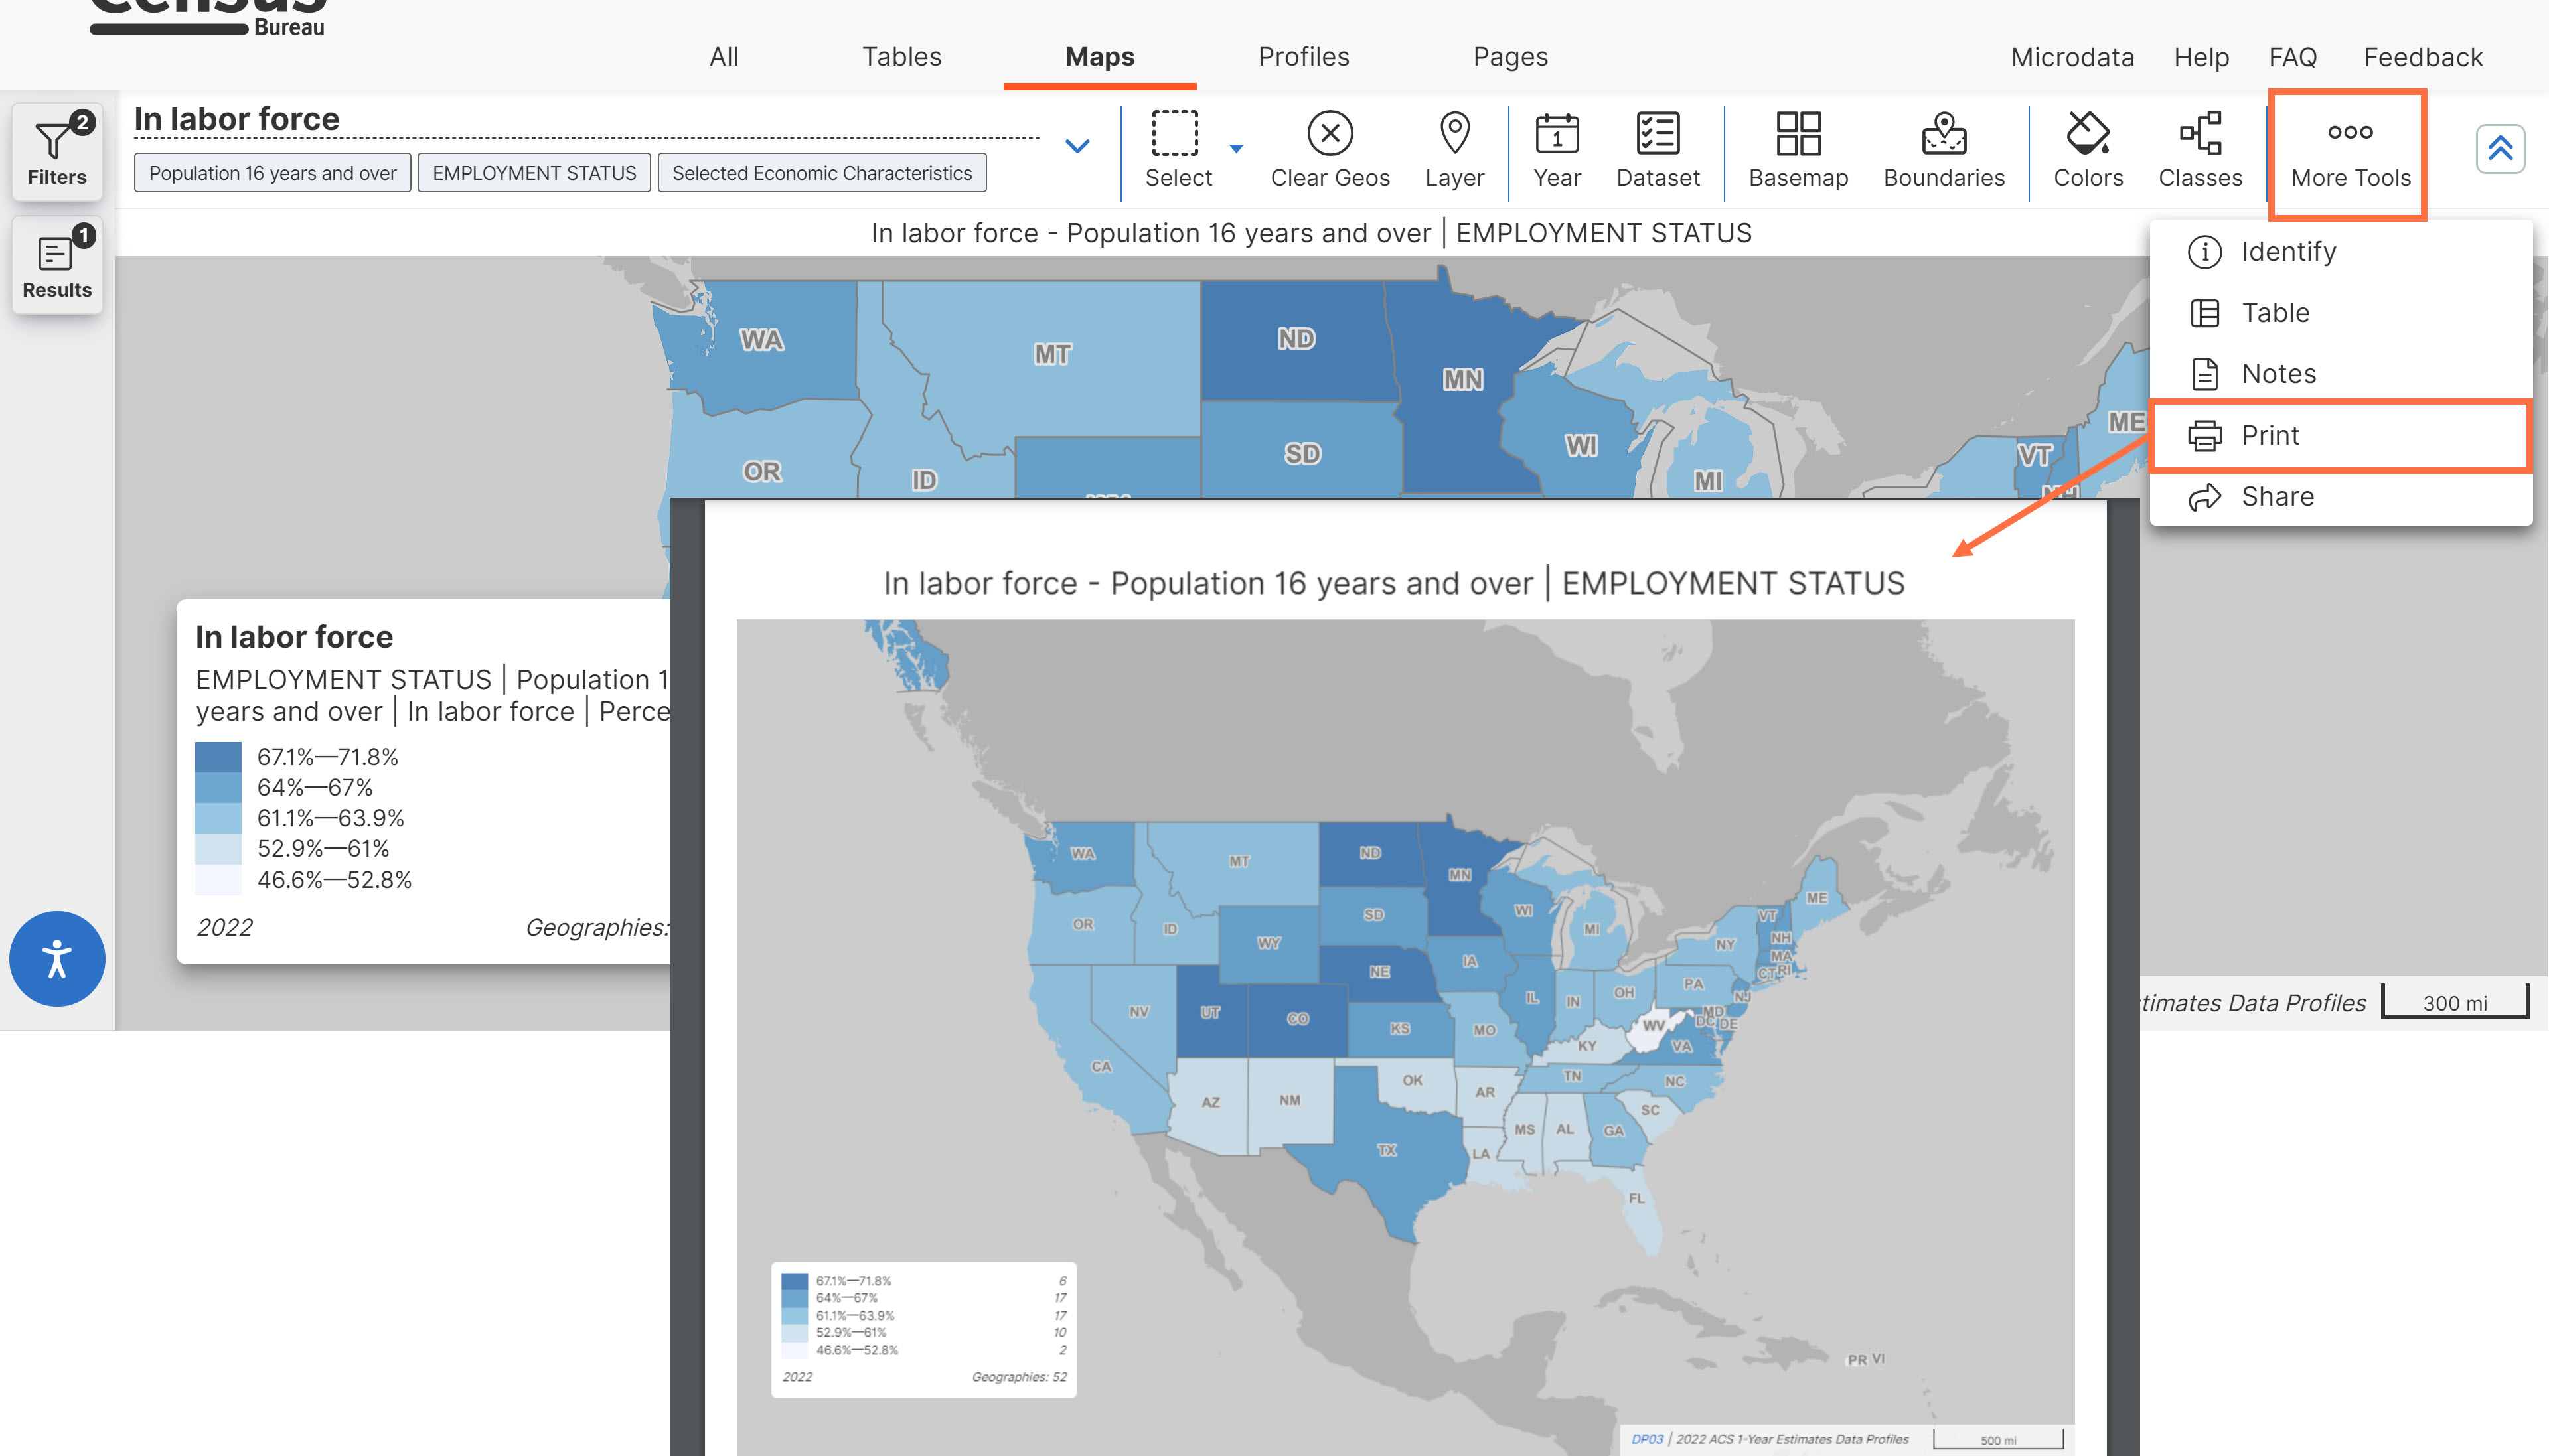
- New print button for maps. With this button, you can click print to create a PDF download of your map that is optimized for printing. The first page of the PDF provides the map and key labels, while the remaining pages of the PDF provide map notes.
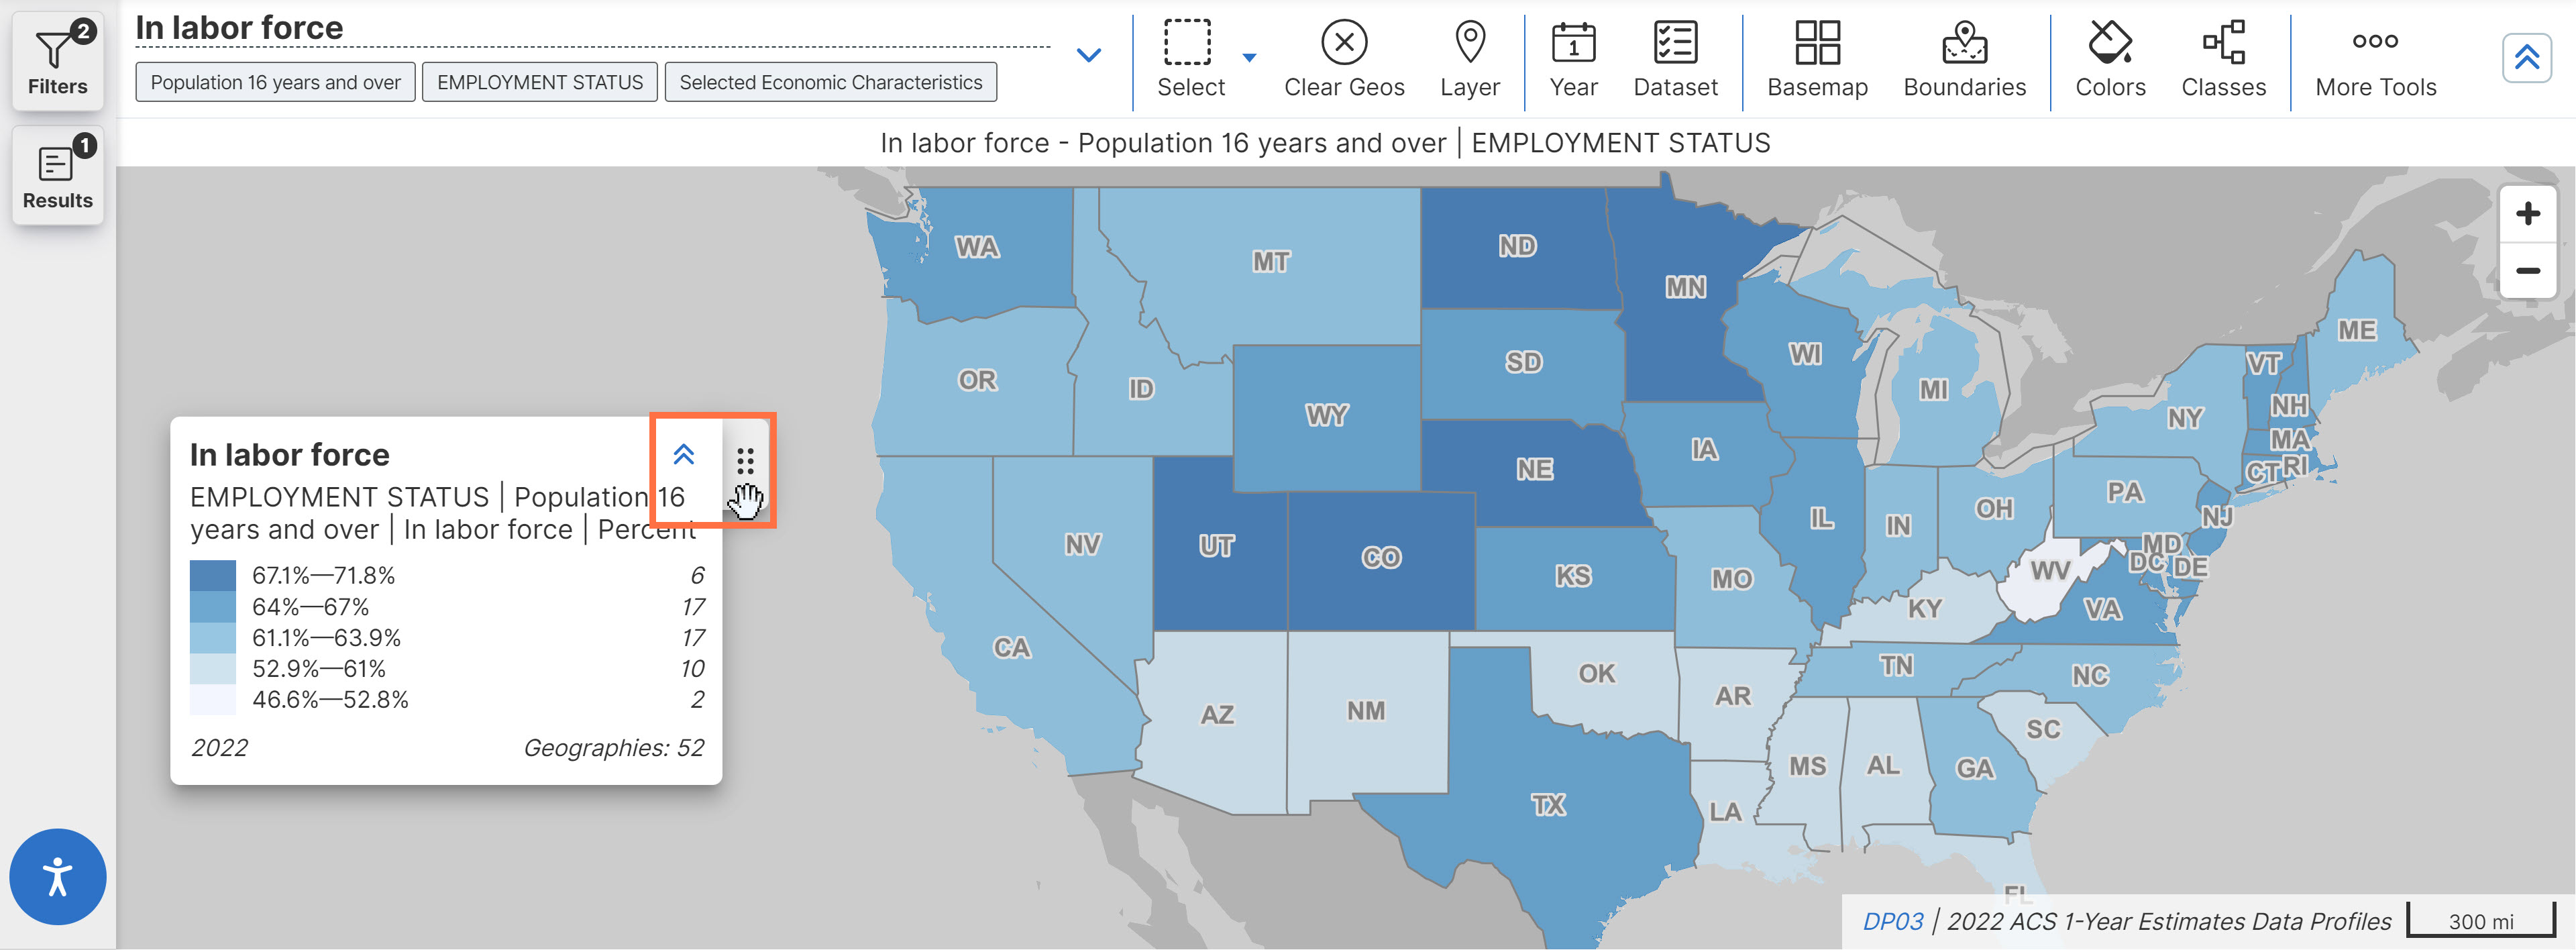
- Improved map legend. These update removes the “style” section of the legend and adds two new controls that allow you to move or collapse the legend.
- Updated layout of the Pop Story App: data.census.gov/app/population_pyramids
With this update, the experience is optimized for mobile devices. On desktop devices, you will now see content in portrait mode, as well as additional controls on each side to scroll through the app.
- Fixes to 6 defects, including fixes that allow you to:
- See updated source statements for population pyramids in the Geography Profiles
- Search for incomplete phrases in the filter panel search bars
- View correct labels for geography names containing accent marks in table downloads
On Jan 4, we released the following updates to the site:
- Show/Hide Geographic Components buttons added to all applicable filter panel screens. This update supports recent releases from the 2020 decennial census, allowing you to access all available data for geographic components, such as urban and rural portions of a county.
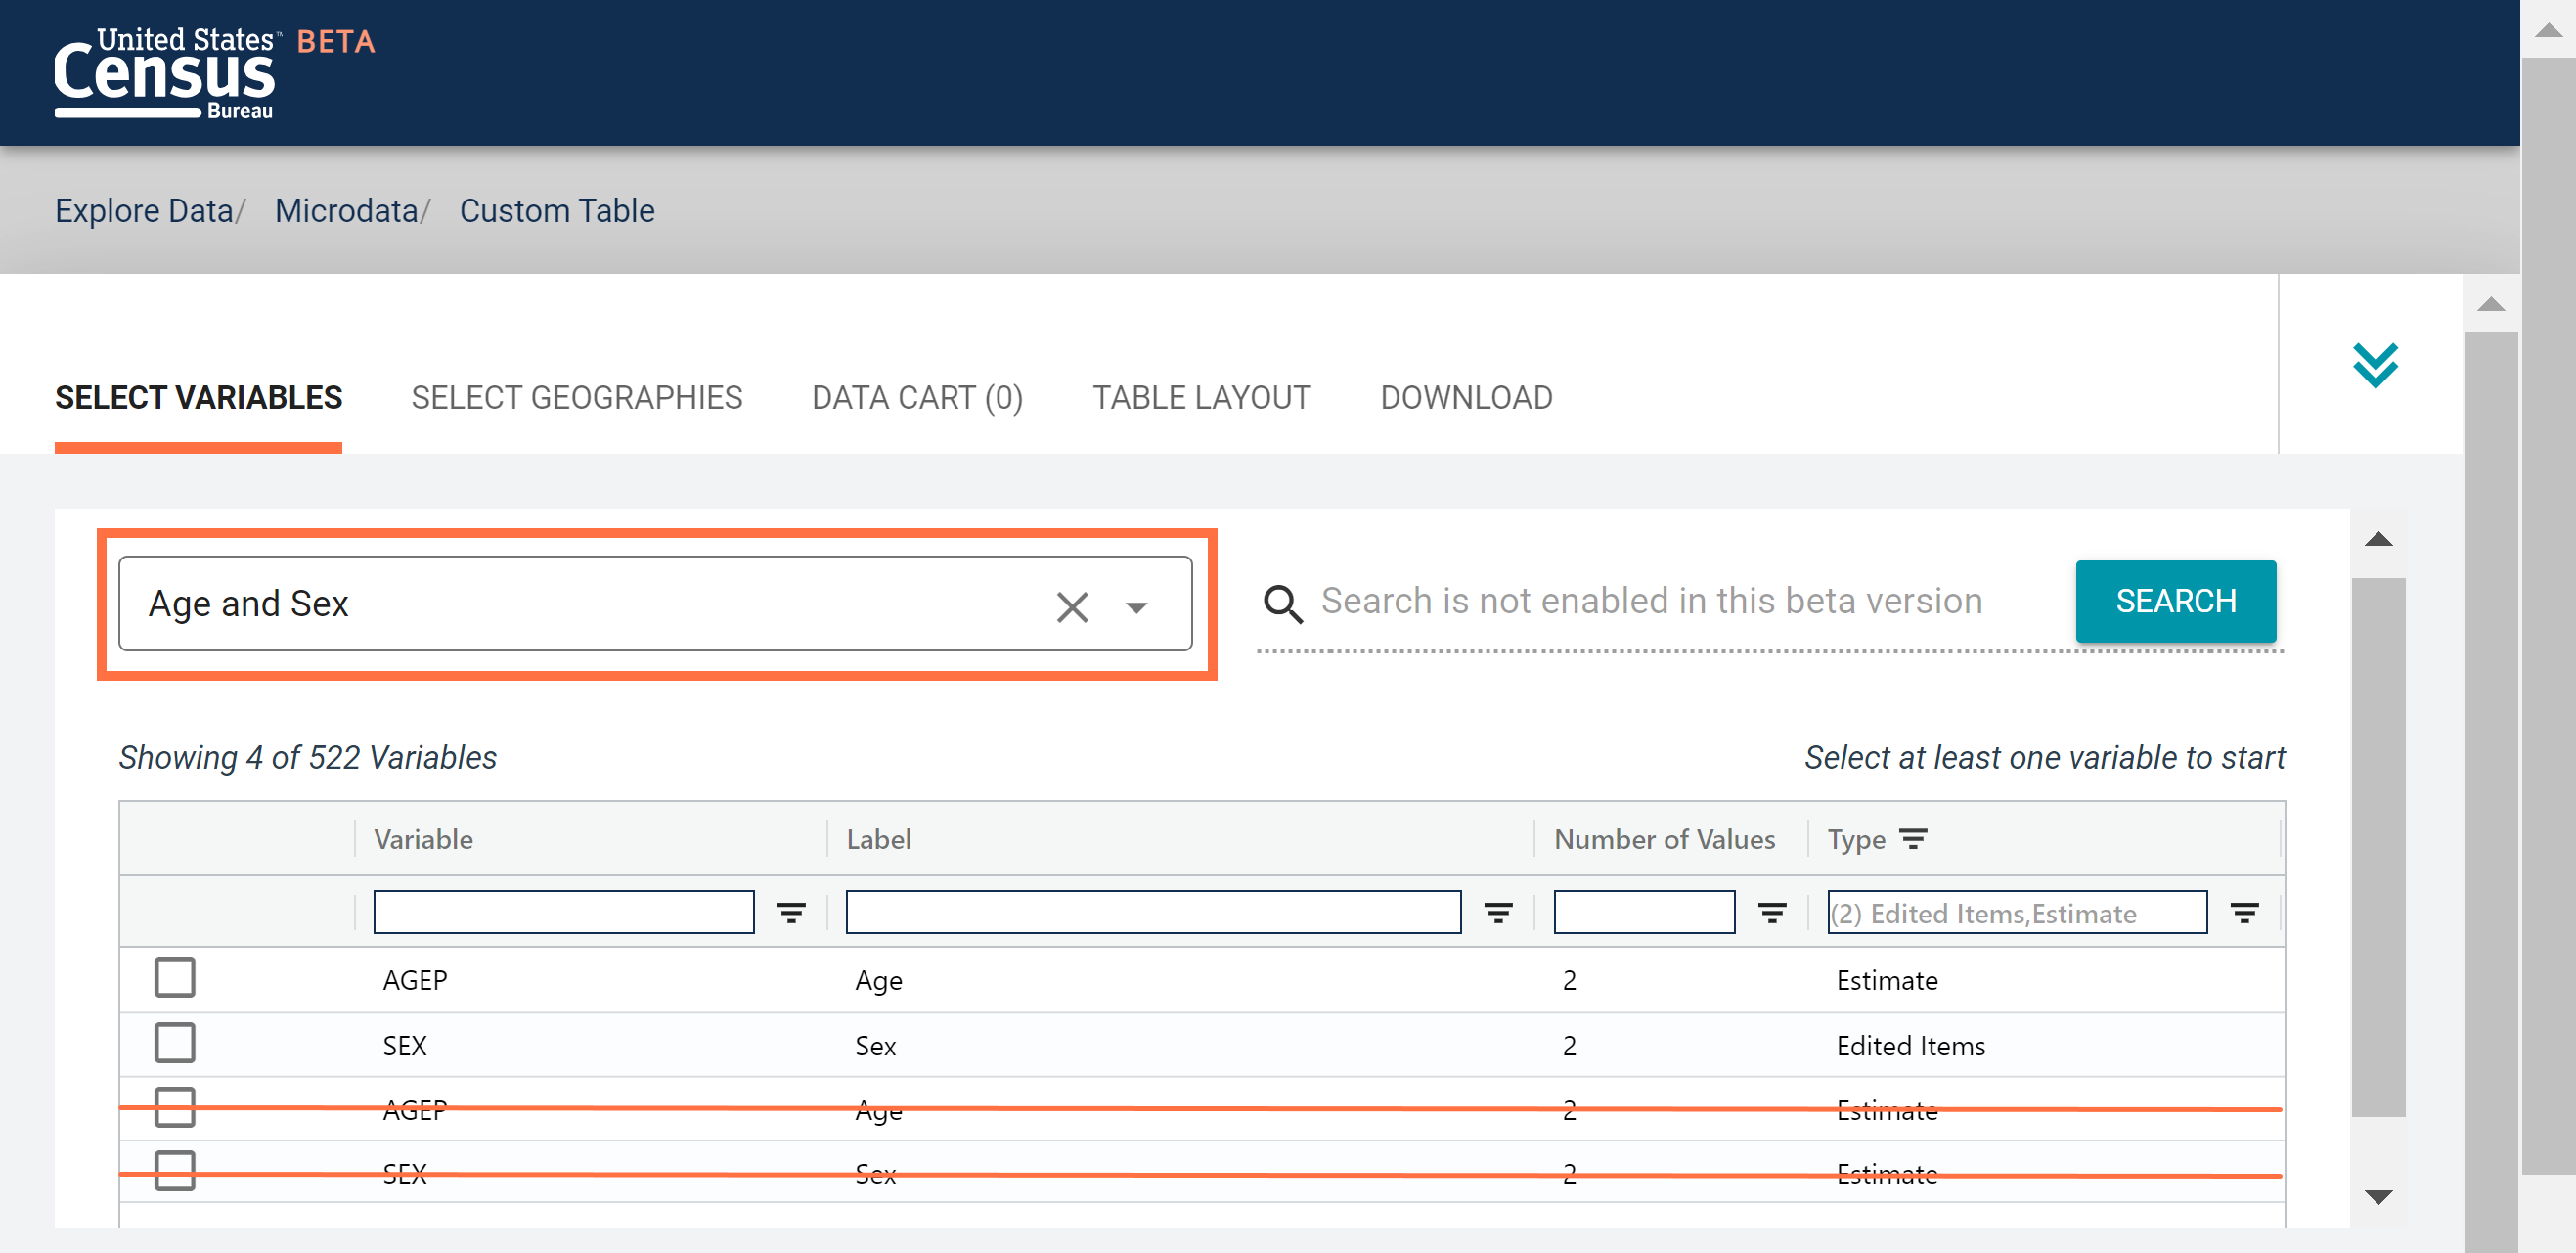
- Improvements to search variables by topic in the Microdata Access Tool (MDAT). With this update, only the variables that are compatible with your specific dataset will be returned to you. This means that duplicate and/or irrelevant variables will no longer appear in the list of results.
- New URLs for data.census.gov maps. URLs now follow this structure: /map/[geoID]/[dataset]/[tableID]/[cellID]
For example, in the new map URL: https://data.census.gov/map/010XX00US$0400000/ACSDP1Y2022/DP05/DP05_0004E?q=dp05&layer=VT_2022_040_00_PP_D1
Geo ID = 010XX00US$0400000
Dataset = ACSDP1Y2022
Table ID = DP05
Cell ID = DP05_0004E
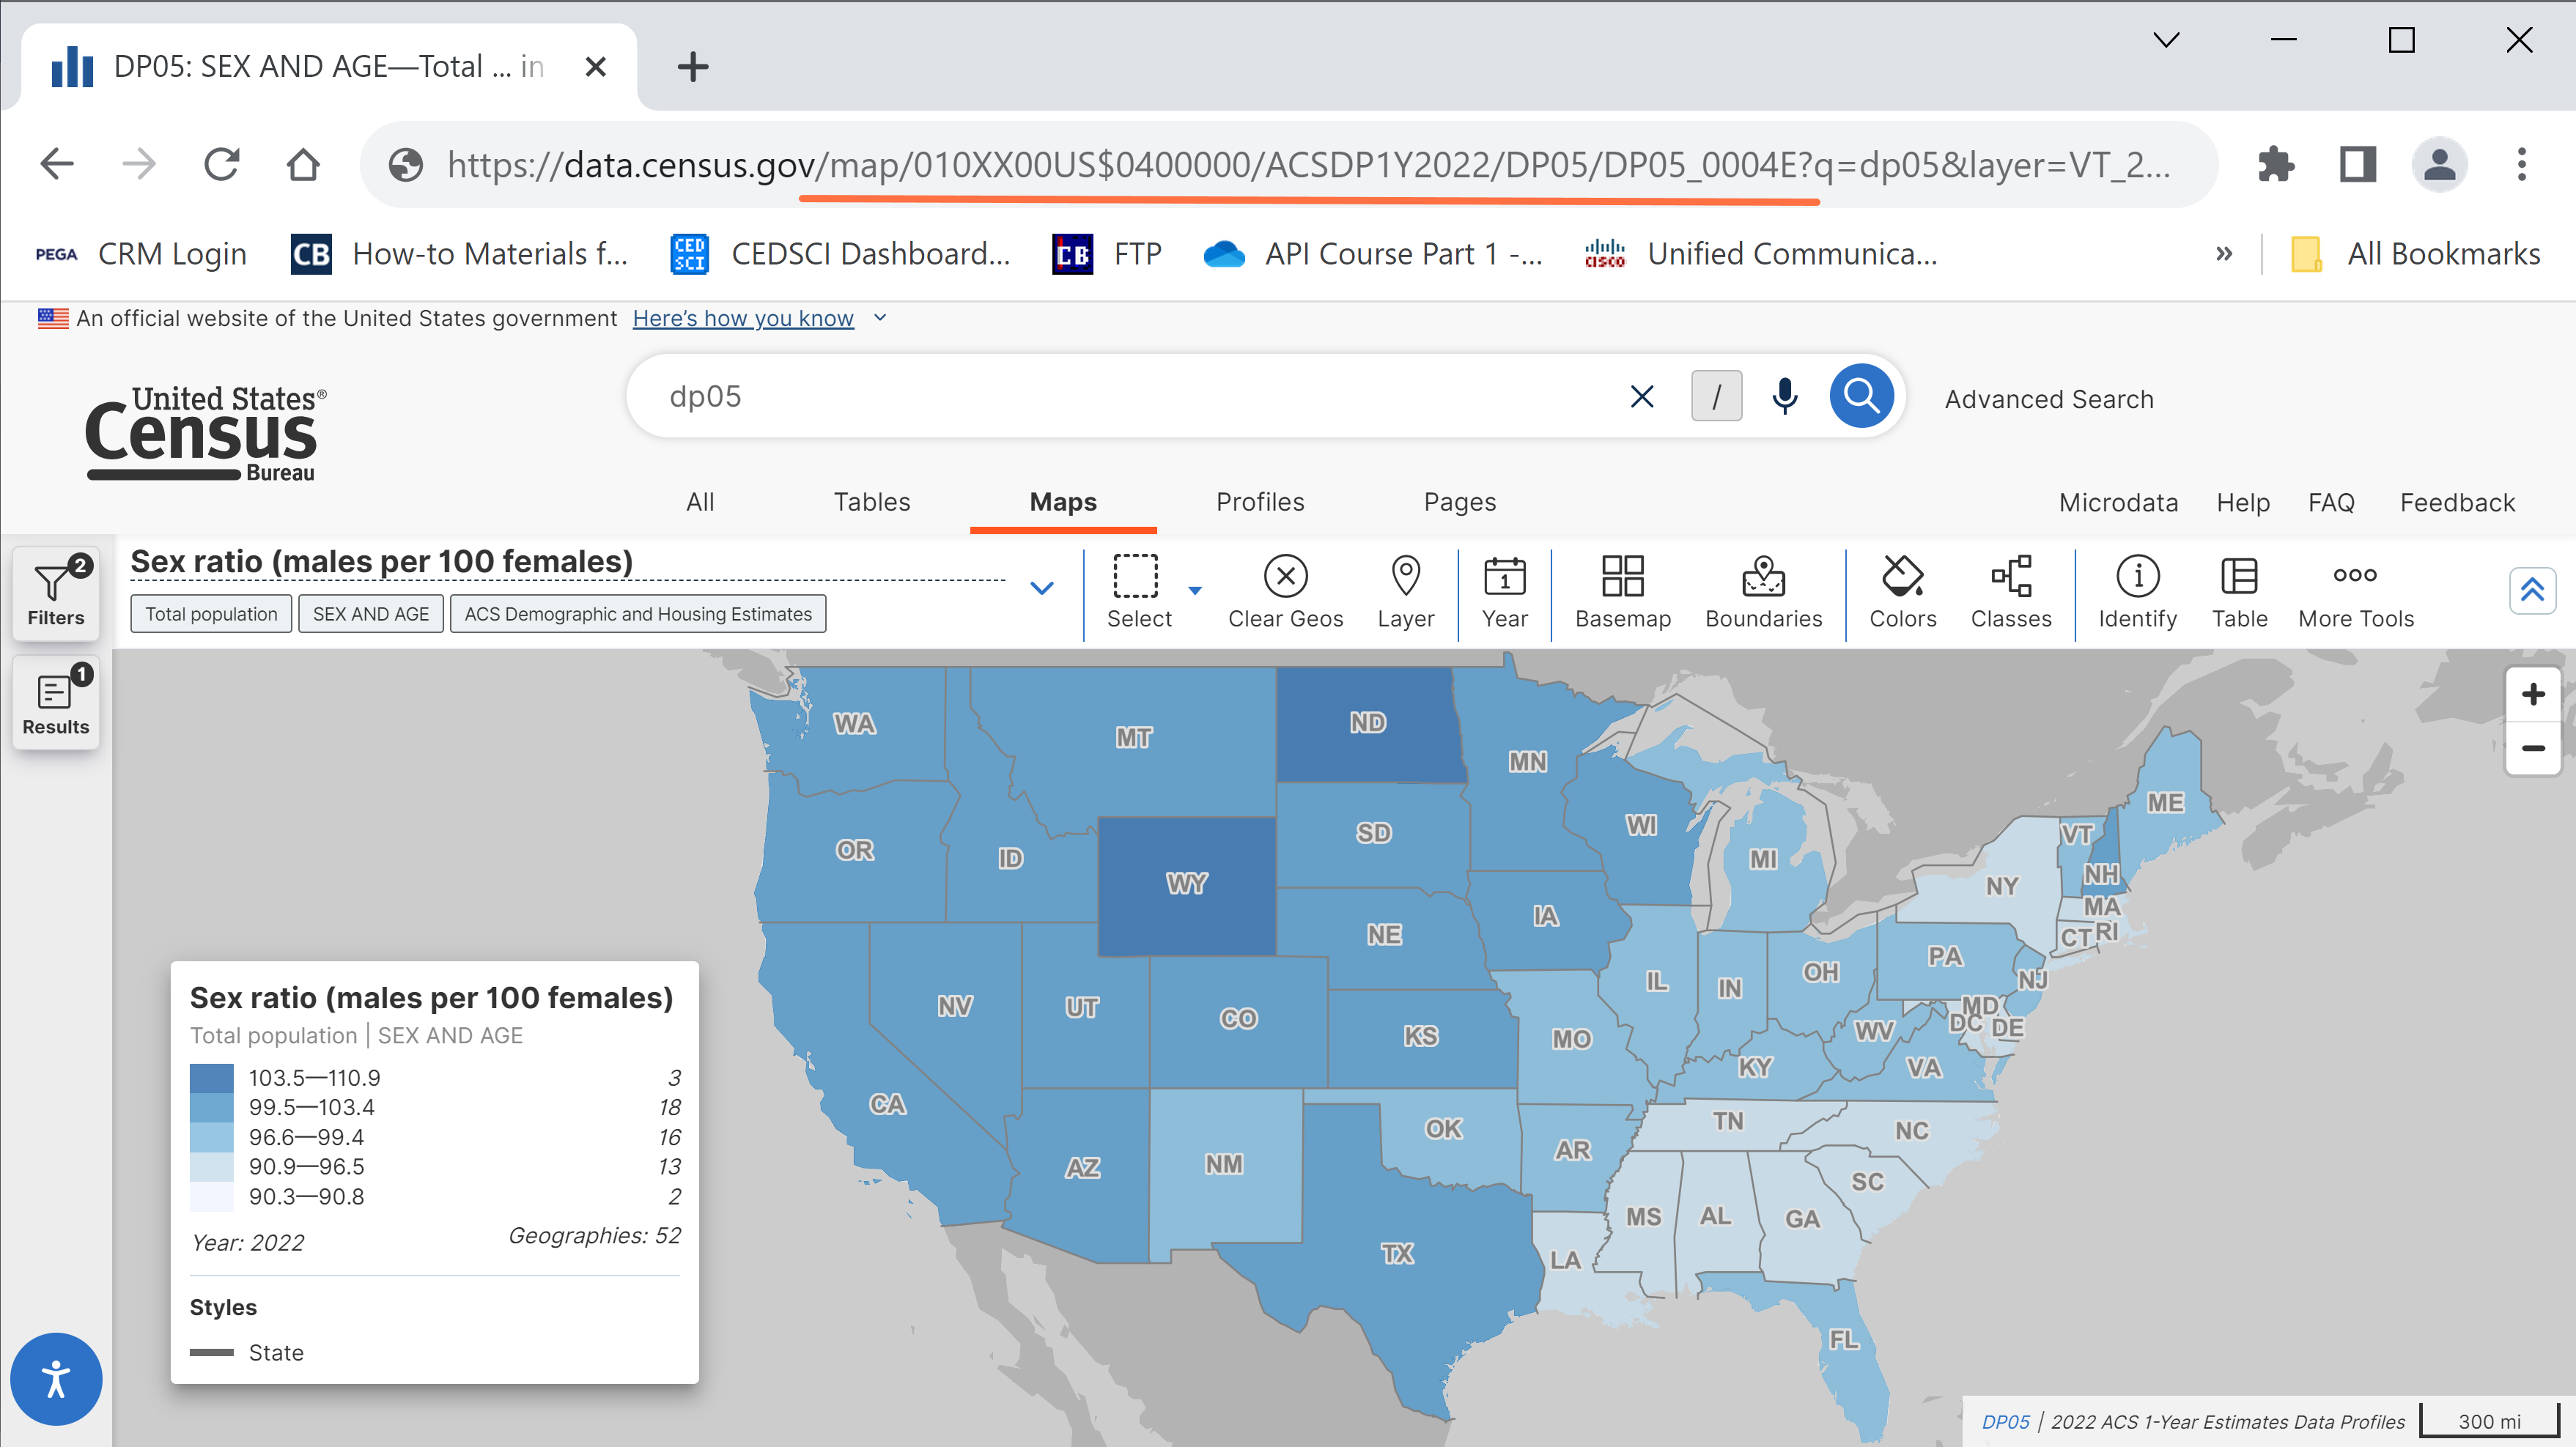
The purpose of this update is to make map URLs readable to external search engines such as Google, so that they can better link to data.census.gov content. Previous links to data.census.gov maps using the old URL structure will continue to function.
- Technical updates to the data.census.gov sitemap, which is used by search engines to recognize data.census.gov content.
- More behind-the-scenes work to improve the future layout of table notes, which will allow you to navigate to different sections of the notes with a single click.
- Technical updates to improve analytics for data.census.gov. These updates allow internal staff to determine how often specific features and searches are used to better inform decision-making and future updates to the site.
- Fixes to 18 defects, including fixes that allow you to:
- Scroll through the pop-up window after clicking the “Classes” button from the maps.
- View maps for the selected geographic area in Geography Profiles.
- Access geography filters for places when viewing table S0506.
- View relevant results when searching with the phrase “county of.”
- Select ZIP Code filters after selecting the Zipcode Business Patterns filter.