2022
2022
In late January, we released the following updates to the site:
- Map improvements that allow you to:
o Center a map on a particular location. The URL now includes the latitude and longitude for the point the map is centered on, along with the zoom level. This allows you to share links to maps that are centered on a location.
Here is a map link centered on the Census Bureau headquarters with a zoom level of 15: data.census.gov/cedsci/map?mode=selection&vintage=2020&layer=VT_2020_050_00_PY_D1&loc=38.8441,-76.9305,z15.0000
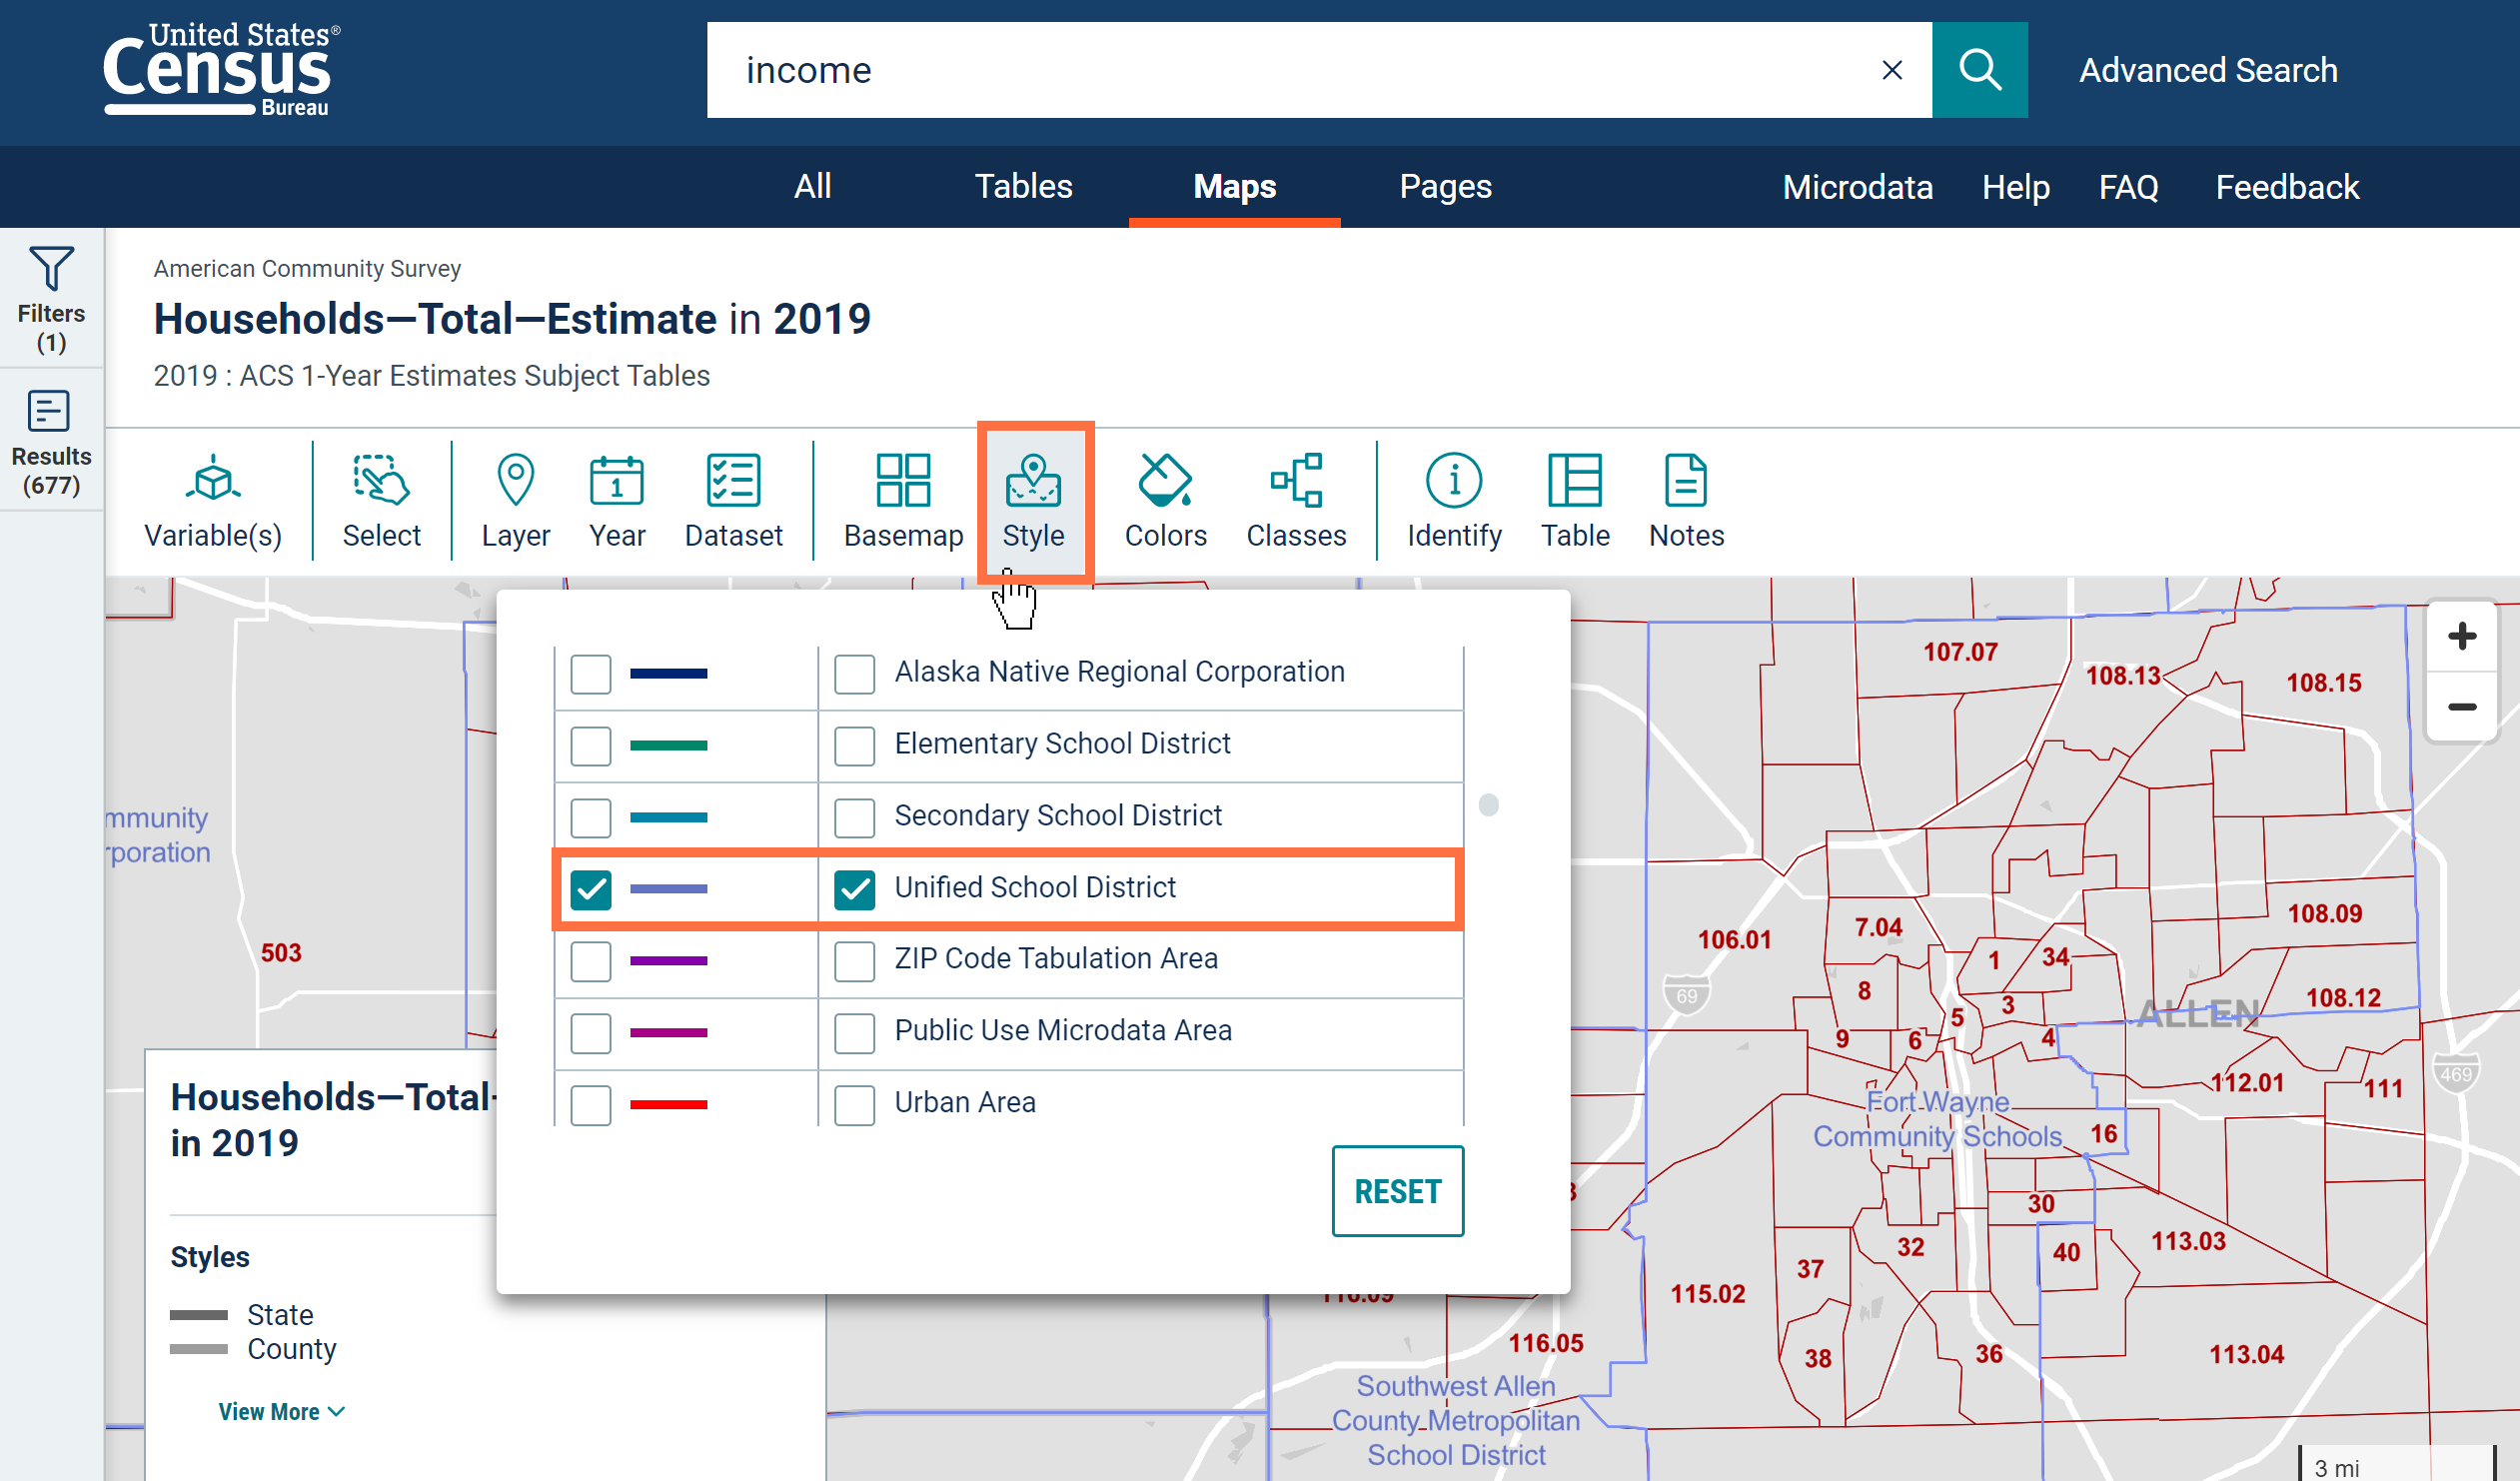
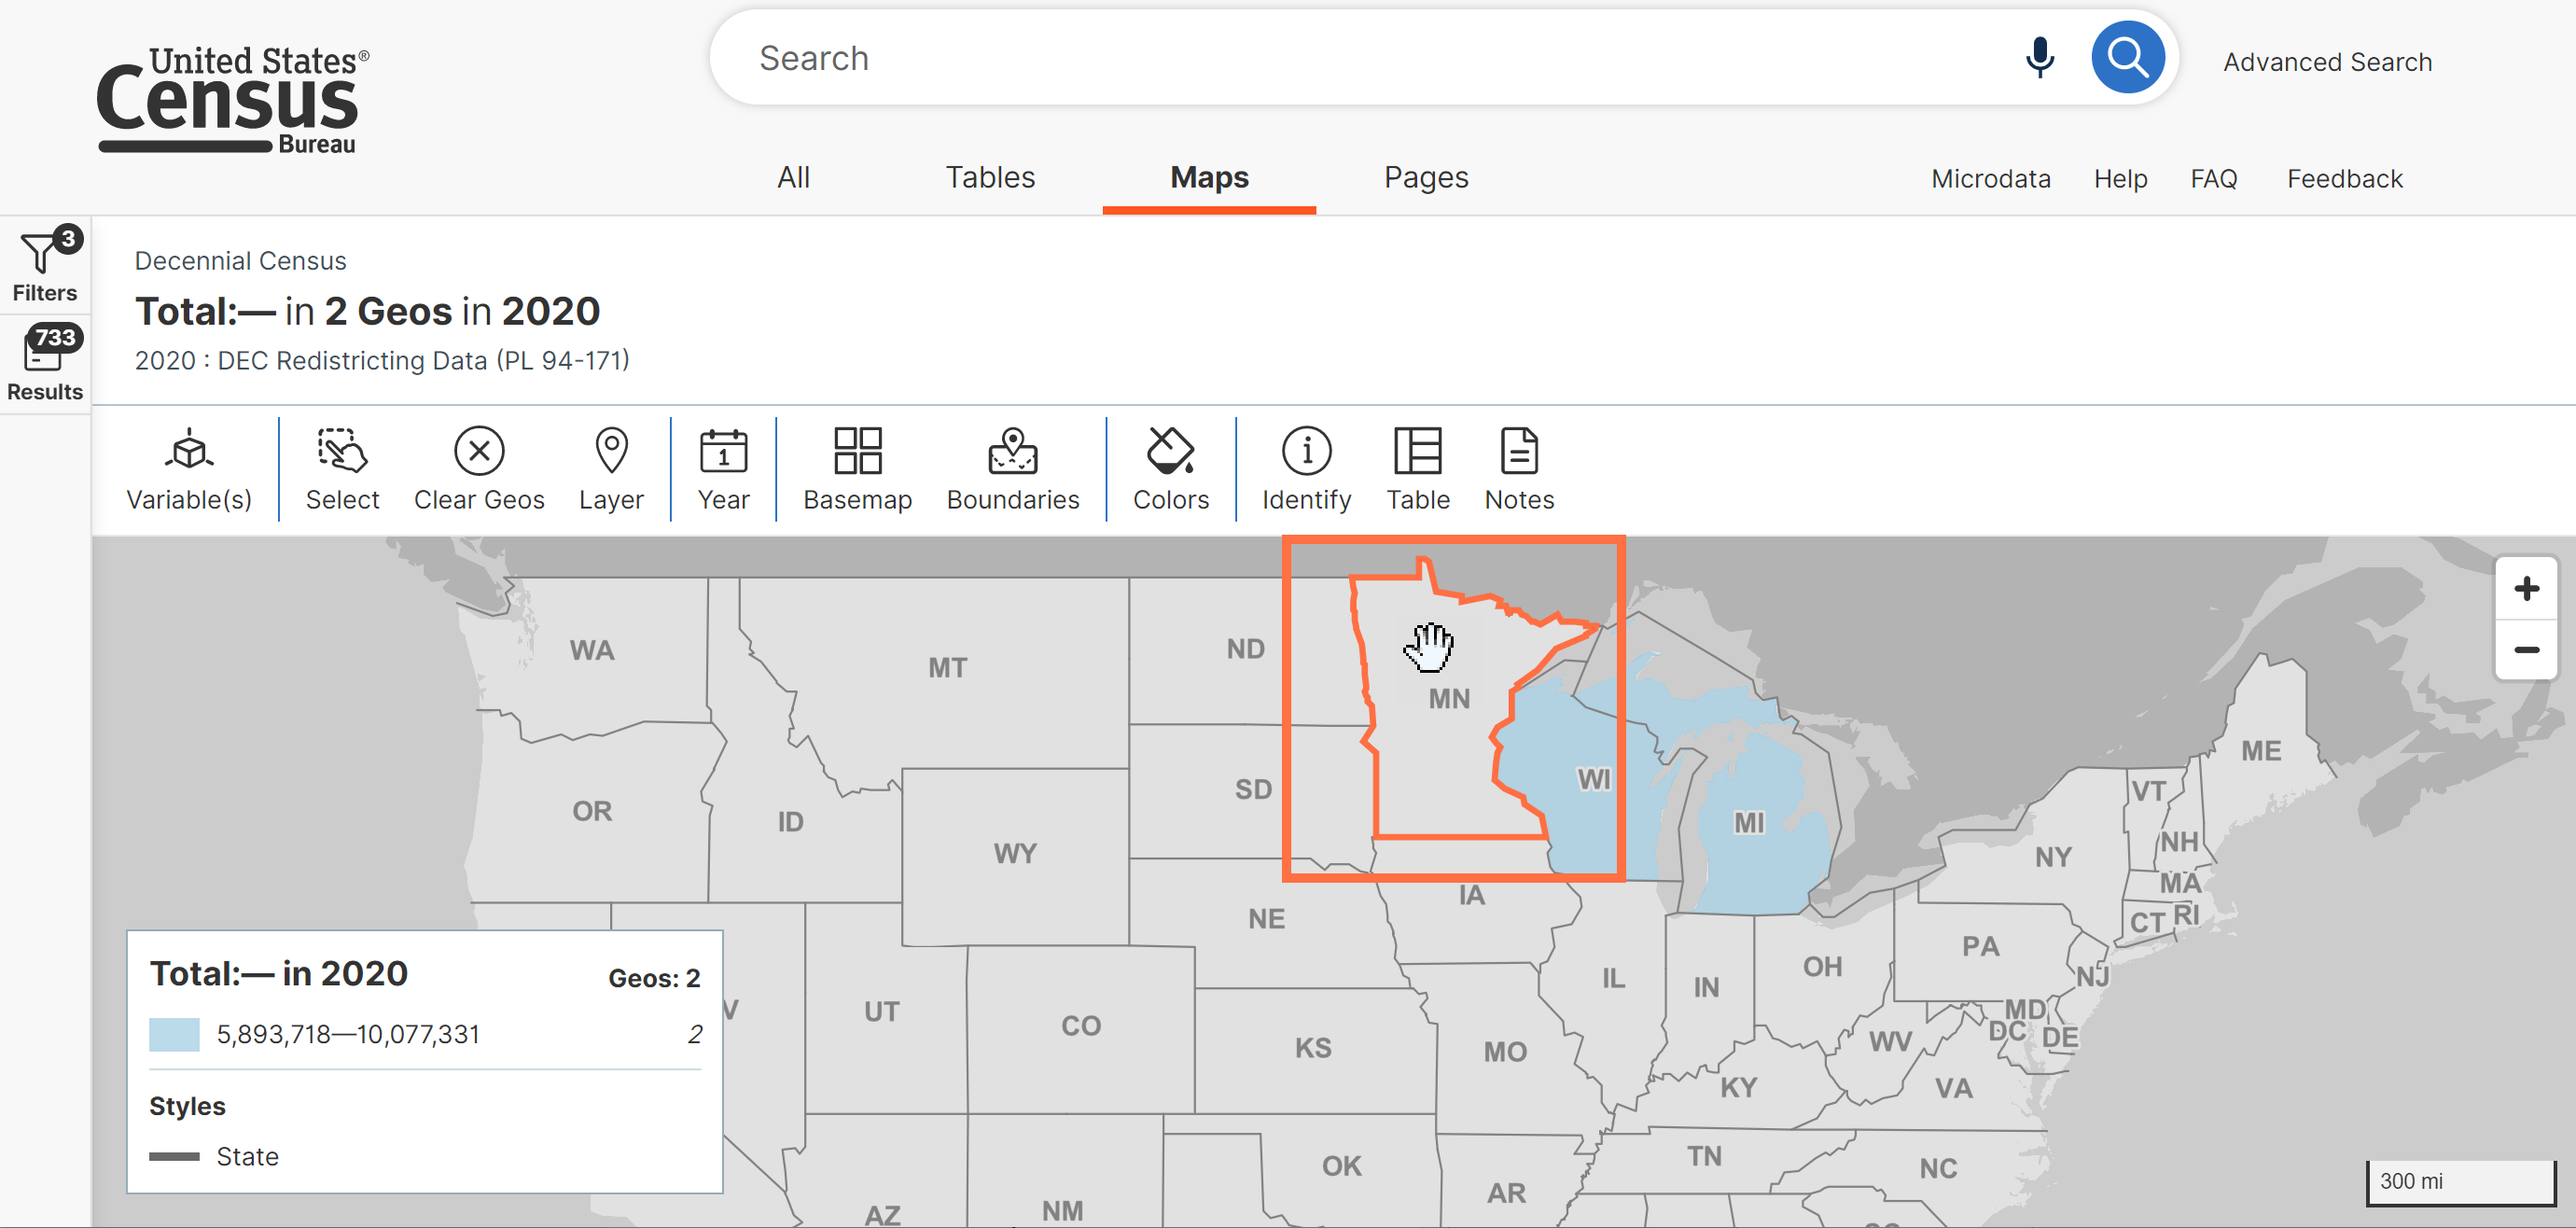
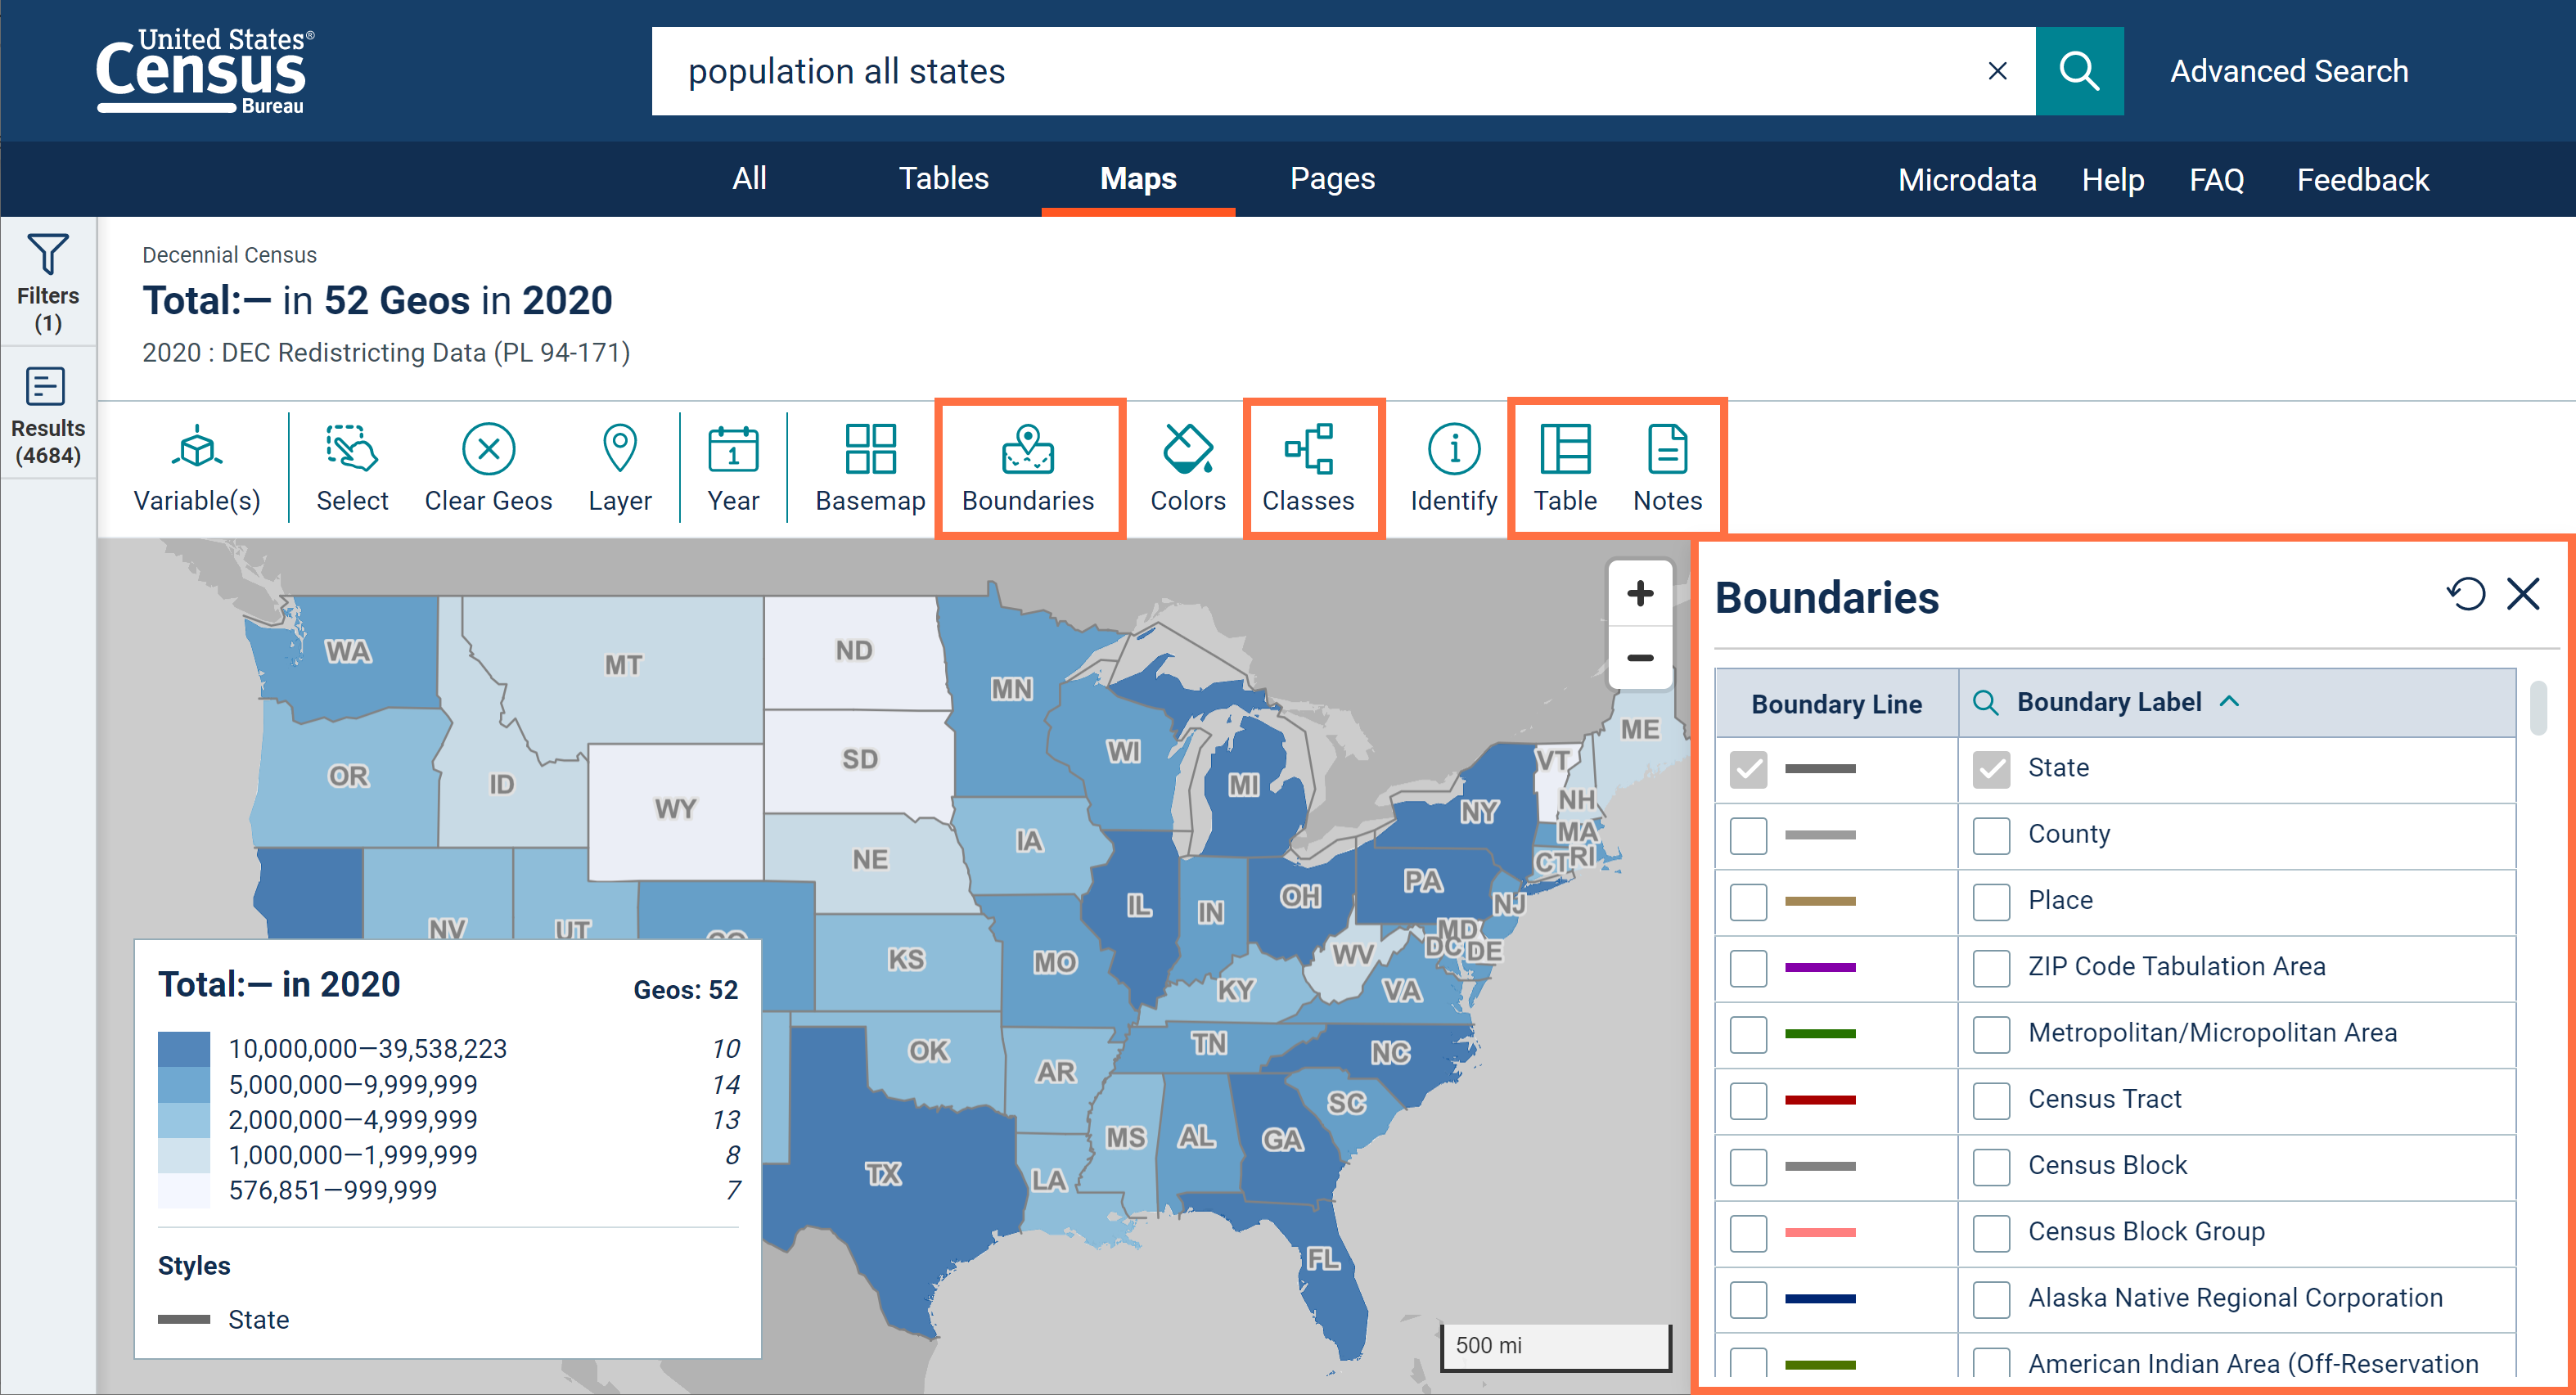
o View boundaries for more than one type of geographic area at the same time. To see multiple boundaries, click the “Style” button at the top of the map and mark the check boxes for any additional boundaries or labels you would like to see on your map.
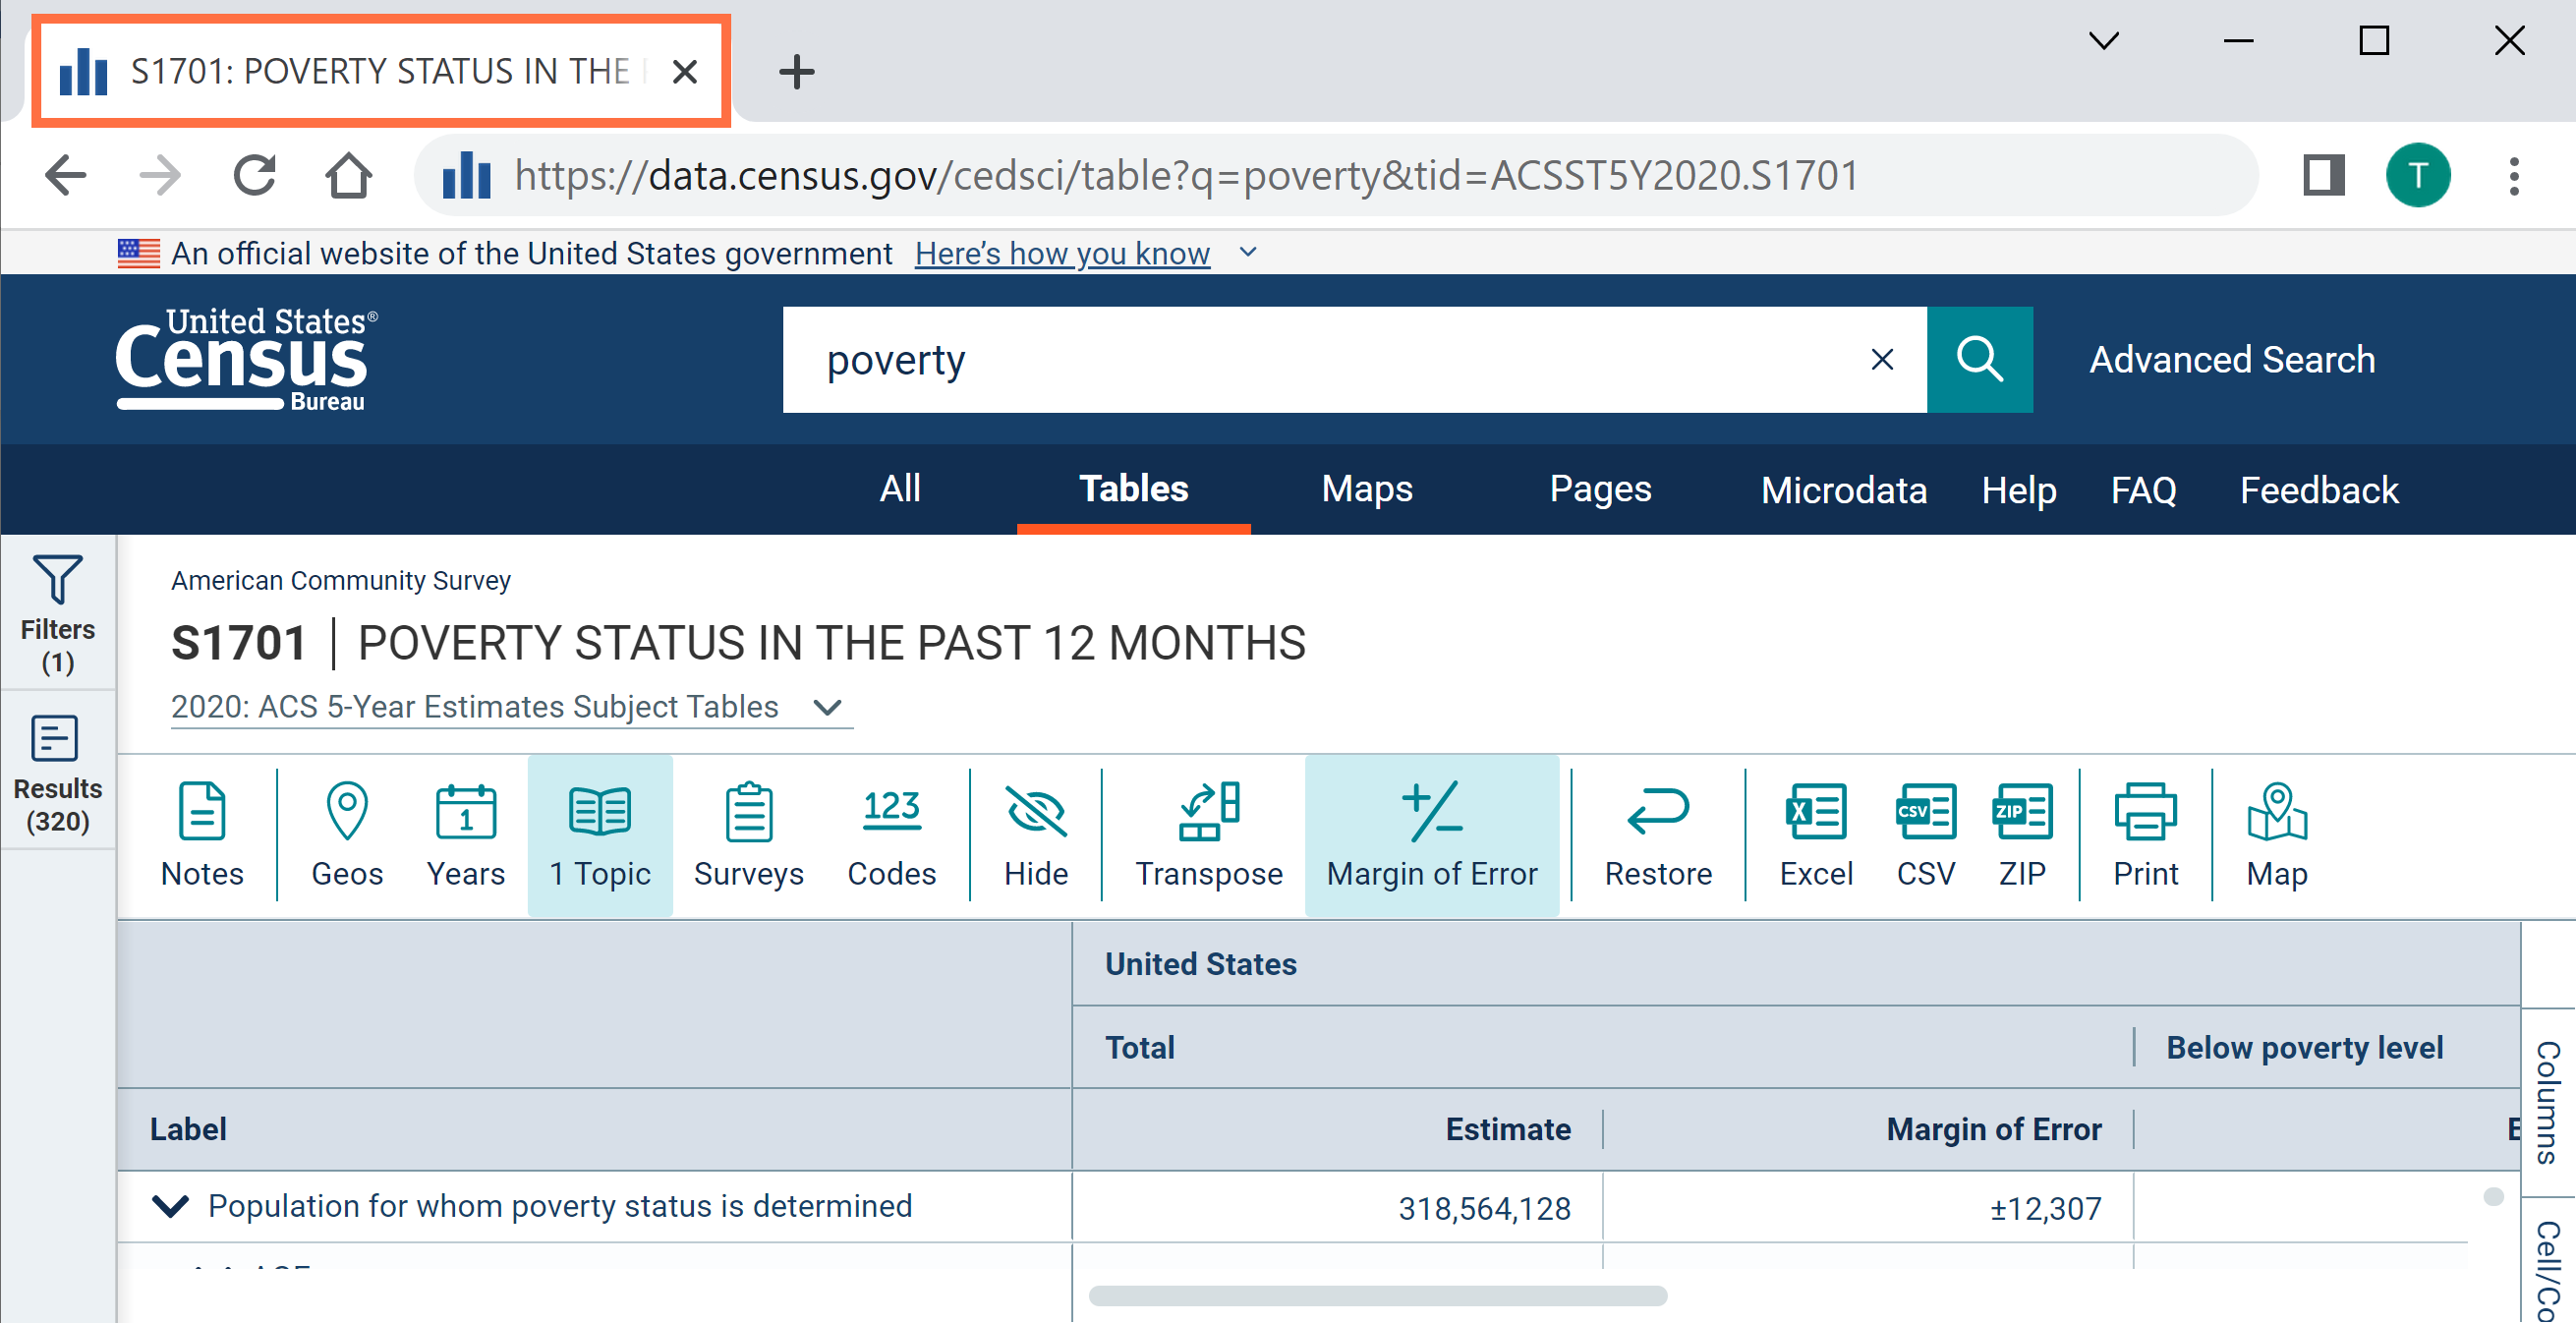
o Click the map to identify a list of geographic information for that point on the map. This shows a list of the specific geography names and codes the point belongs to.
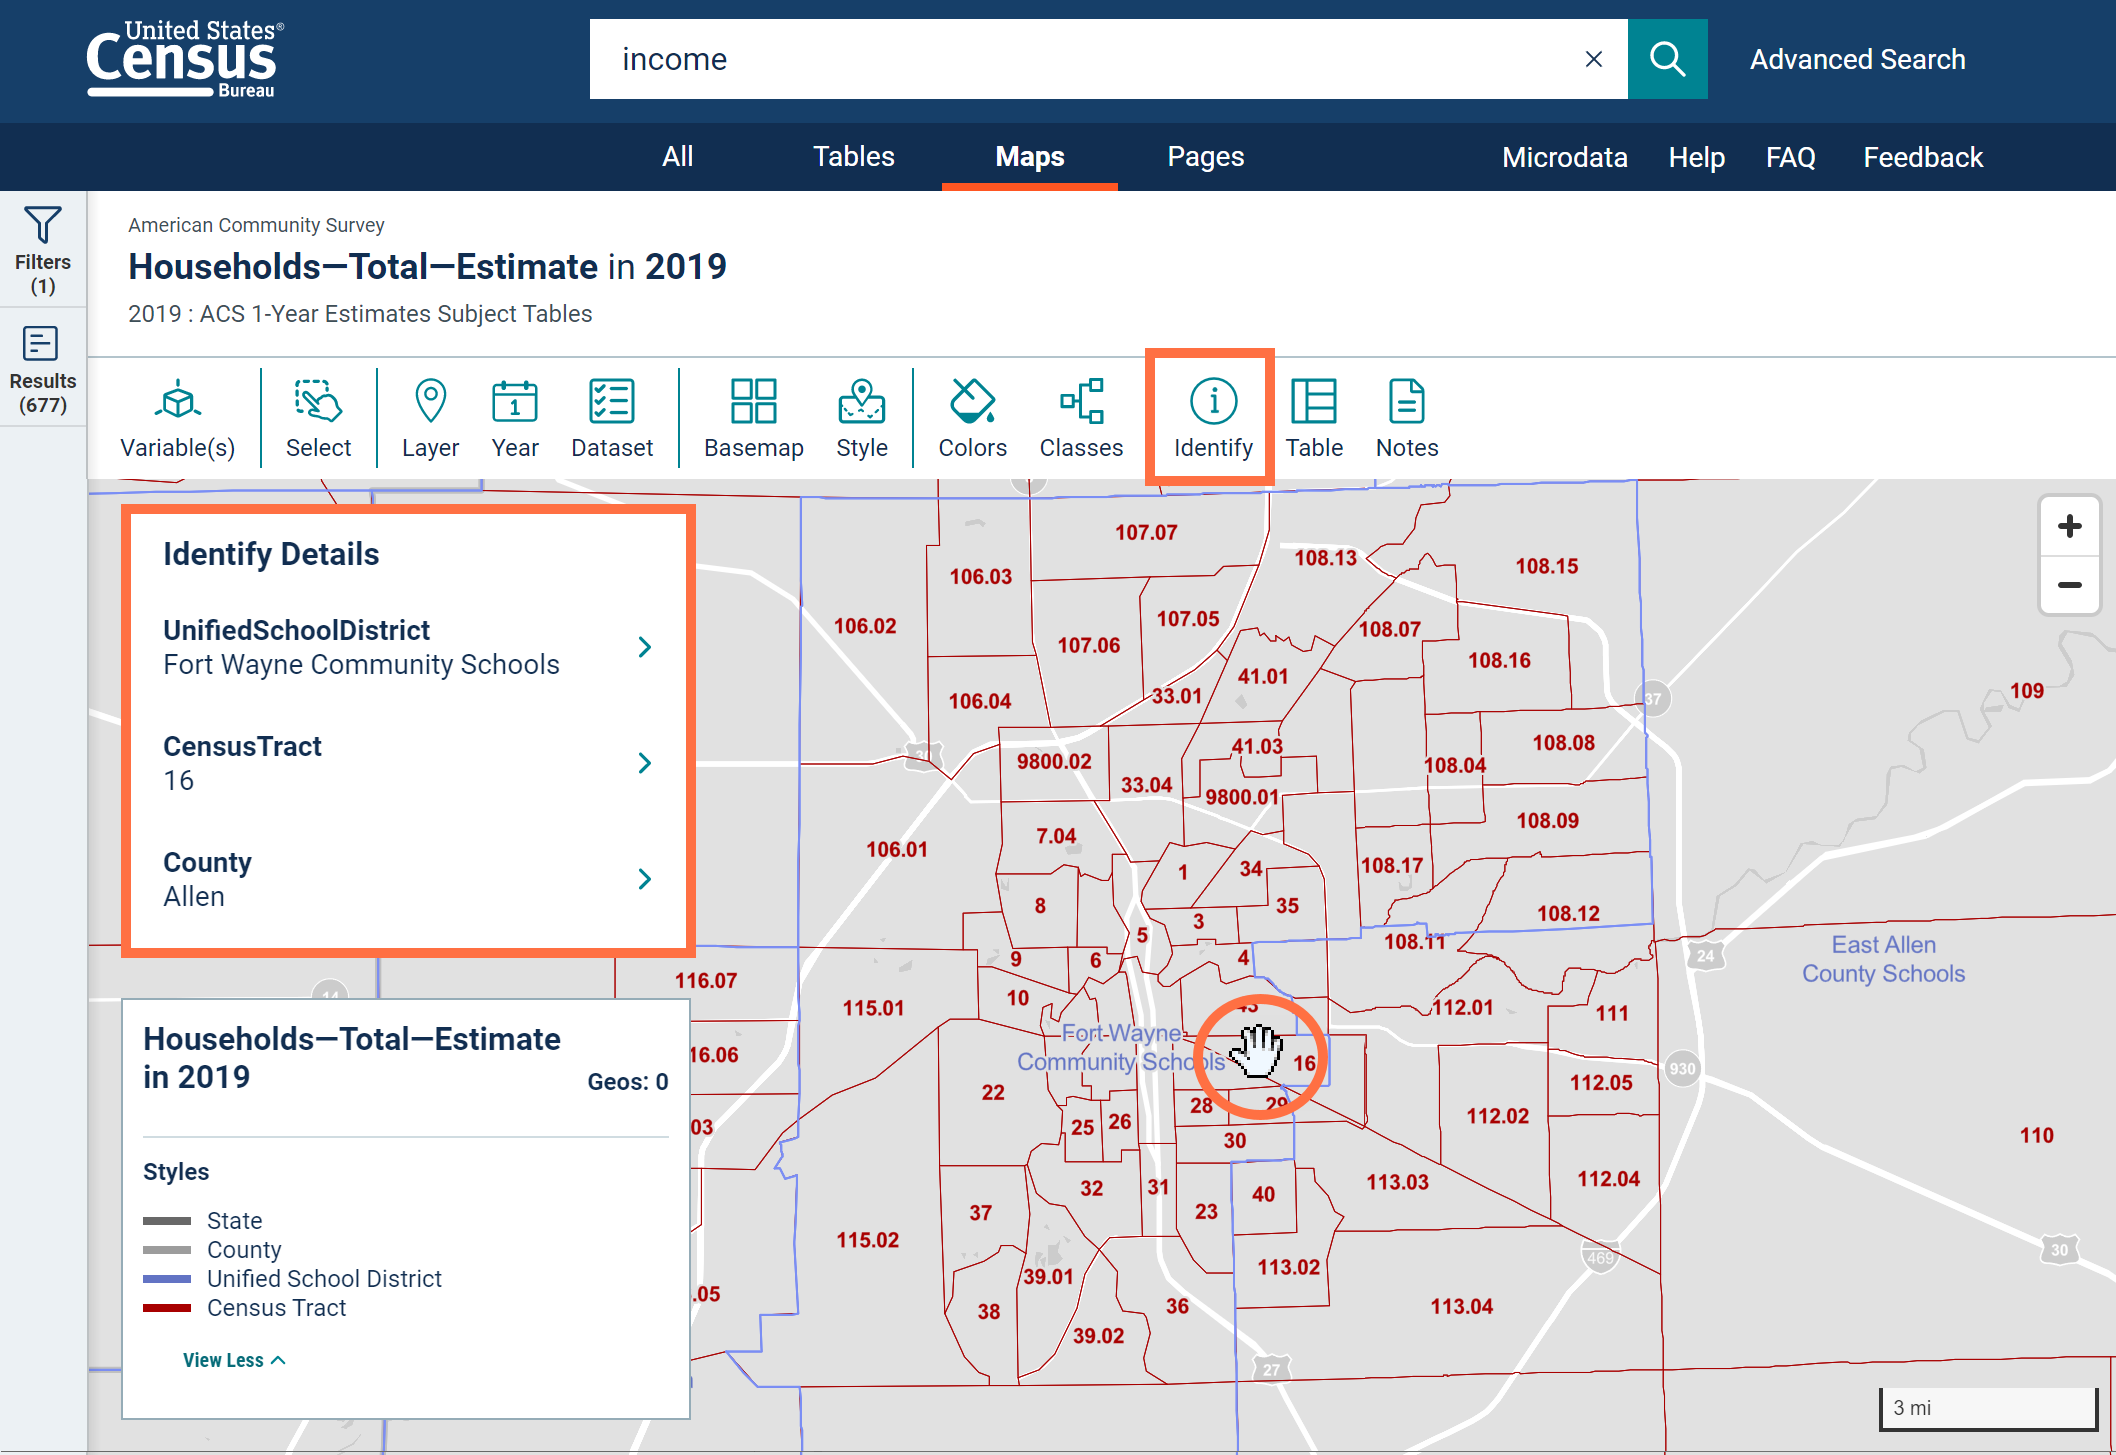
To see details for other types of geographies that this point falls within, enable more “Styles” or boundaries for your map before clicking the Identify button.
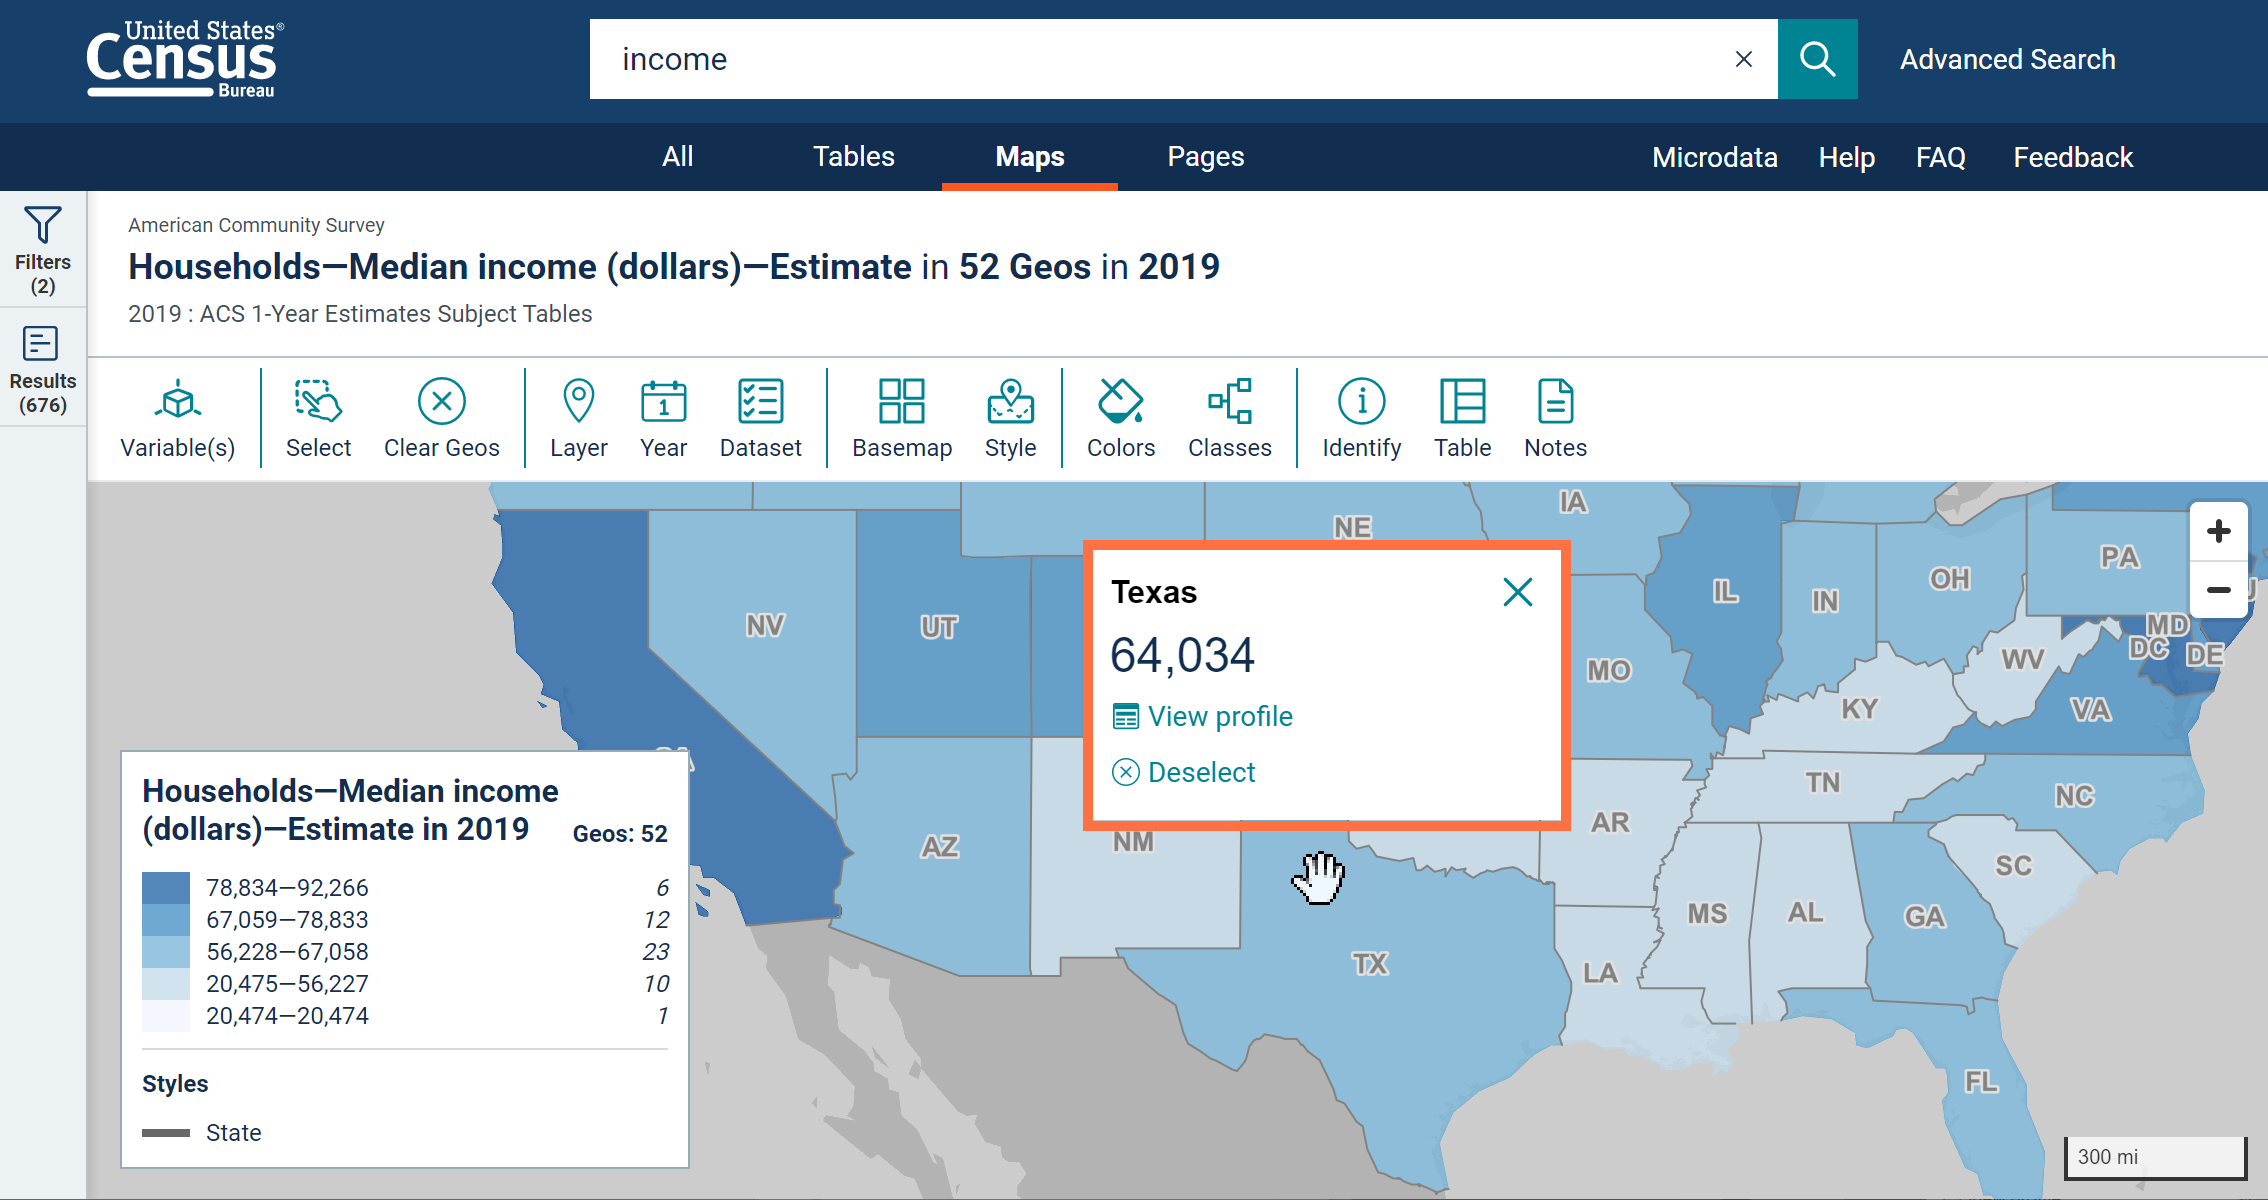
o View updated tool tips when clicking on the map. It shows the data value more prominently and shows profile links for supported geographies.
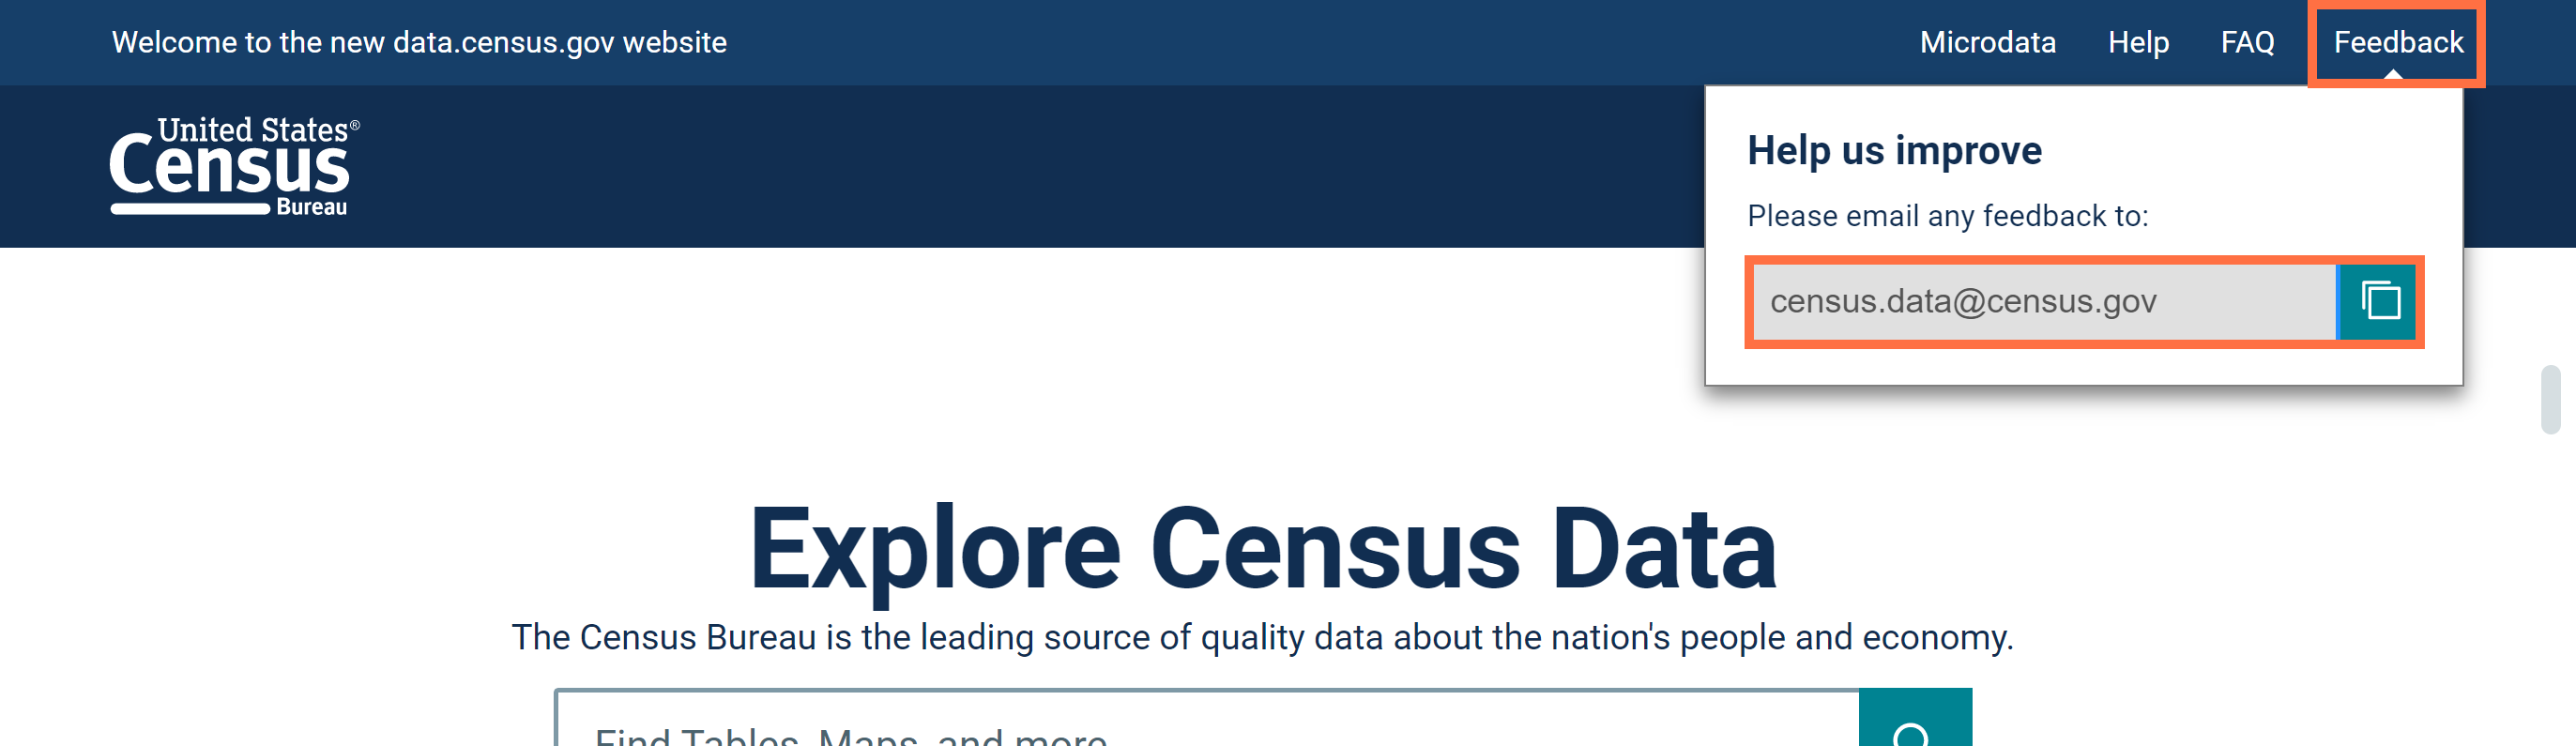
- Updated email address to send feedback and data questions: [email protected]
- Behind the scenes technical updates to improve data visualization and source statement capabilities for Geography and Industry Profiles.
- Fixes to 15 defects, including fixes that allow you to:
- Use buttons at the top of the map that are responsive to your selections
- View the full table notes
- Download individual records from Microdata Access
In early January, we released the following updates to the site:
- Technical updates to the search software.
- Fixes to 2 defects, including a fix that allows you to see relevant data when searching for per capita income.
On Feb 10, we released the following updates to the site:
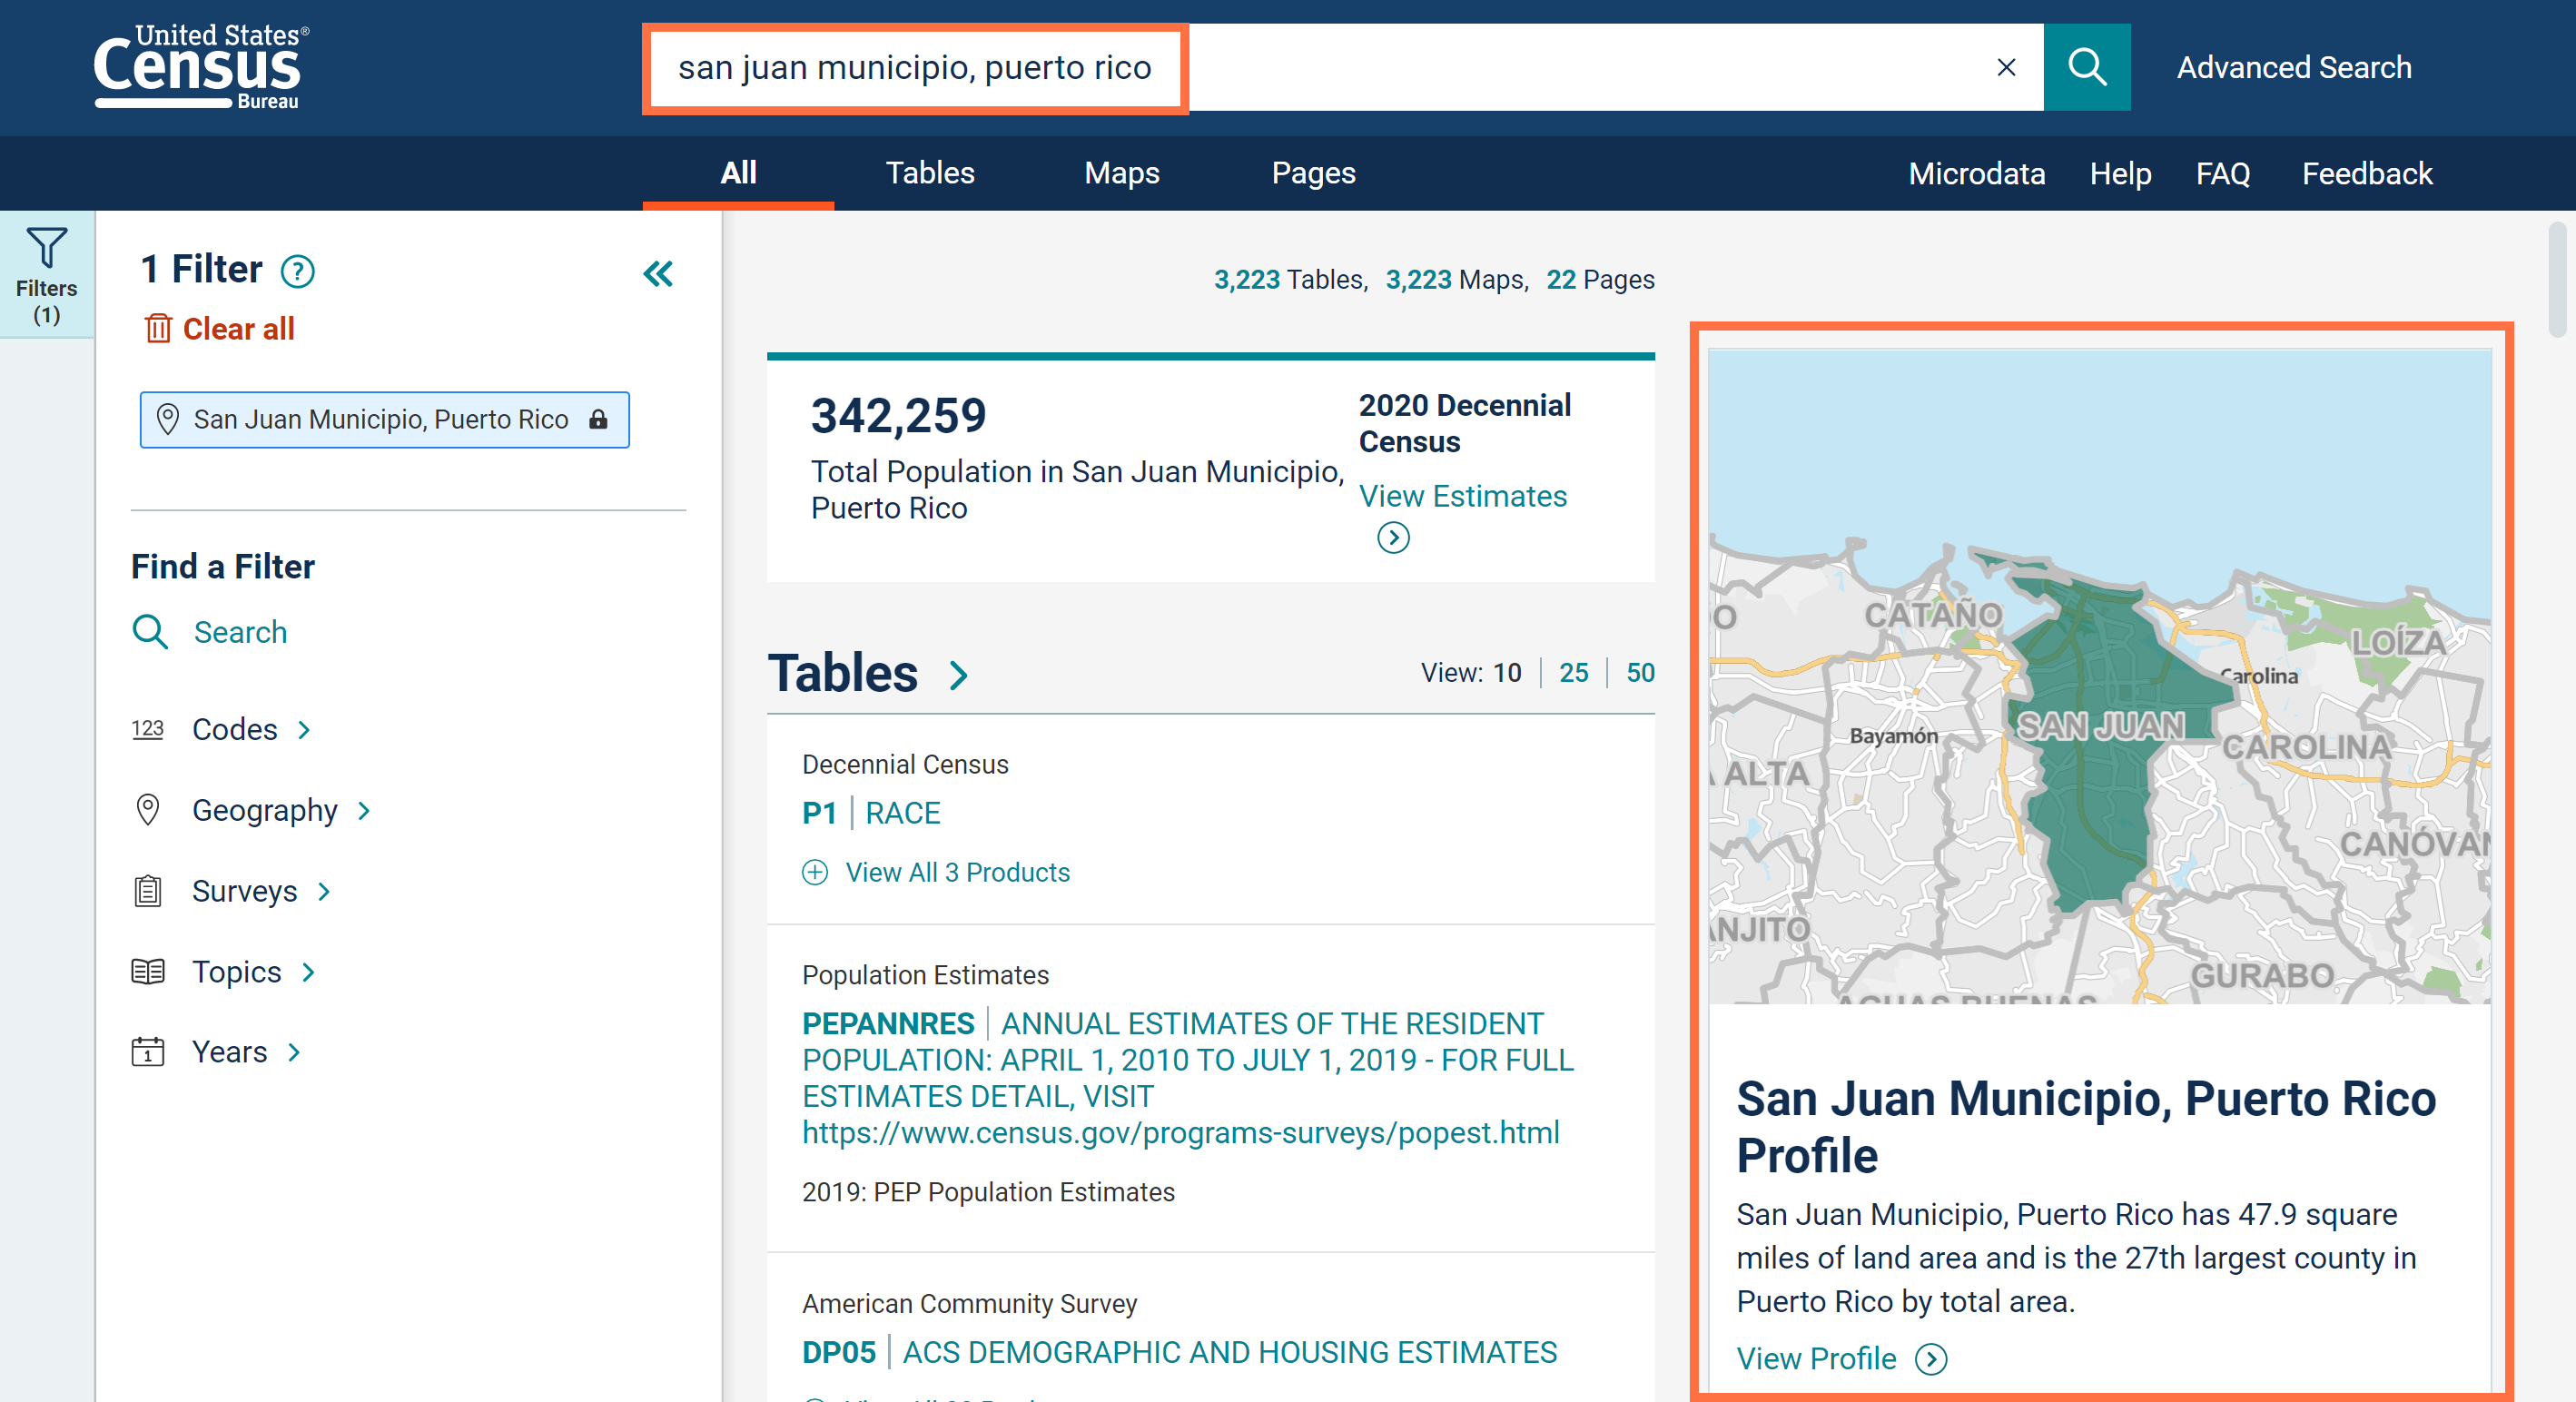
- Geography Profiles for Puerto Rico. For the first time, you can access profile pages for Puerto Rico geographies, allowing you to explore data across a variety of topics to see the most popular data, maps, and charts in one place. These profiles are now available for:
- Puerto Rico
- Municipios (county-equivalent)
- Barrios, barrios-pueblo, and other subdivision areas (county subdivisions)
- Zonas urbanas and comunidades (places)
To access a Geography Profile, run a search for a single geography such as “San Juan municipio, Puerto Rico” and then click the map on the right side of the “All” results page.
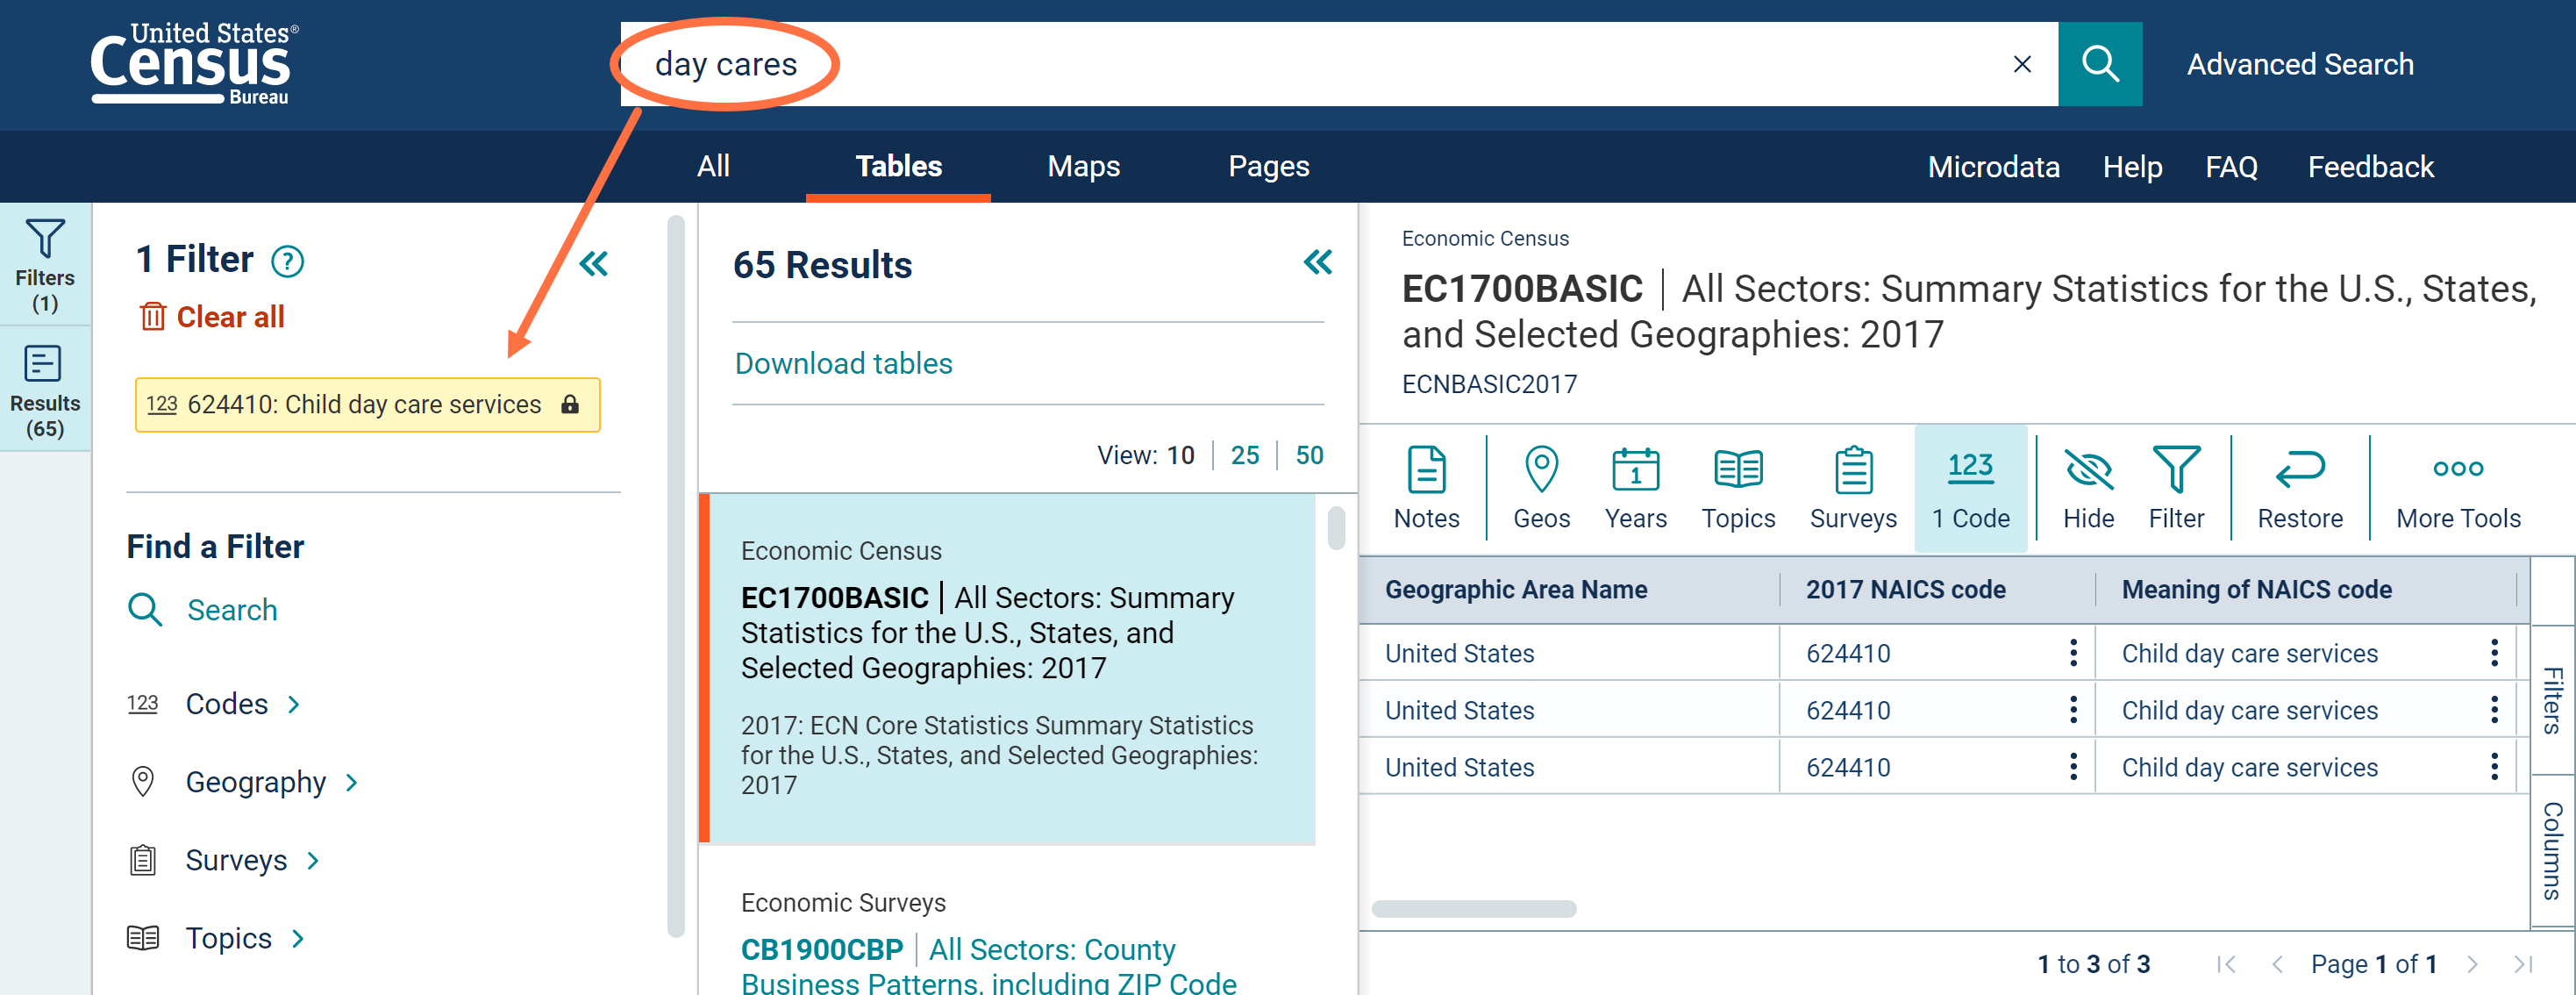
- Improved ability to search for partial labels for detailed population groups and North American Industry Classification System (NAICS) keywords in the single search bar.
For example, a single search for:- “Guamanian” will find the matching filter for “056-Guamanian or Chamorro alone”
- “Day cares” will find the matching filter for “624410: Child day care services”
As we continue to improve single search functionality in future releases, please keep in mind that the advanced search filters are the most precise way to select detailed search criteria, such industry codes and detailed population groups.
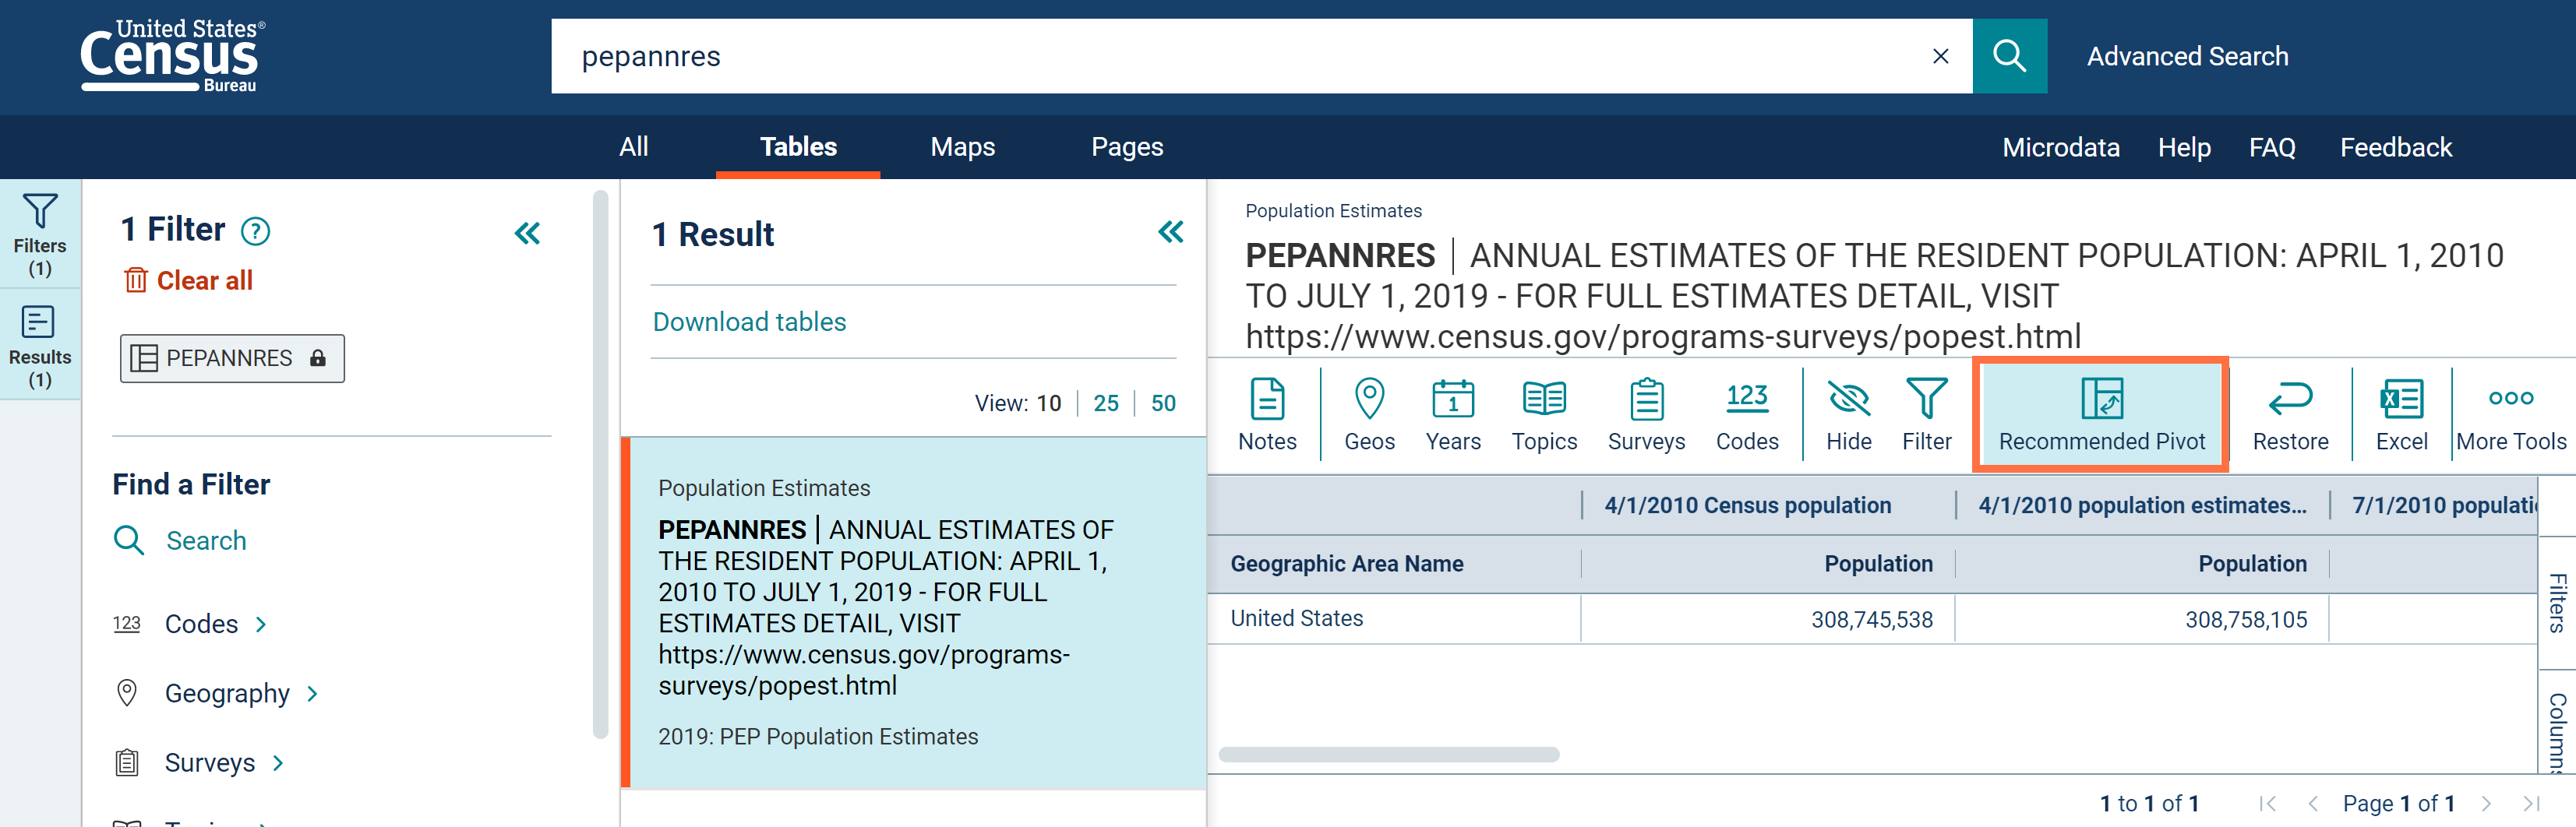
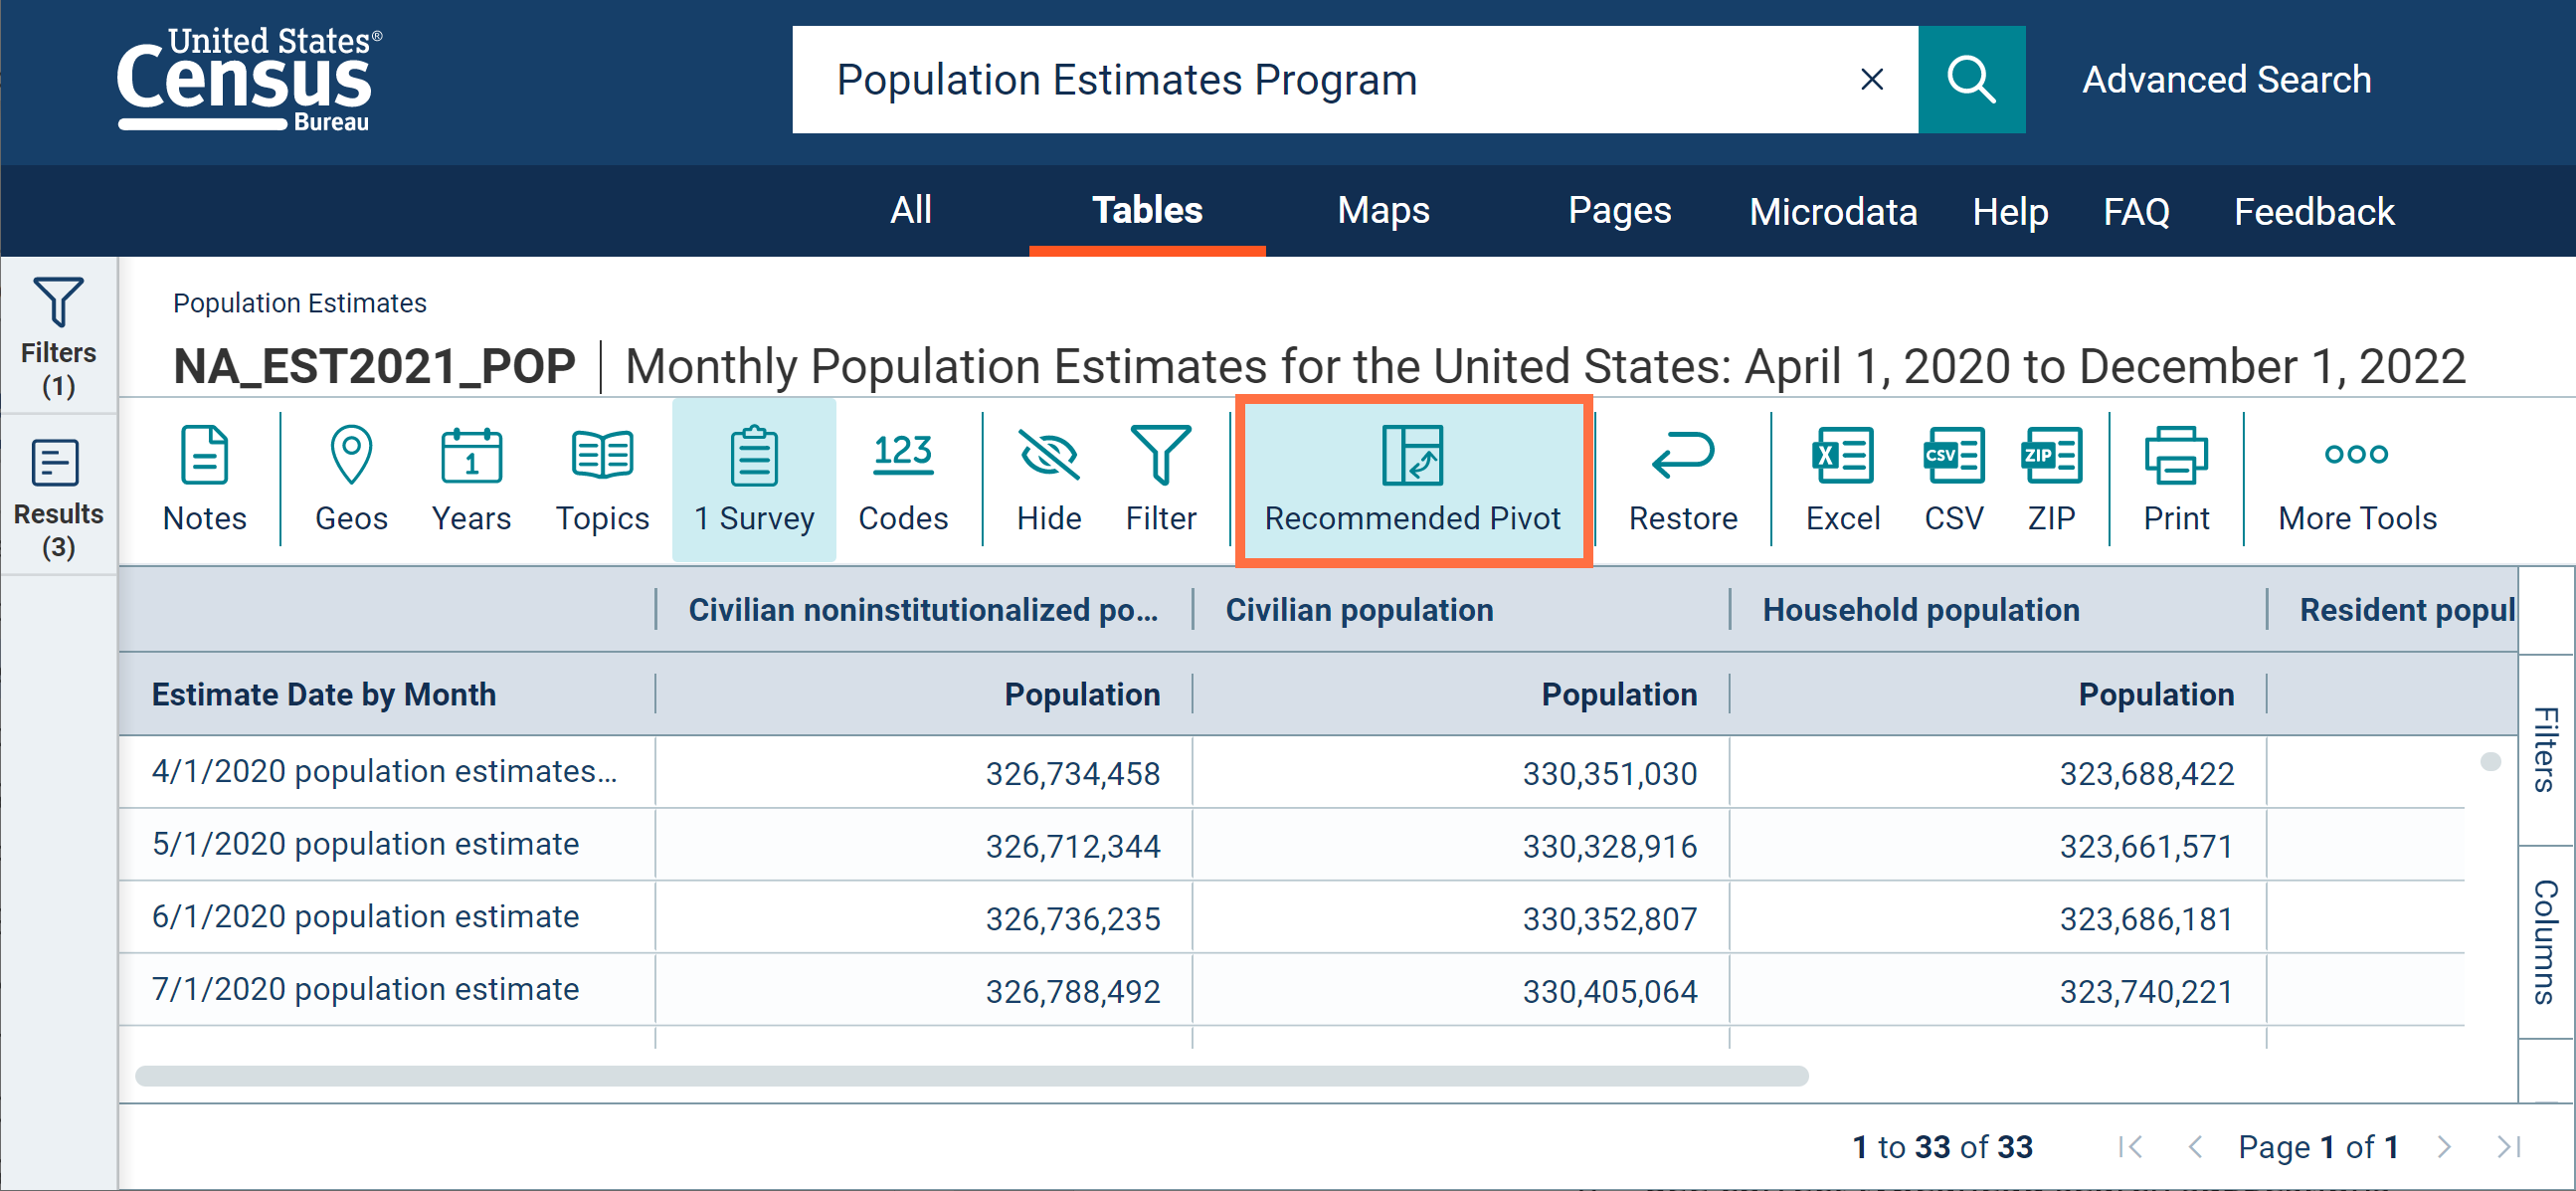
- Behind the scenes improvements that will make it easier to show more organized table views by default. This means that in future releases, you will see the “Recommended Pivot” button applied to more flat tables from datasets such as the Population Estimates Program, allowing you to view the information more easily.
- Fixes to 13 defects, including fixes that allow you to:
- Add a detailed EEO occupation code to your search after selecting the survey filter for “Equal Employment Opportunity”
- View featured results when searching common keywords
- View messages when tables are too large to display instead of experiencing continuous loading
- Use Microdata Access to recode a continuous variable into a single value
On March 10, we released the following updates to the site:
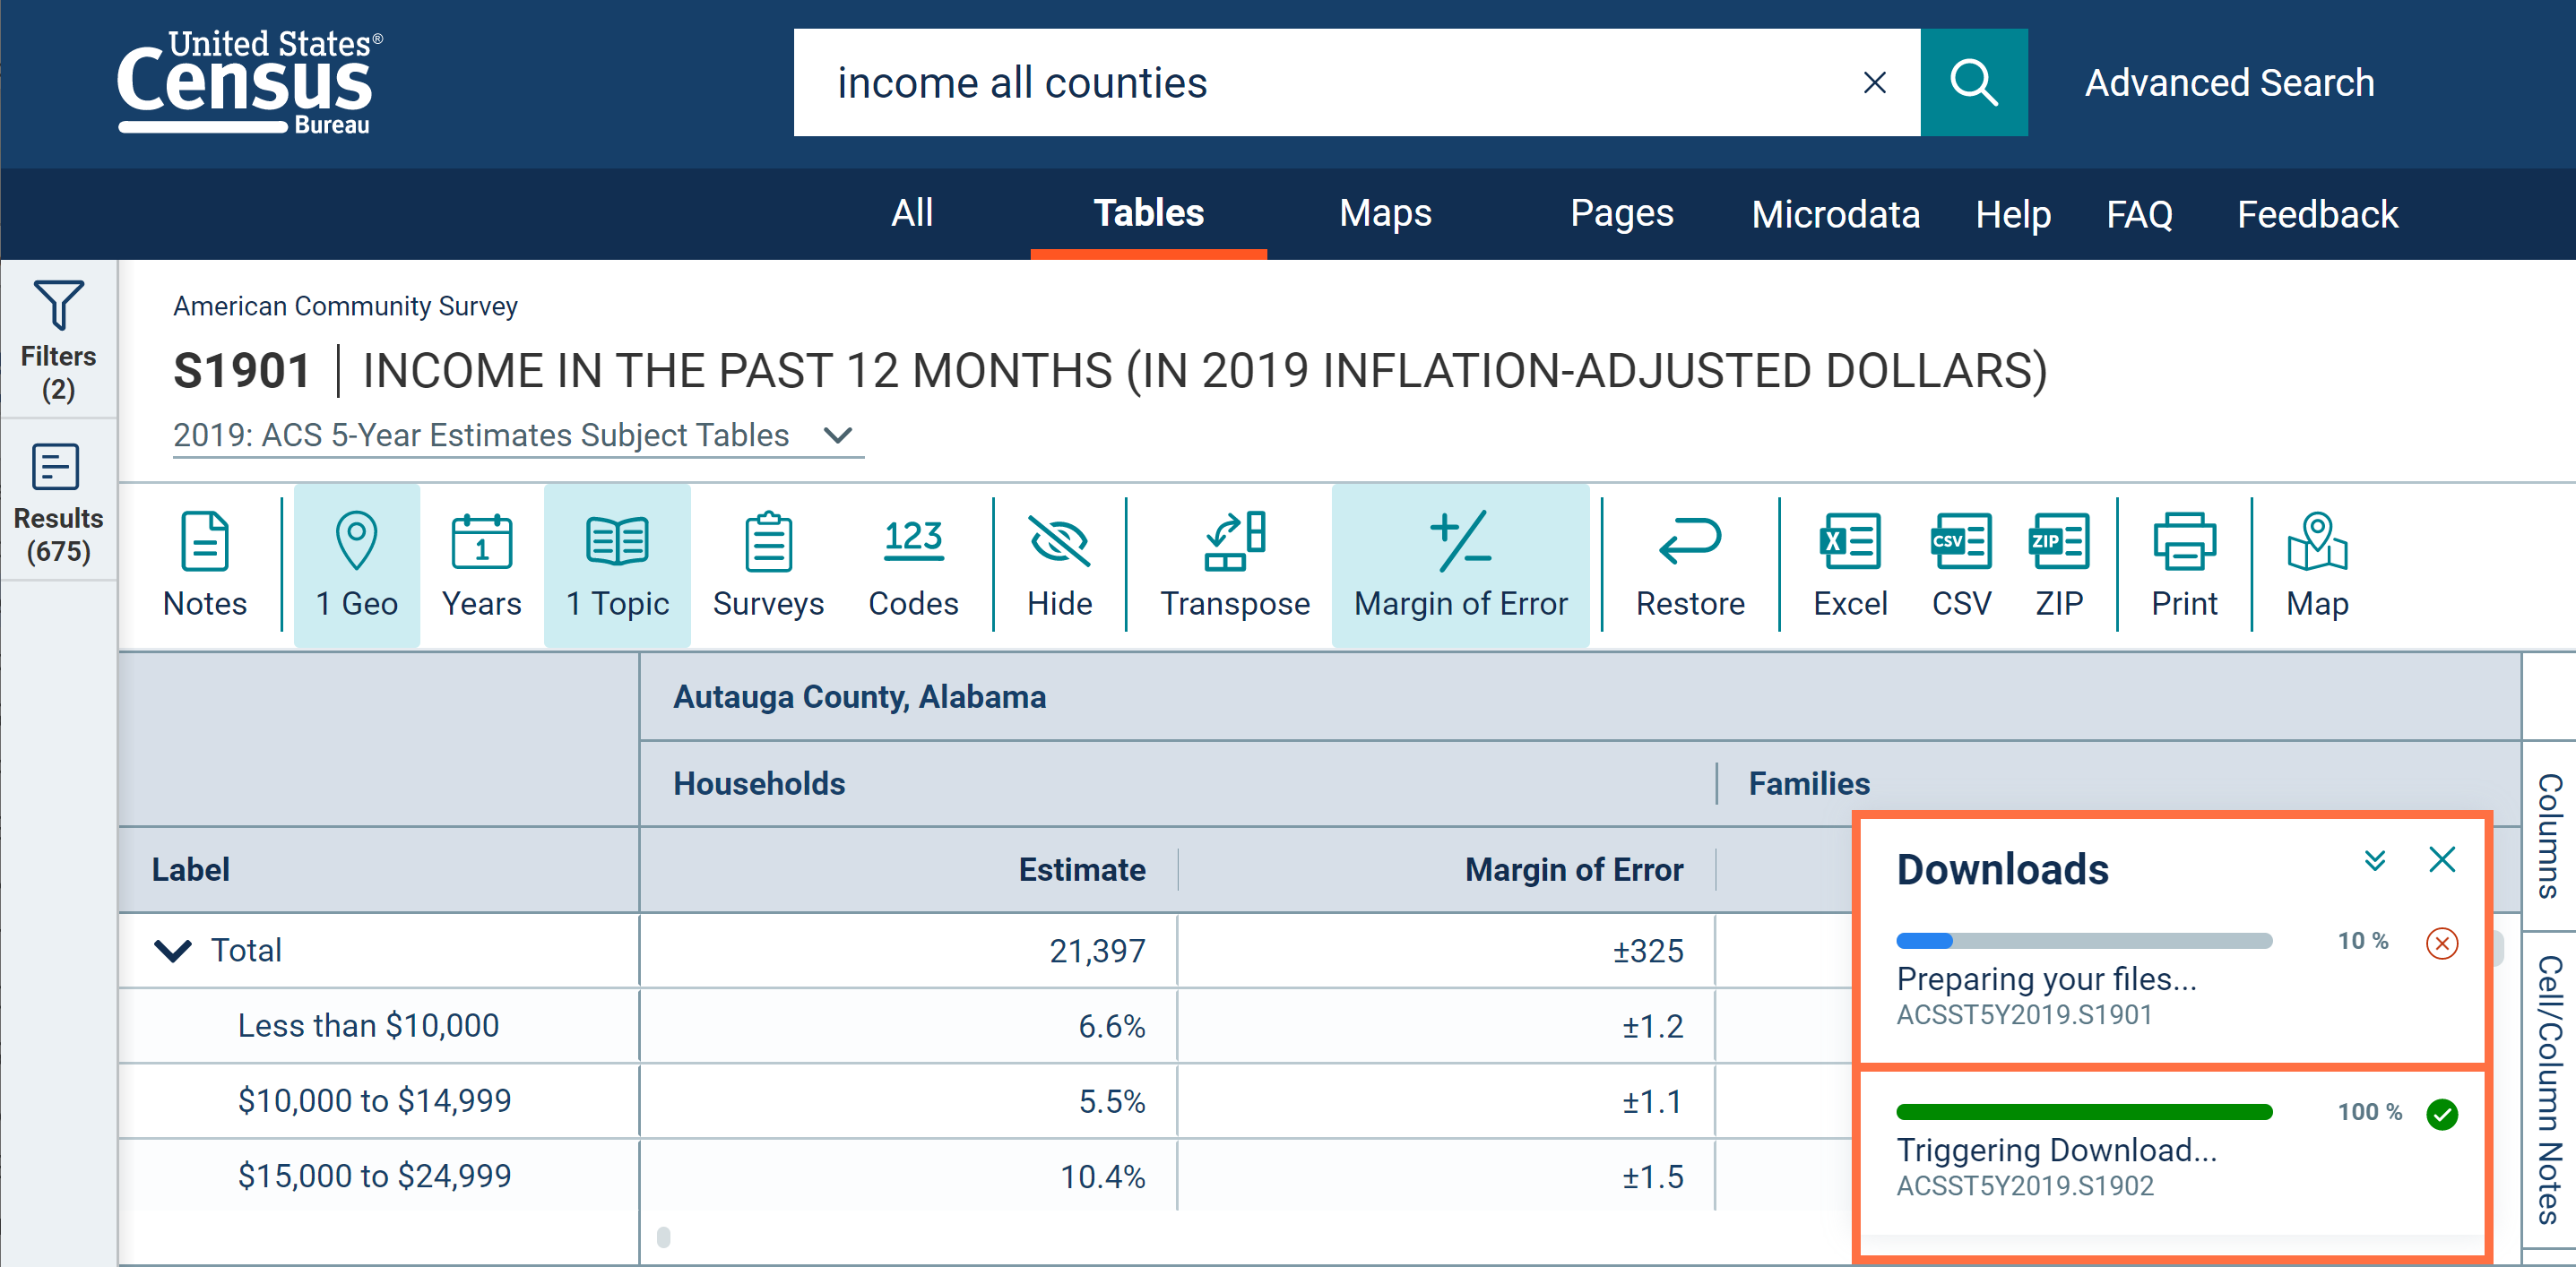
- Refreshed download experience that includes:
o New buttons at the top of the table for Excel, CSV, and ZIP.
■ Use Excel and CSV to get readable output that looks similar to the table display
■ Use ZIP to get machine-readable output. This provides the same result that you would previously get by clicking the “Download” button at the top of the table.
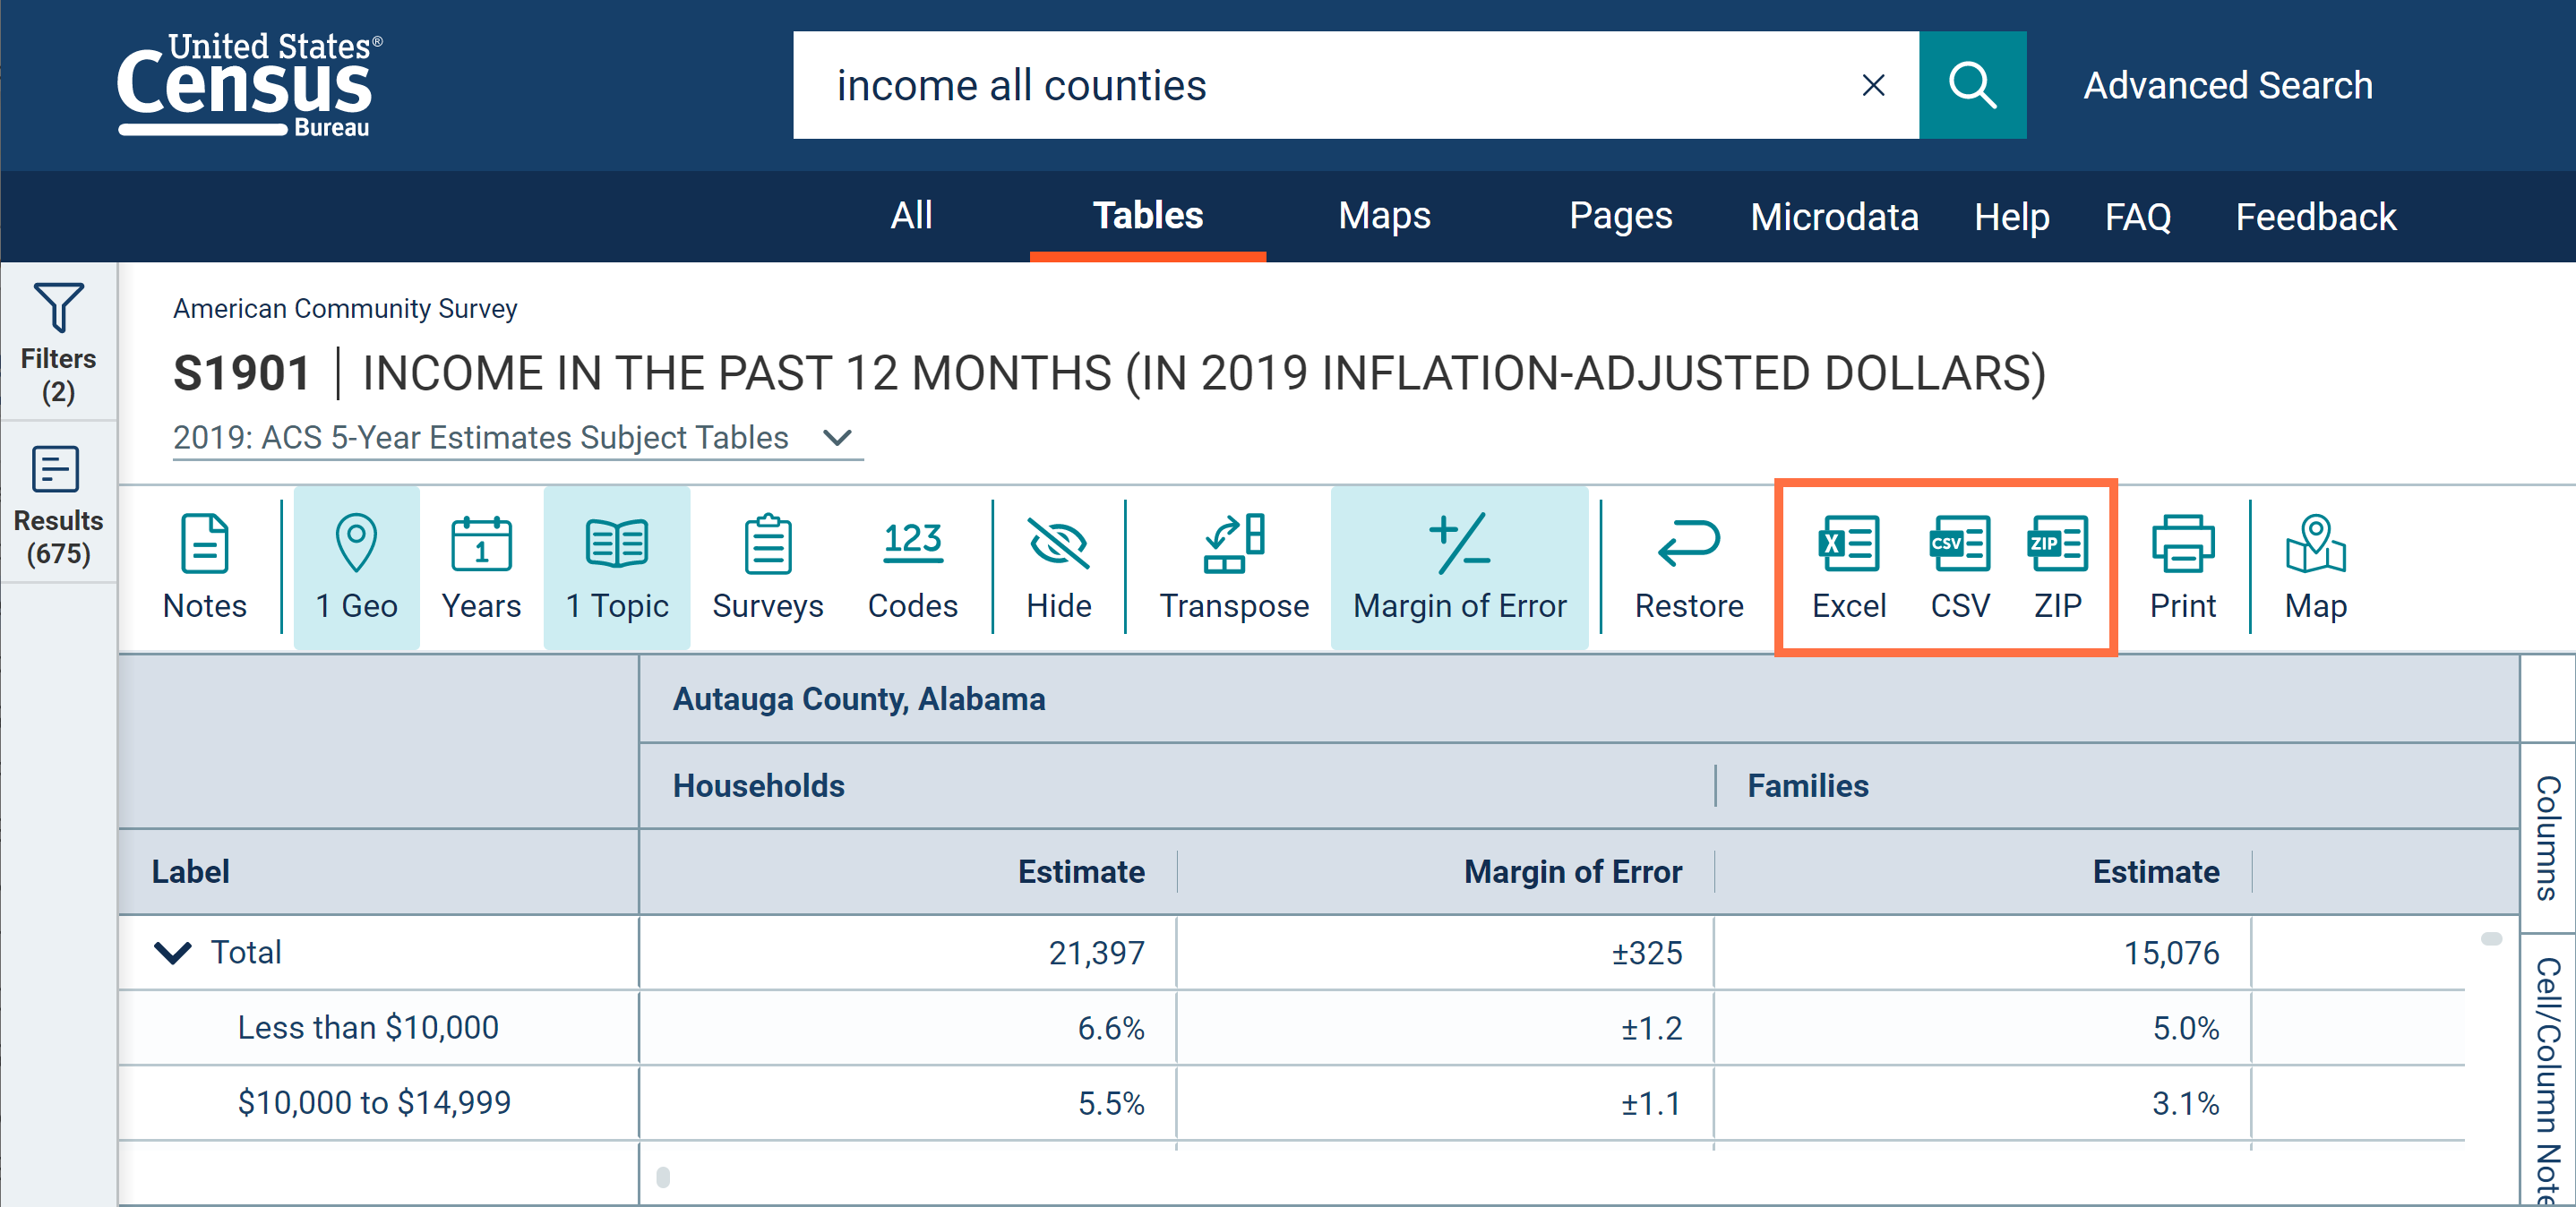
These new buttons help clarify the initial file format you receive, and reduce the number of clicks to complete the process.
o Ability to start multiple downloads at once. Each ZIP file downloads in the background so you can continue using the site and queue up multiple downloads at the same time.
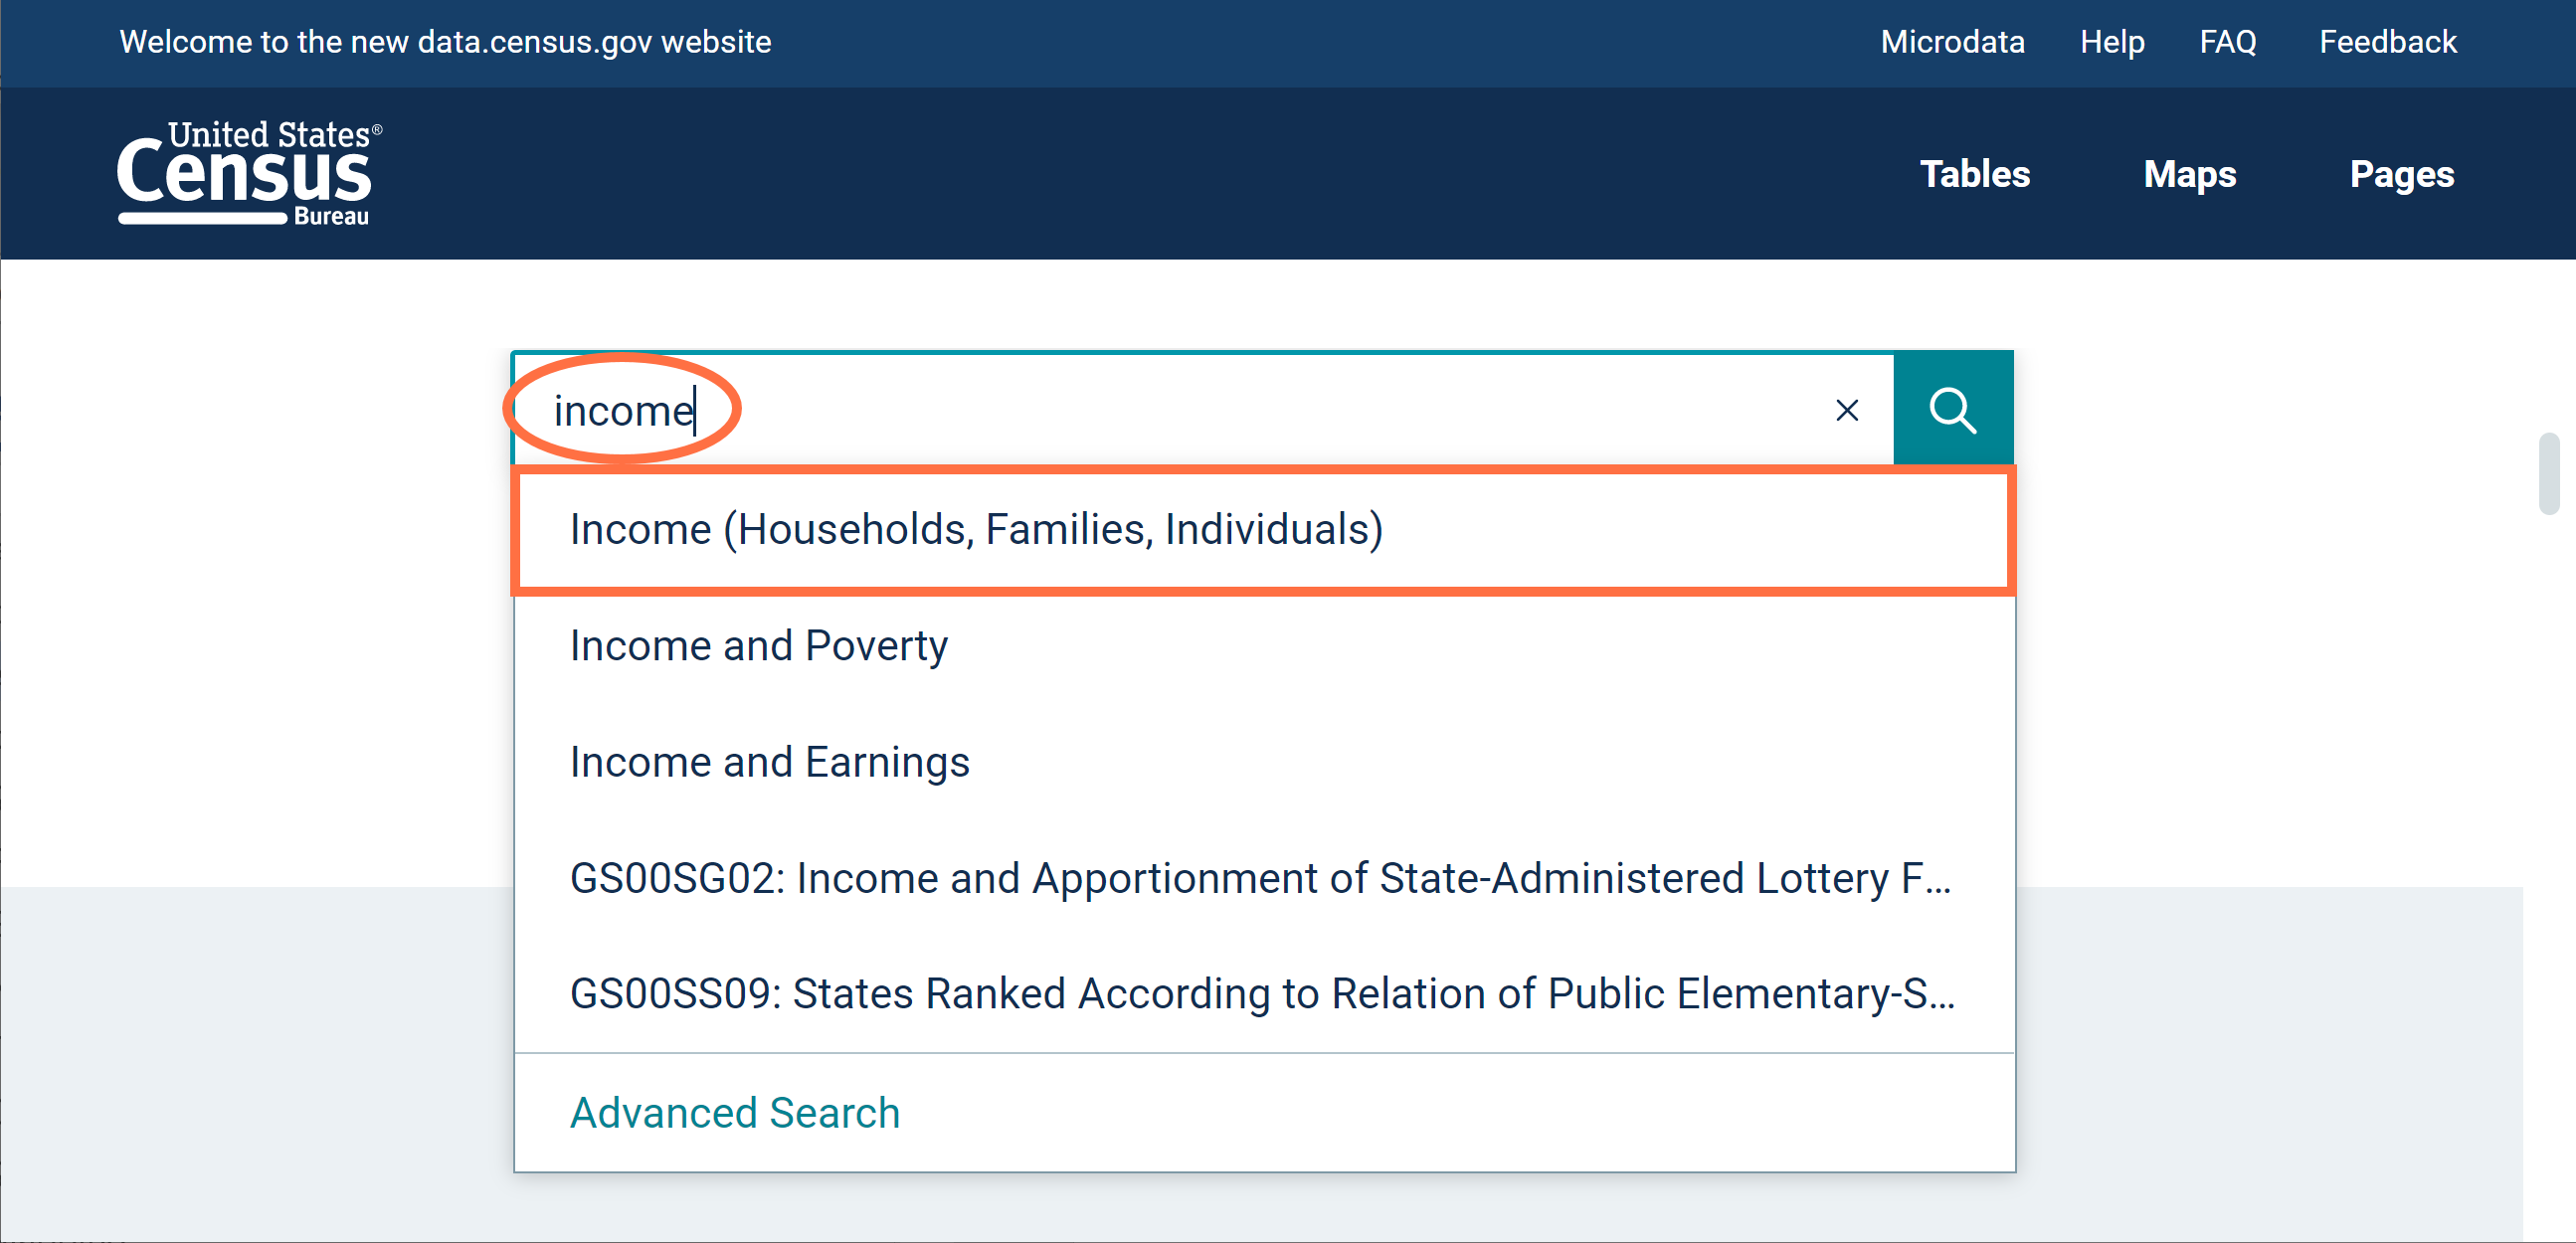
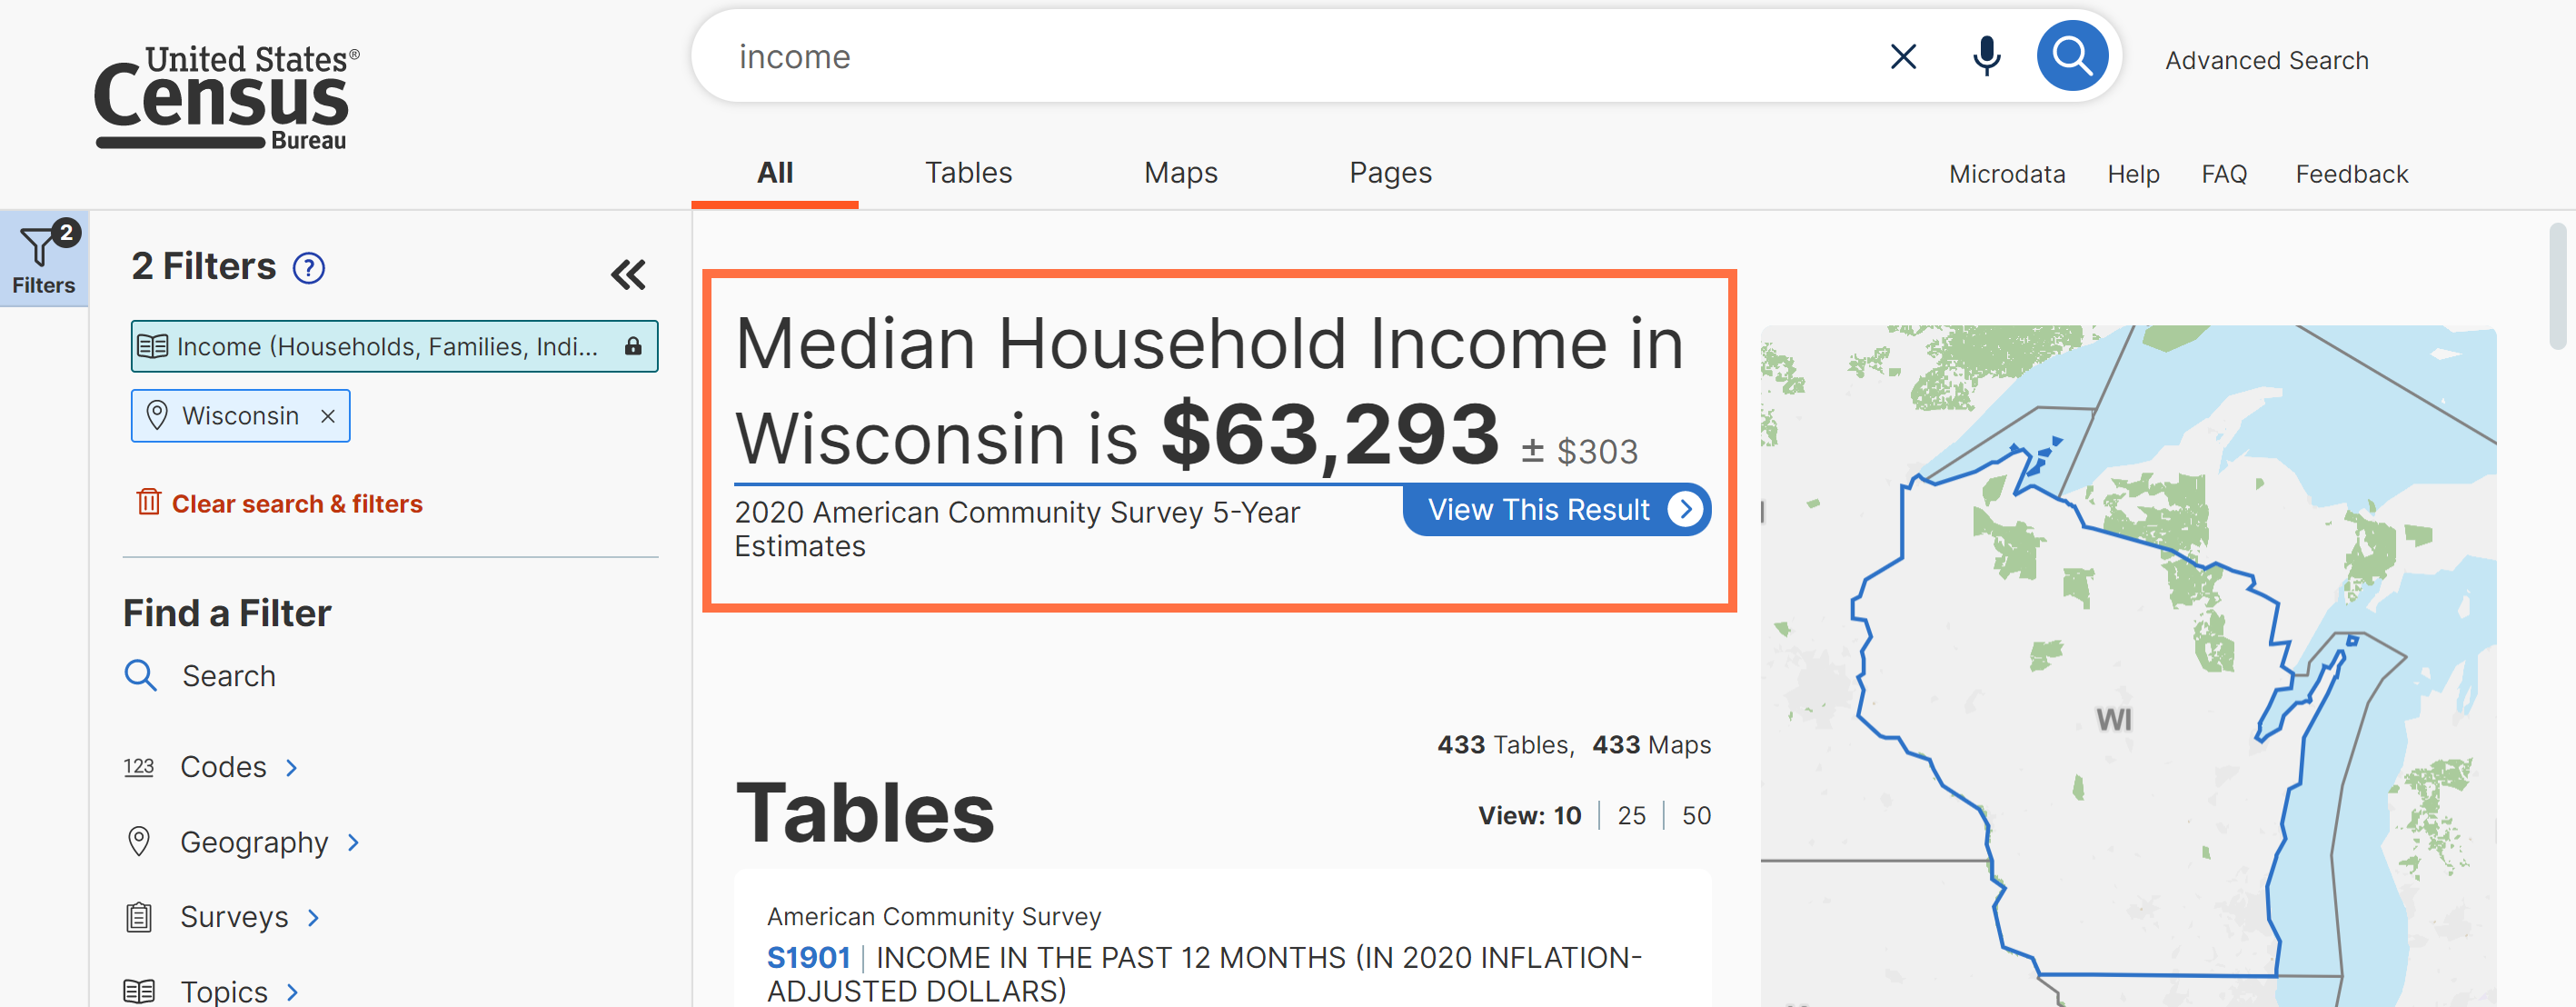
- Improved typeahead search suggestions. The first typeahead search result is updated to provide our best search suggestion based on the text you typed into the single search bar.
For example, the below search for income shows the first typeahead search suggestion as “Income (Households, Families, Individuals)”. This is the same way we would recognize your search criteria if you ran the search as-is without clicking any of the typeahead search options.
- Improved view of Population Estimates Program Table NA_EST2021_POP: Monthly Population Estimates for the United States. We have applied a recommended pivot to the table by default to reorganize the table layout and make the data easier to view.
- Fixes to 15 defects, including fixes that allow you to:
- View all sections of the Geography Profiles
- View more accurate file size estimations for economic tables you download
- See correct typeahead search suggestions
On April 28, we released the following updates to the site:
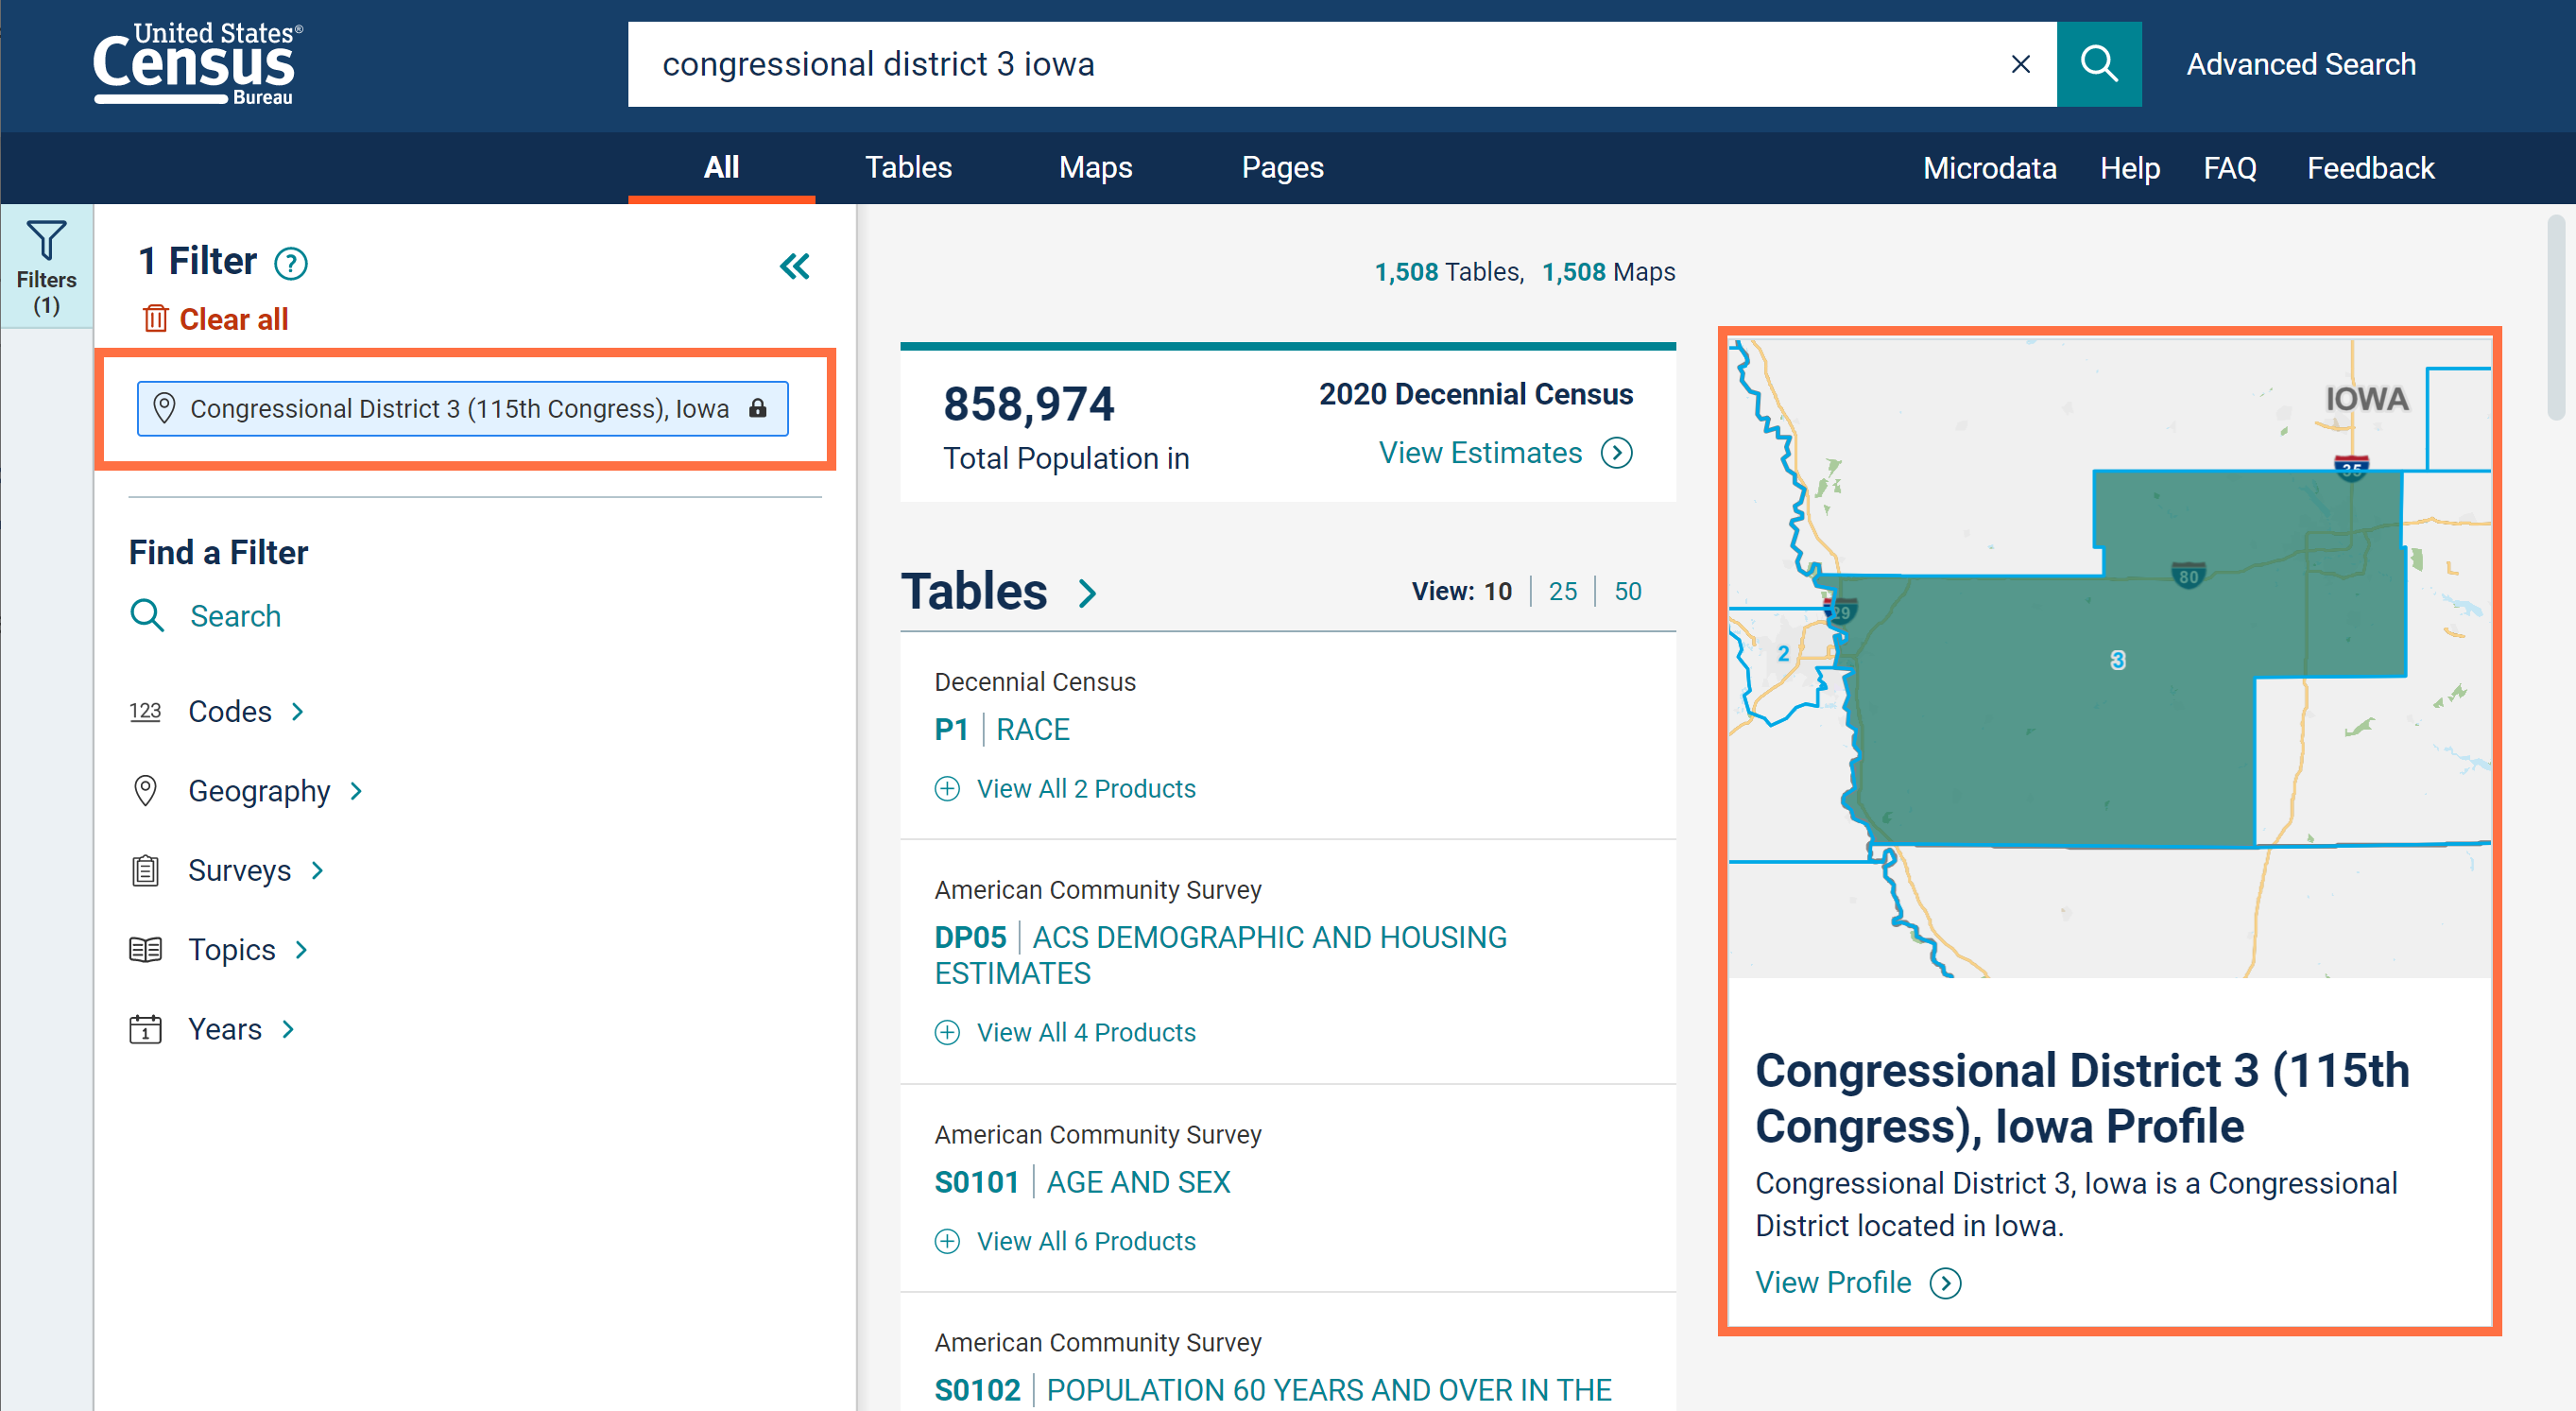
- Geography Profiles for more types of geographies. You can now access new profiles for:
- Congressional Districts
- School Districts
- American Indian Areas, Alaska Native Areas, and Hawaiian Home Lands
To access a Geography Profile, run a search for a single geography such as “Congressional District 3 Iowa” and then click the map on the right side of the “All” results page.
- Search engine optimization improvements. With this update you will now see titles for data.census.gov tabs that are unique to the searches, tables, or maps you are using. These improvements also apply these labeling updates behind the scenes to other fields such as the webpage author and description. These updates help other search engines better understand and link to our content on data.census.gov.
- Fixes to 10 defects, including fixes that allow you to:
- View the full list of tables when typing “total population” in the single search bar
- View the full set of tables for “All available NAICS codes”
- Export tables to Excel that are responsive to your selections and contain geography labels that are readable and optimized for printing
On April 7, we released the following updates to the site:
- Updates to make the application programming interface (API) compliant with the Evidence Act. This includes applying fixes across all endpoints to ensure:
- Each array contains a value and is not empty
- Links and email addresses are in the correct format
- Required fields for “bureauCode” and “accessLevel” are included in each endpoint
- Fixes to 11 defects, including fixes that allow you to:
- Search detailed Asian and Native Hawaiian and Other Pacific Islander population groups in the single search bar. For example: Thai, Japanese, Polynesian, Samoan, etc.
- Use decimal values when restricting the universe for custom tables created through Microdata Access
- View correct metropolitan/micropolitan statistical area maps for the 2012 vintage
On May 19, we released the following updates to the site:
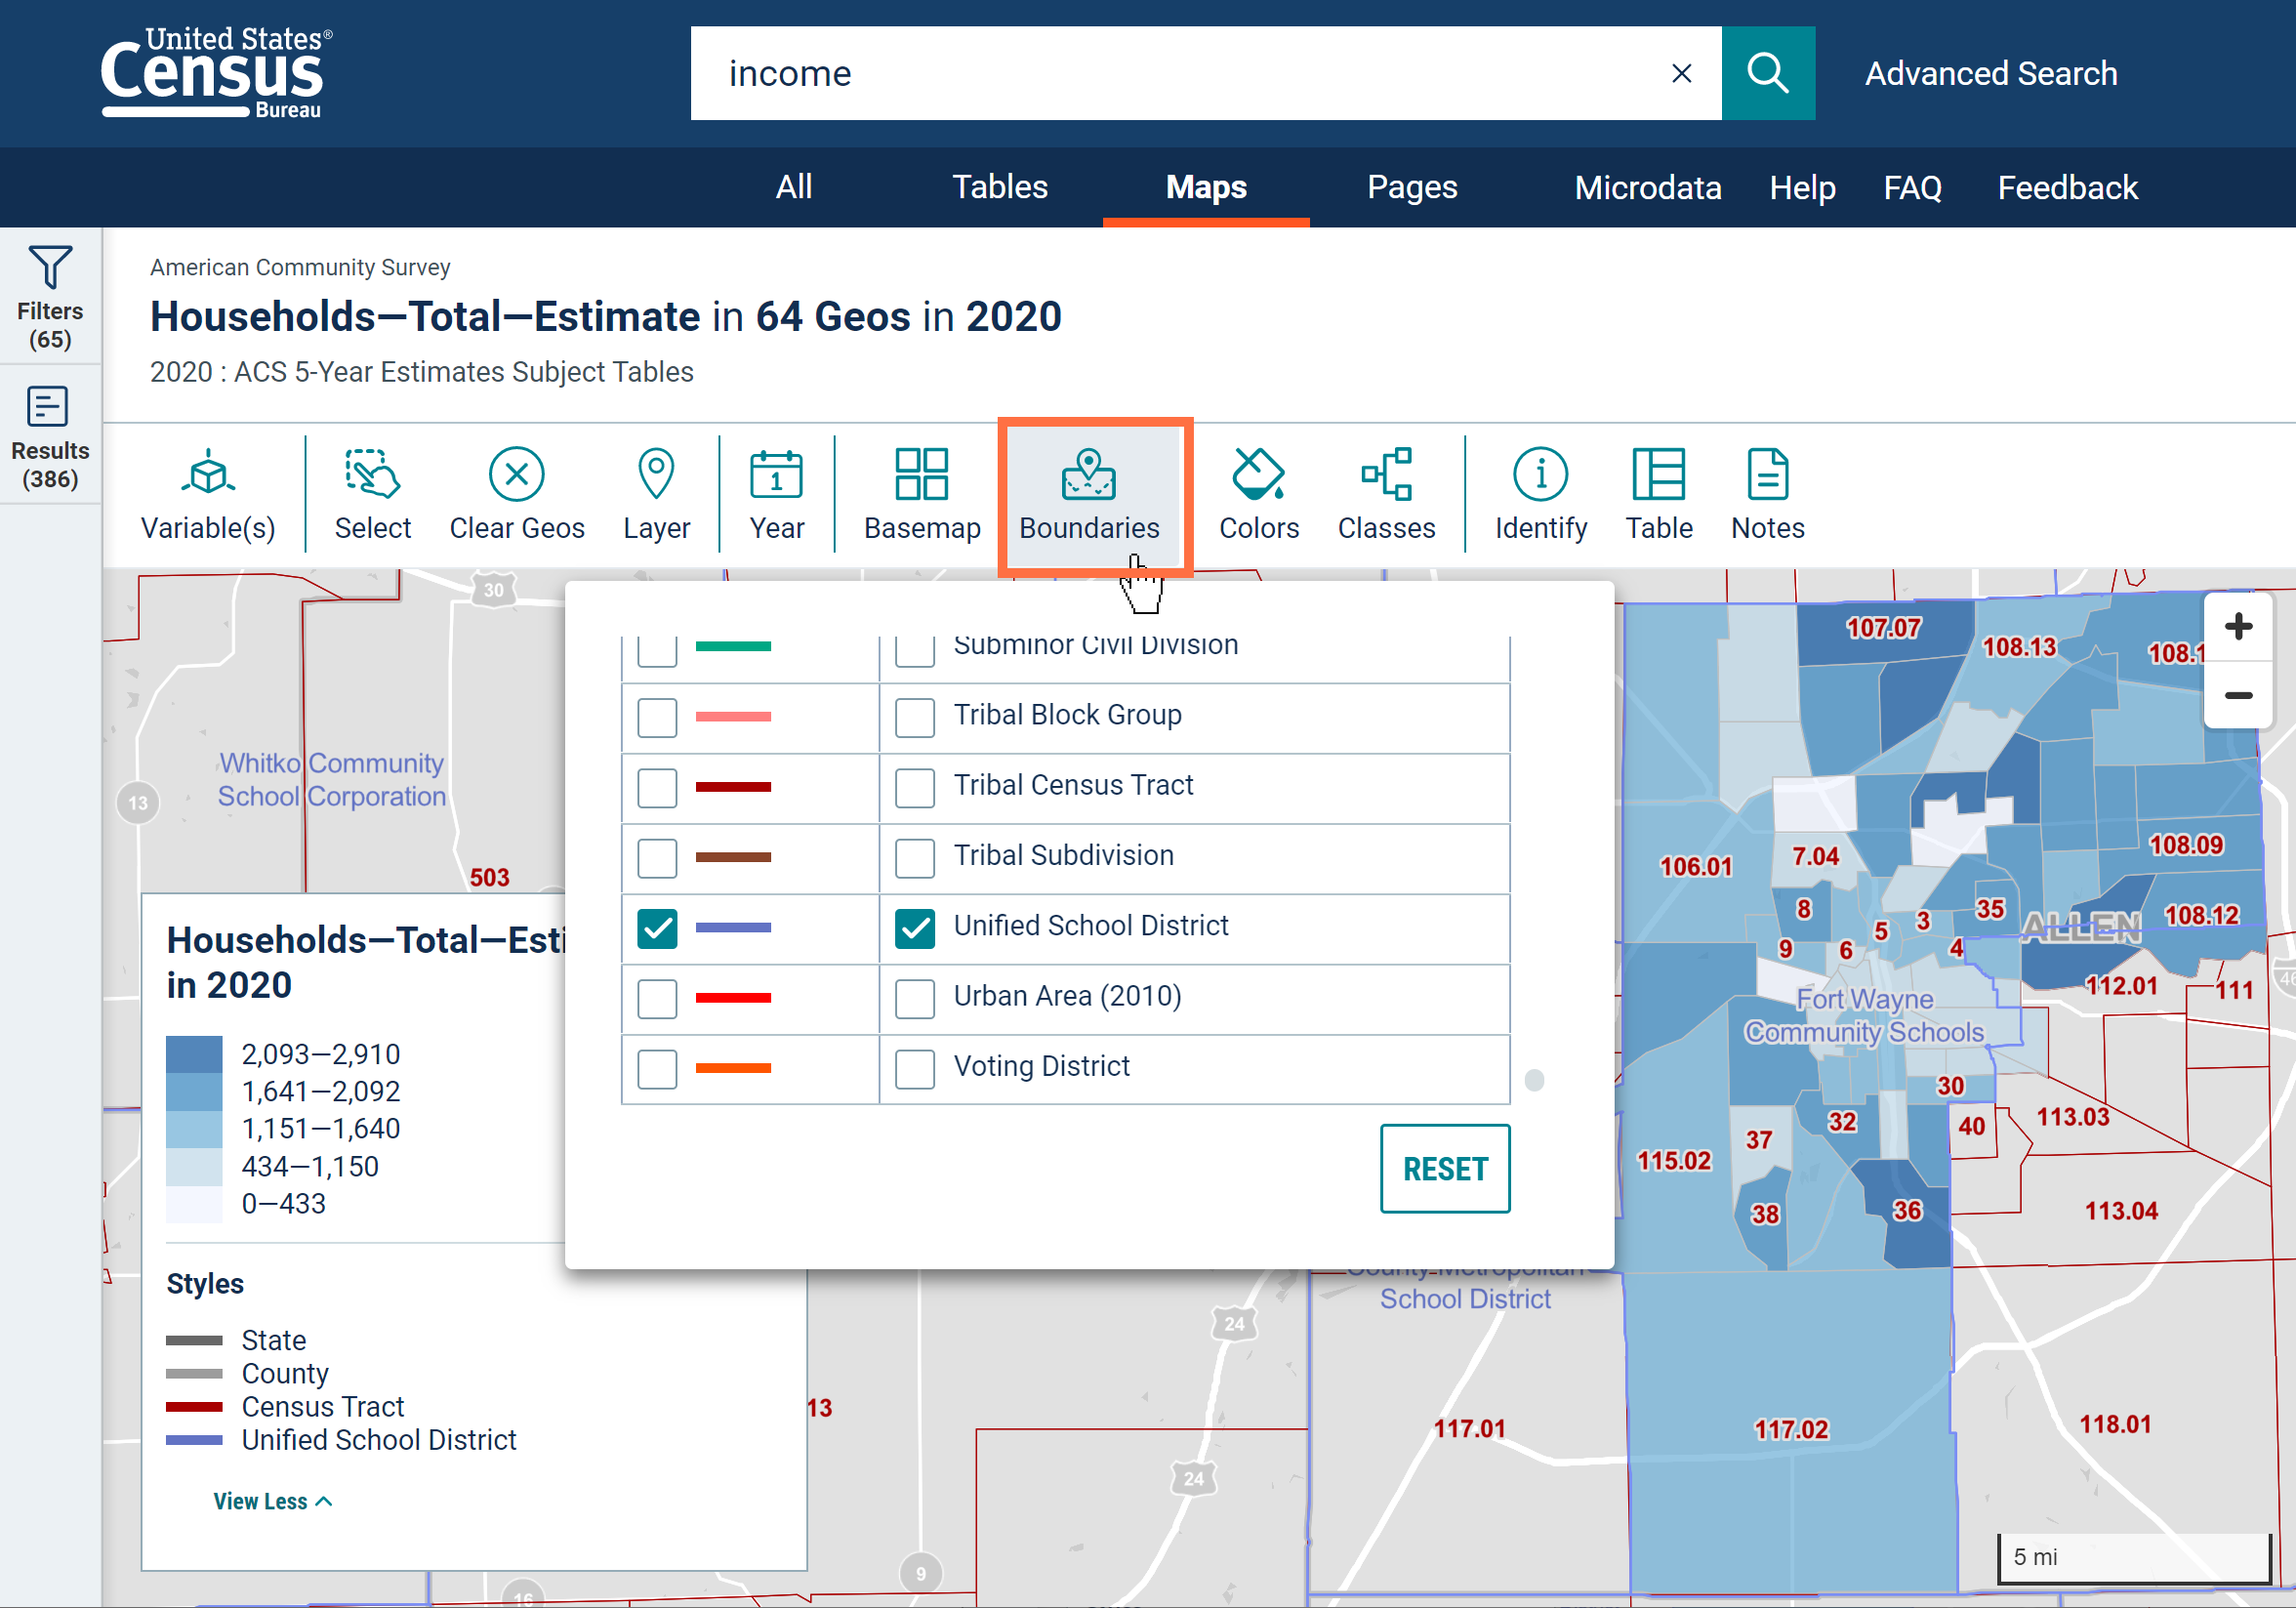
- Improved wording of a popular map button. The previous “Style” button is now called “Boundaries” to better describe its functionality. The button allows you to show boundaries on your map for more types of geographic areas.
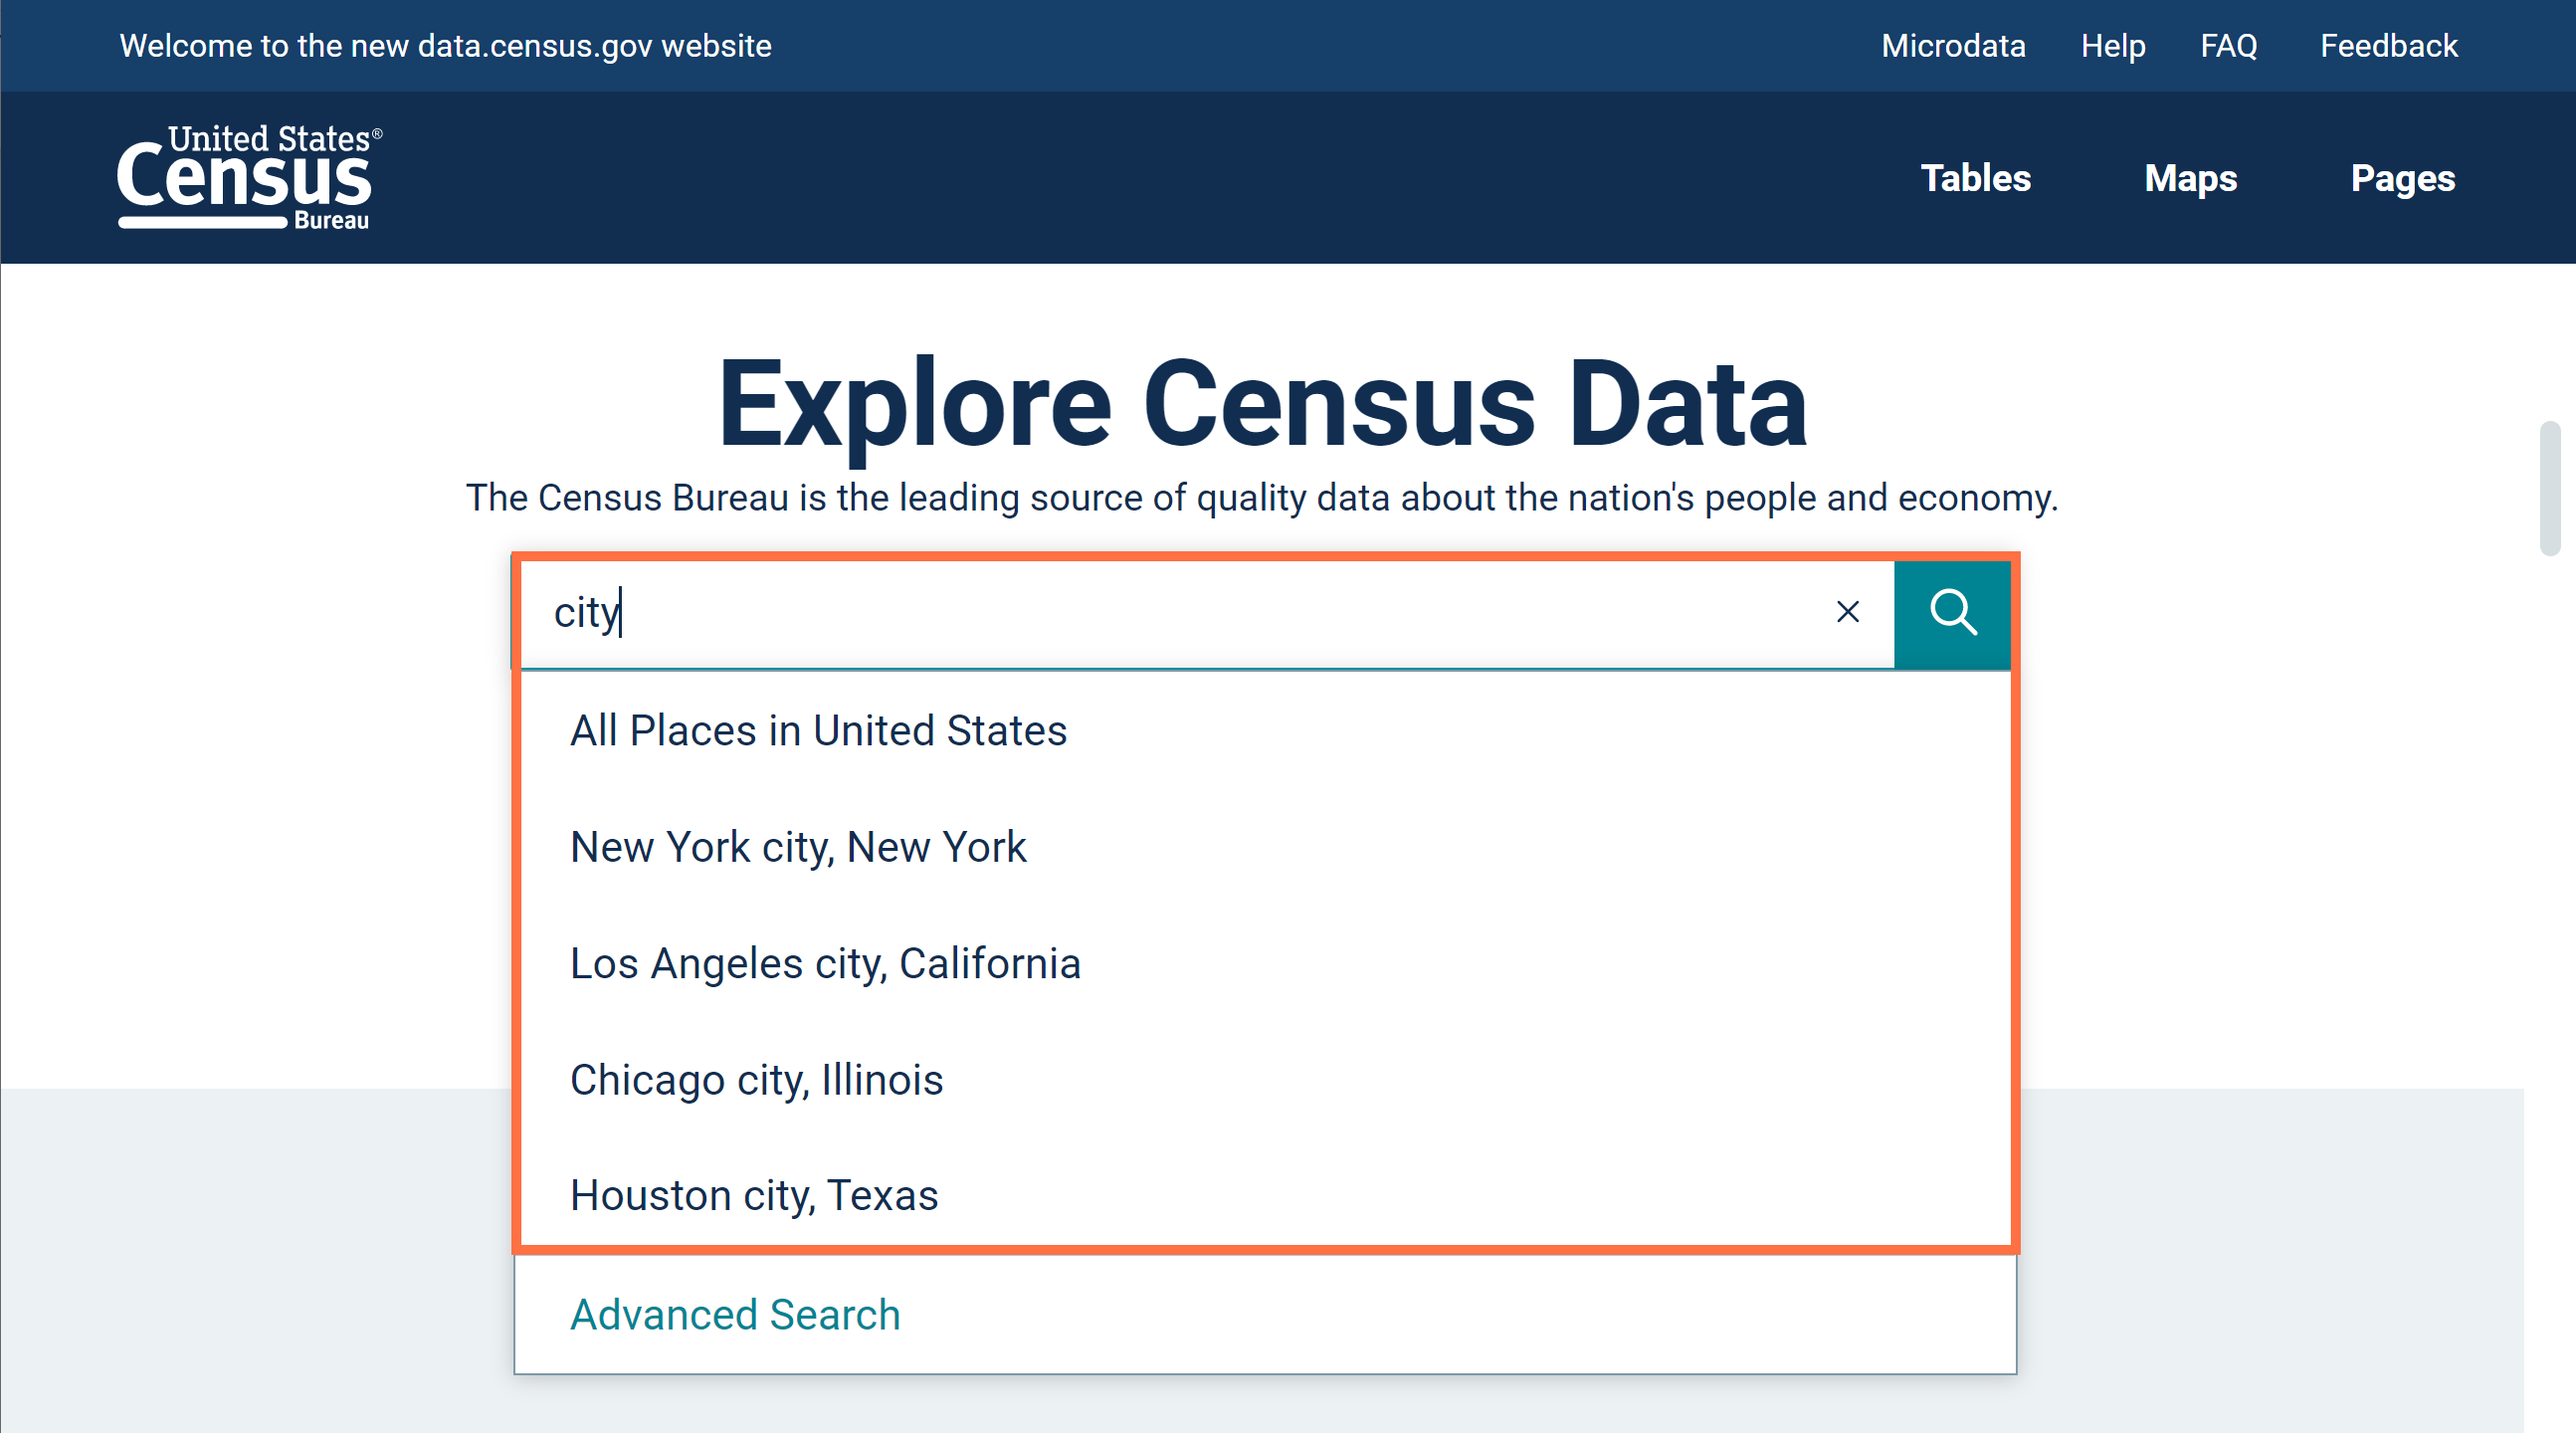
- Enhanced typeahead search results for the terms “state,” “county,” or “city.” When you search one of these terms on their own, the most populous areas appear near the top of the typeahead search suggestions.
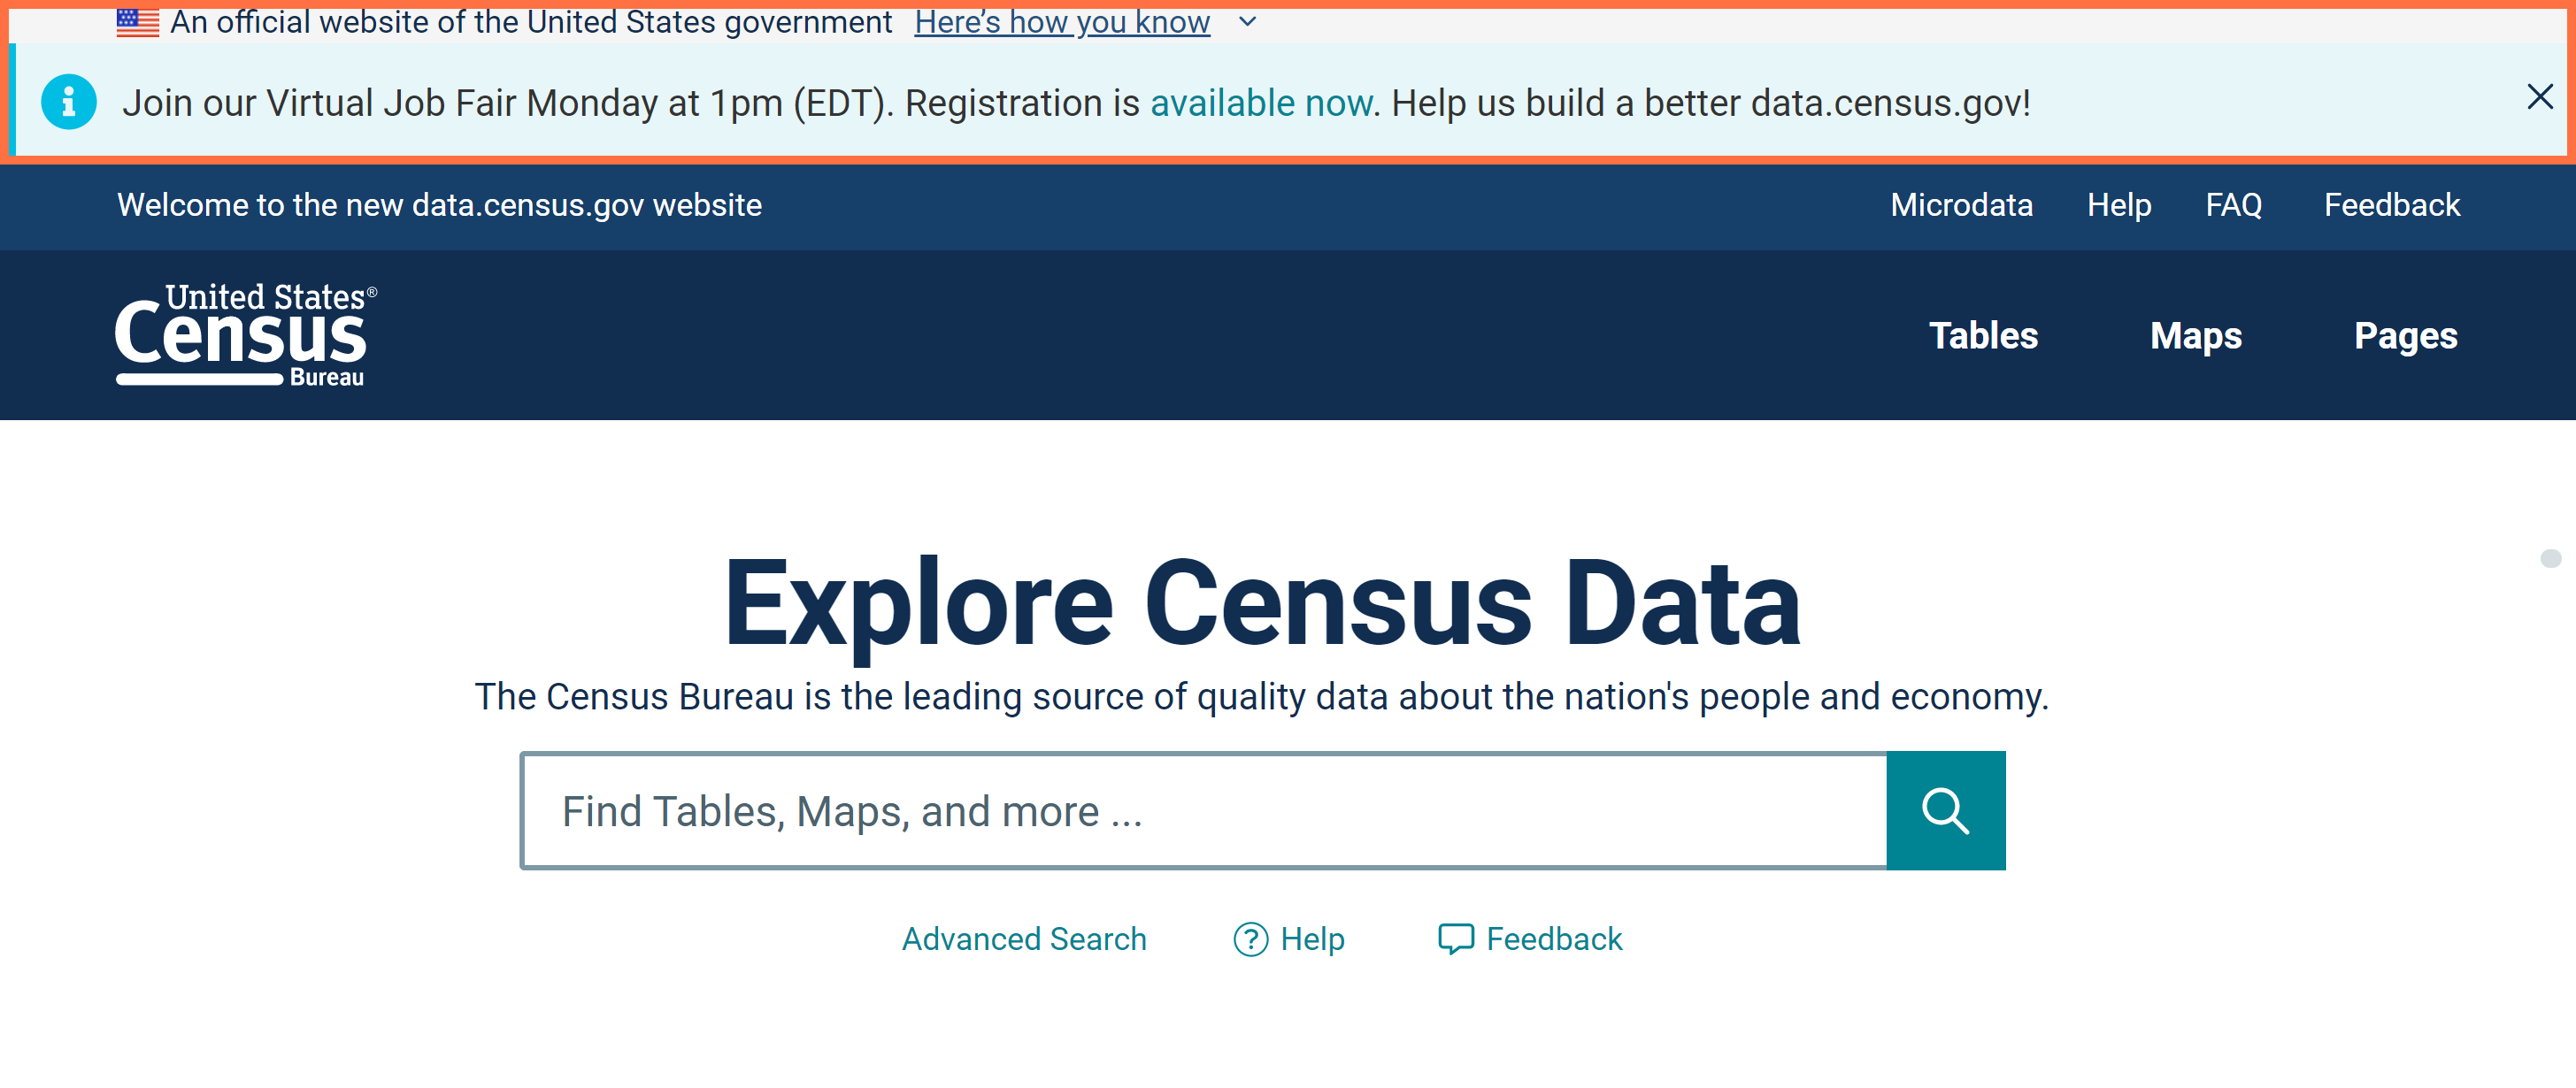
- Improved banner placement. You will now see banners at the top of the screen across all pages on the site, providing a consistent view.
- Behind-the-scenes improvements to add functionality for universe statements when making .json and .xml queries to the application programming interface (API). The intent is to apply these universe statements to API group calls for entire tables in future American Community Survey (ACS) data releases in the API.
- Technical updates to improve our automated testing of data.census.gov.
- Technical updates to improve the speed that featured statistics are returned to you at the top of the All Results page.
- Fixes to 16 defects, including fixes that allow you to:
- View downloaded data from economic data tables in the optimized column order
- View columns for NAICS code in ZIP Business Patterns tables
- Access data for Lexington, KY and Nashville, TN using the single search bar
- Find geography filters more easily using the “Find a filter” search box
- View source statements for all tables
- View pagination controls to browse the full list of table results in mobile view
On June 30, we released the following updates to the site:
- Refreshed landing page. You will now see the following enhancements:
o New look and feel across the page, including new design and fonts
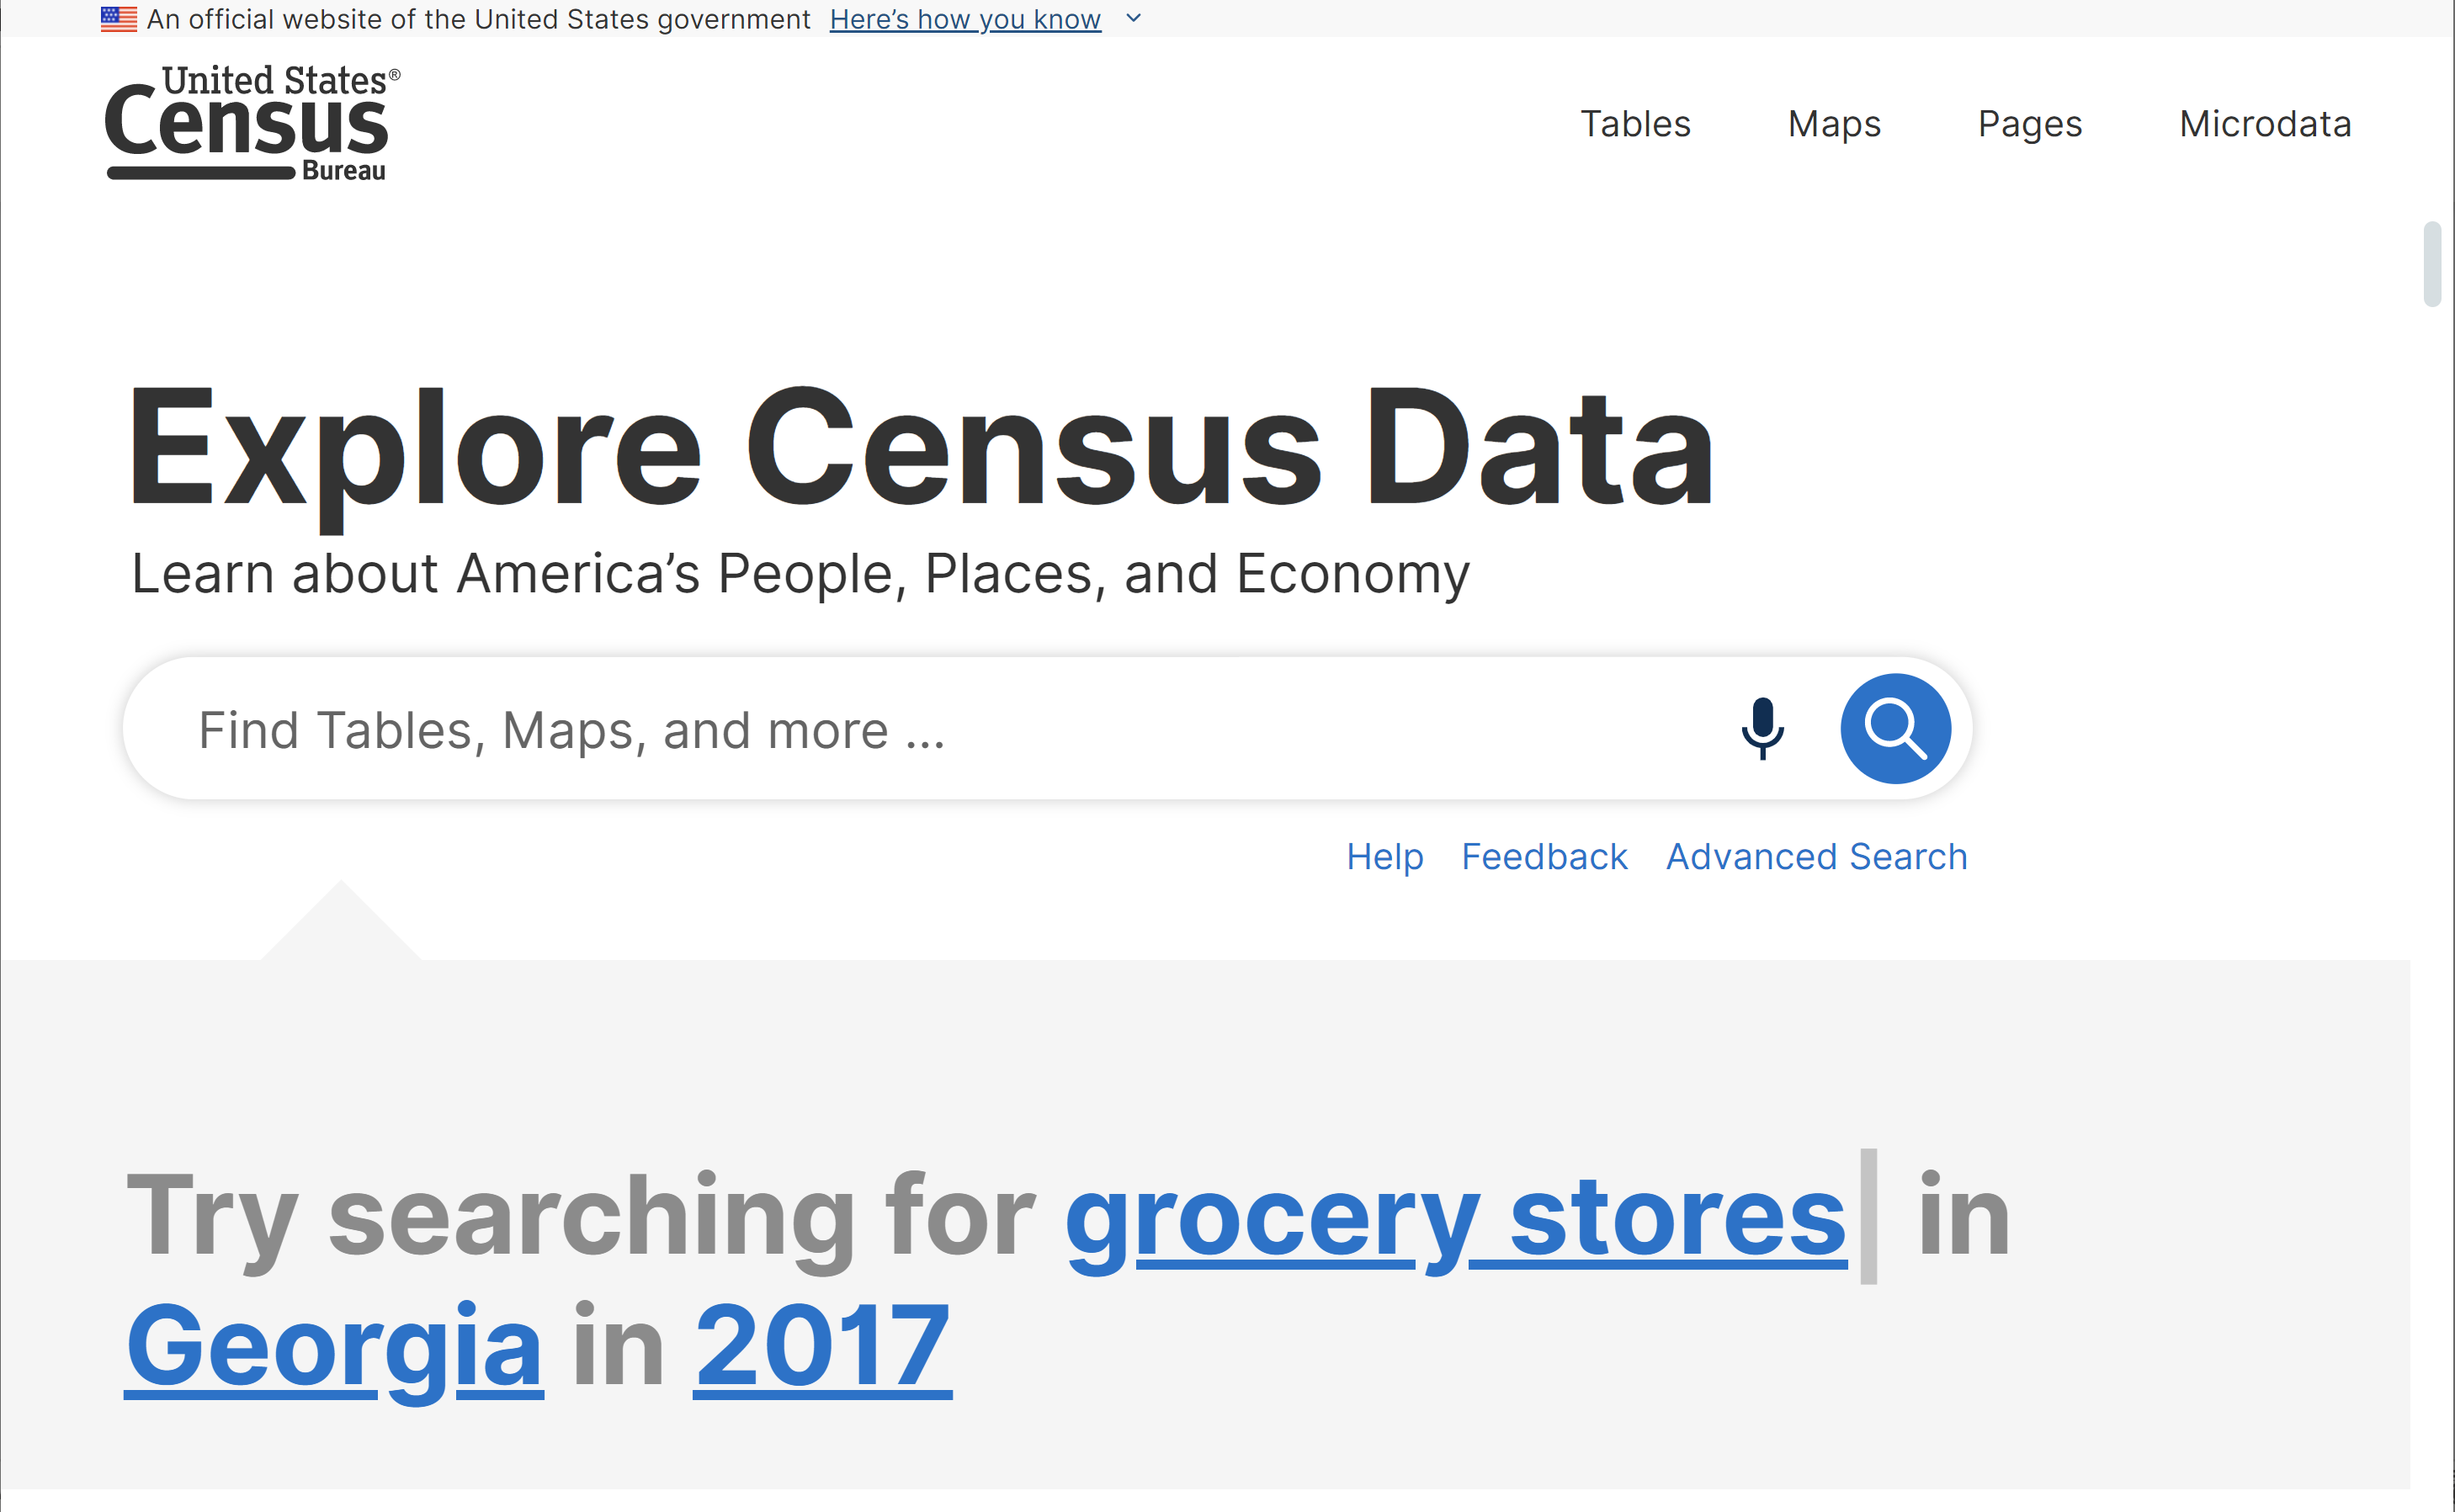
o Speech to text functionality, accessible through the microphone in the single search bar

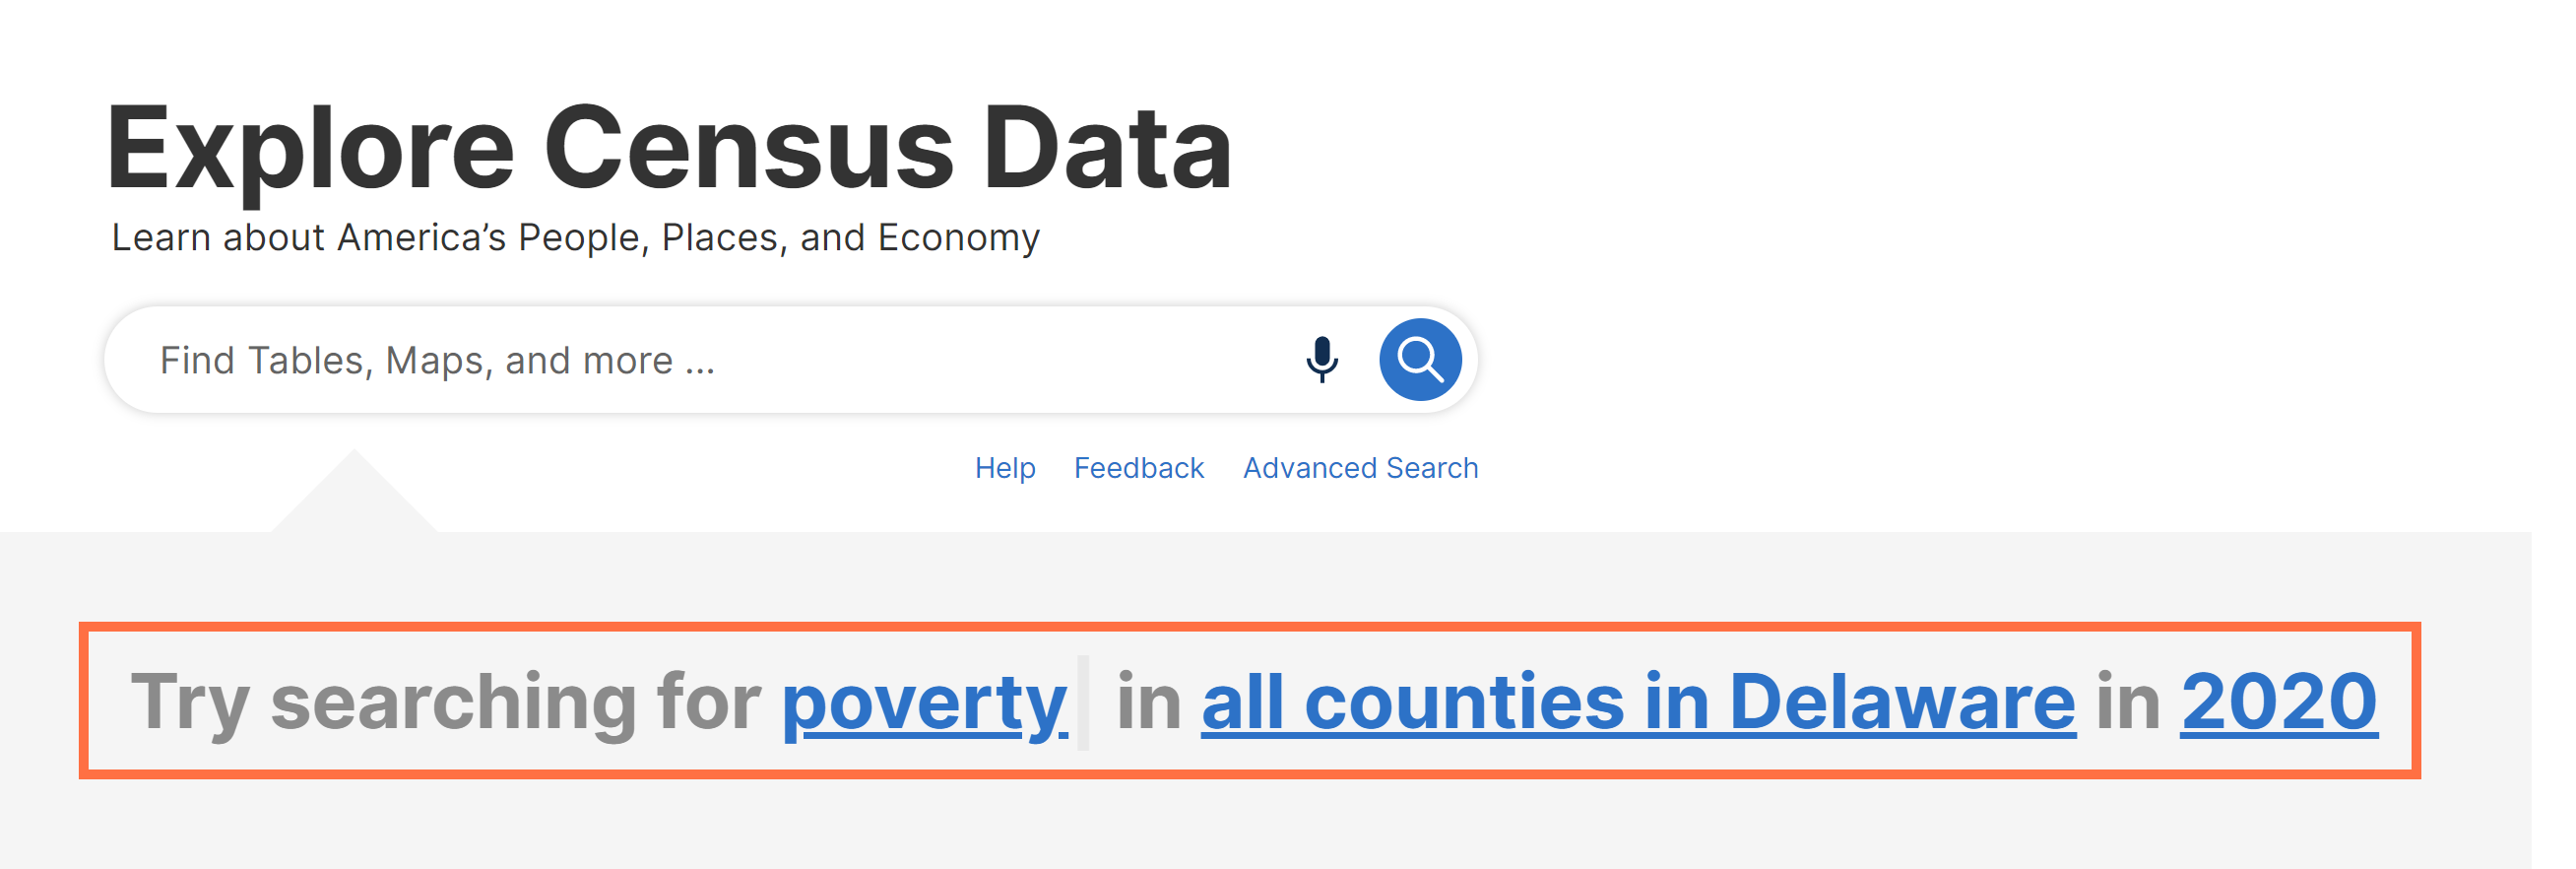
o Interactive and clickable text to help you get started with your search. The examples show that you can type topics, geographies, and years in the single search bar.
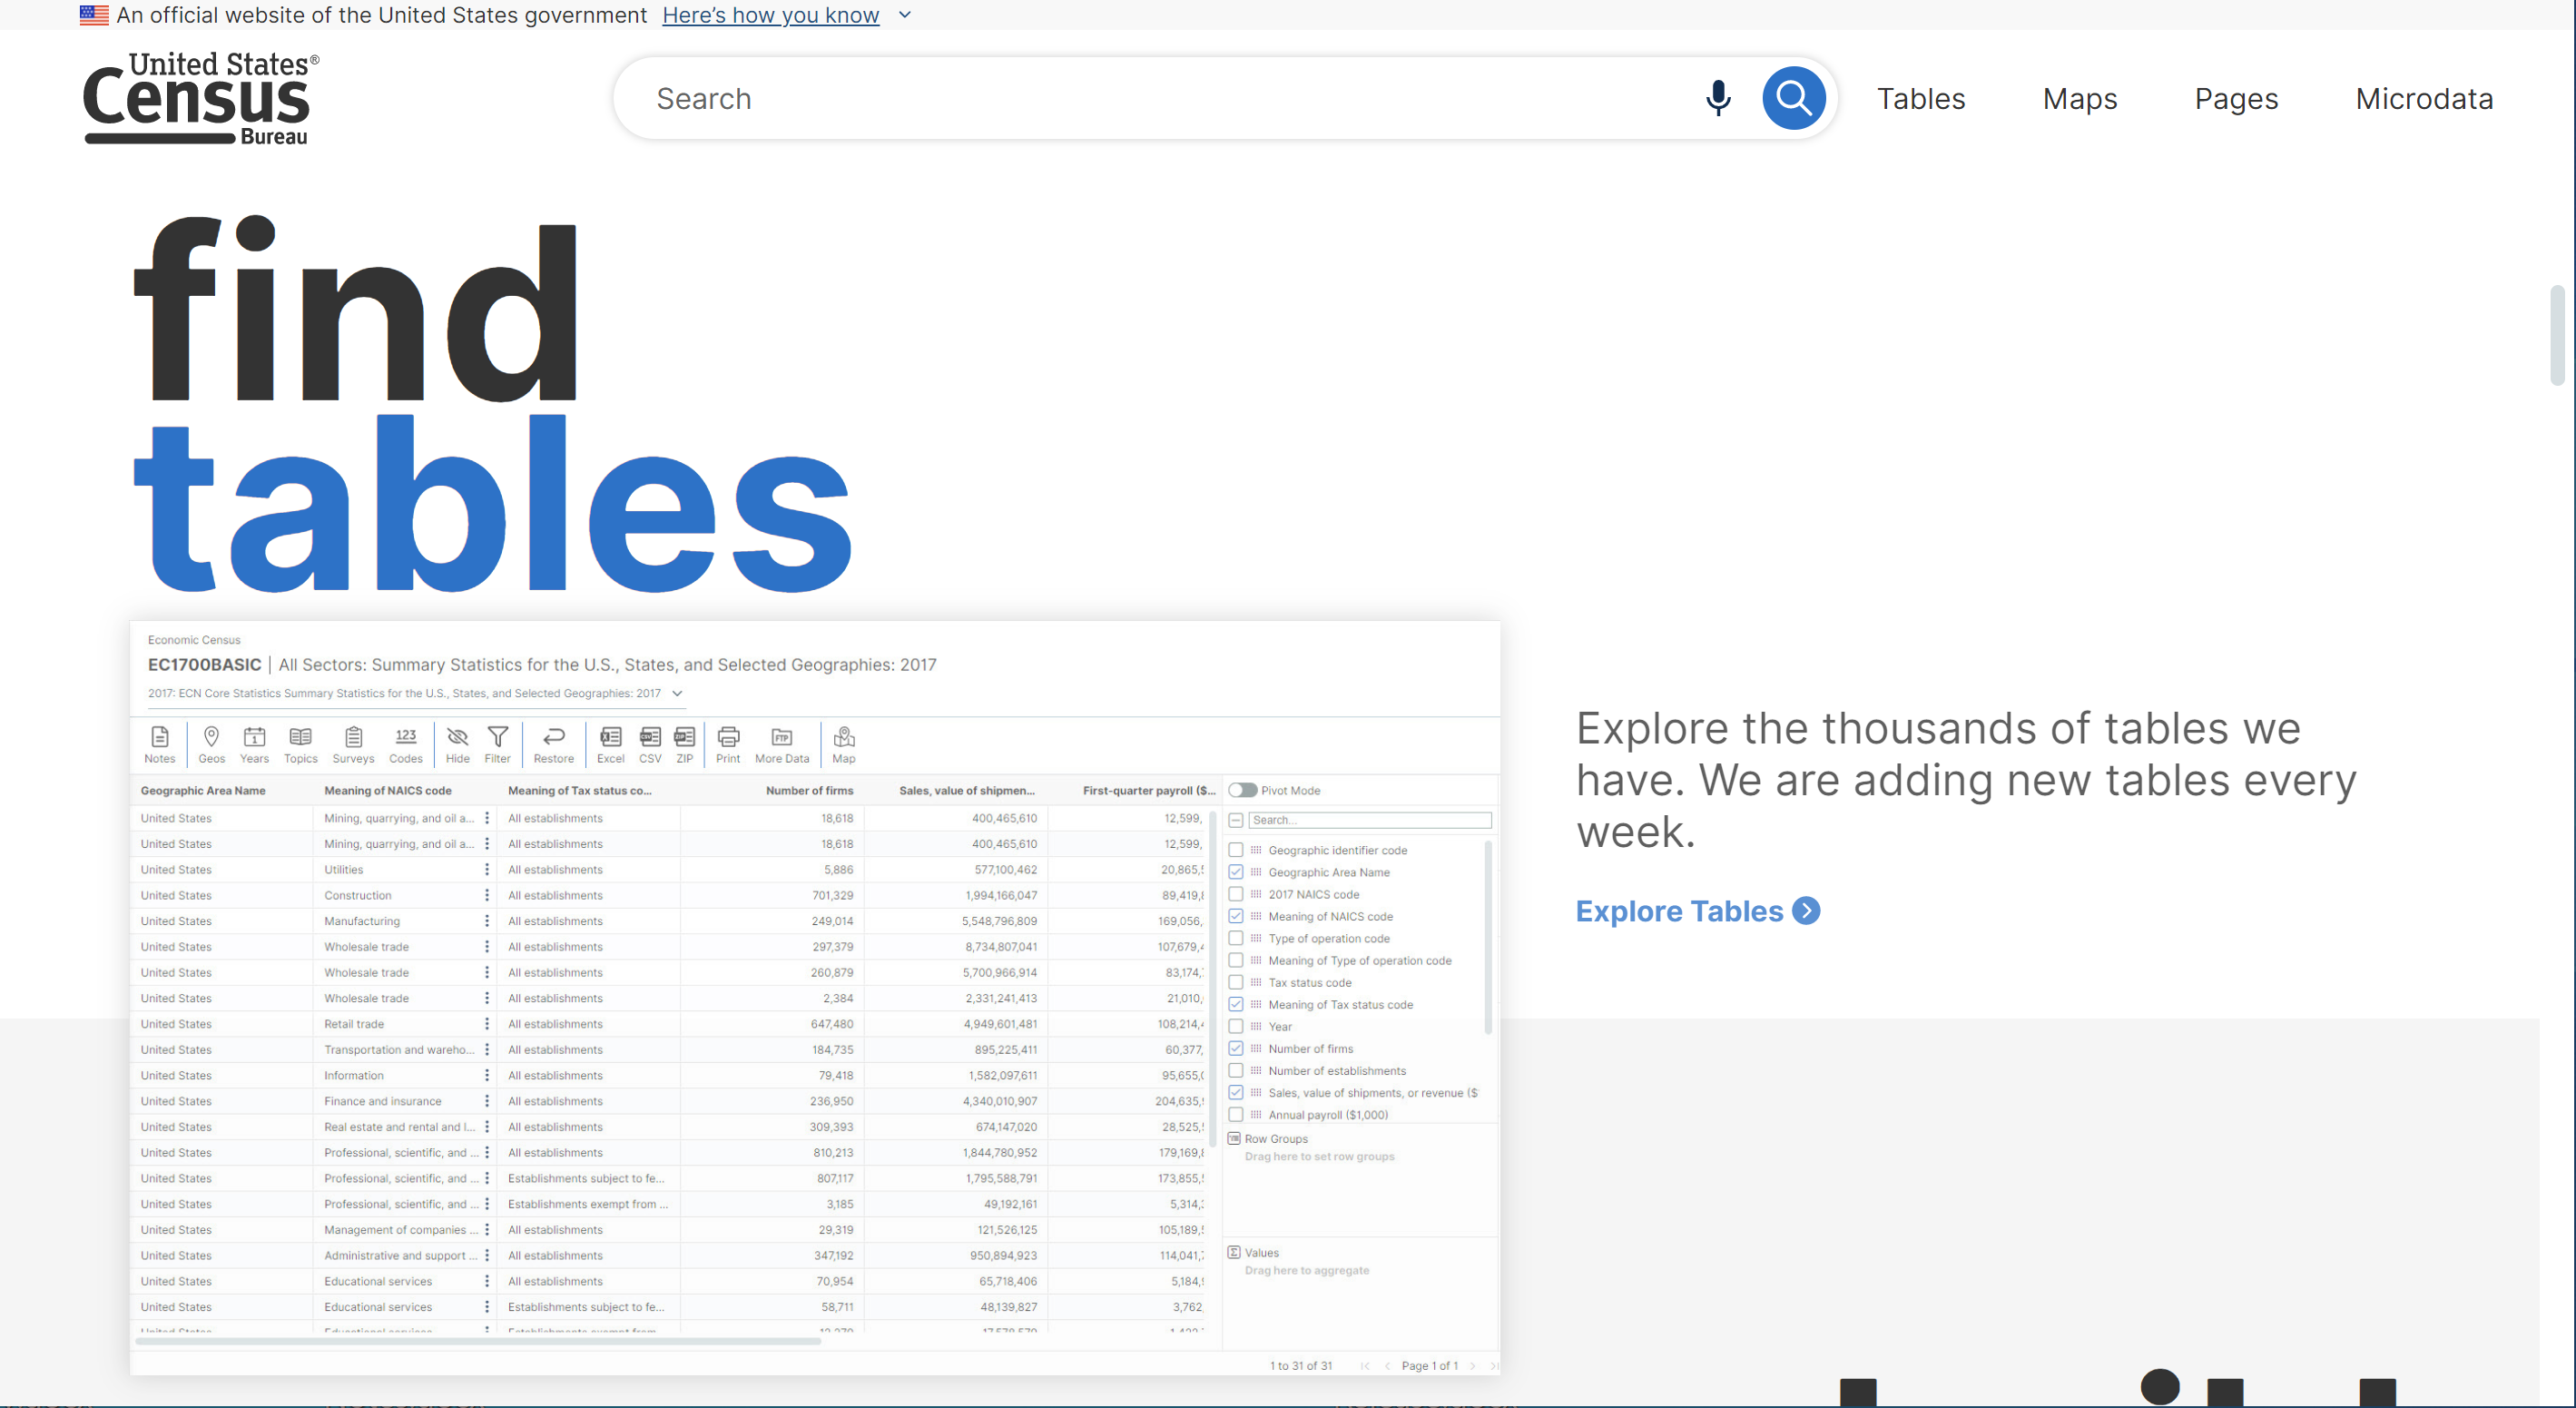
o Enhanced descriptions of data.census.gov content: Find tables, build maps, profiles, and access microdata. Each section includes images and clickable links to help you get started drilling into the content on the site.
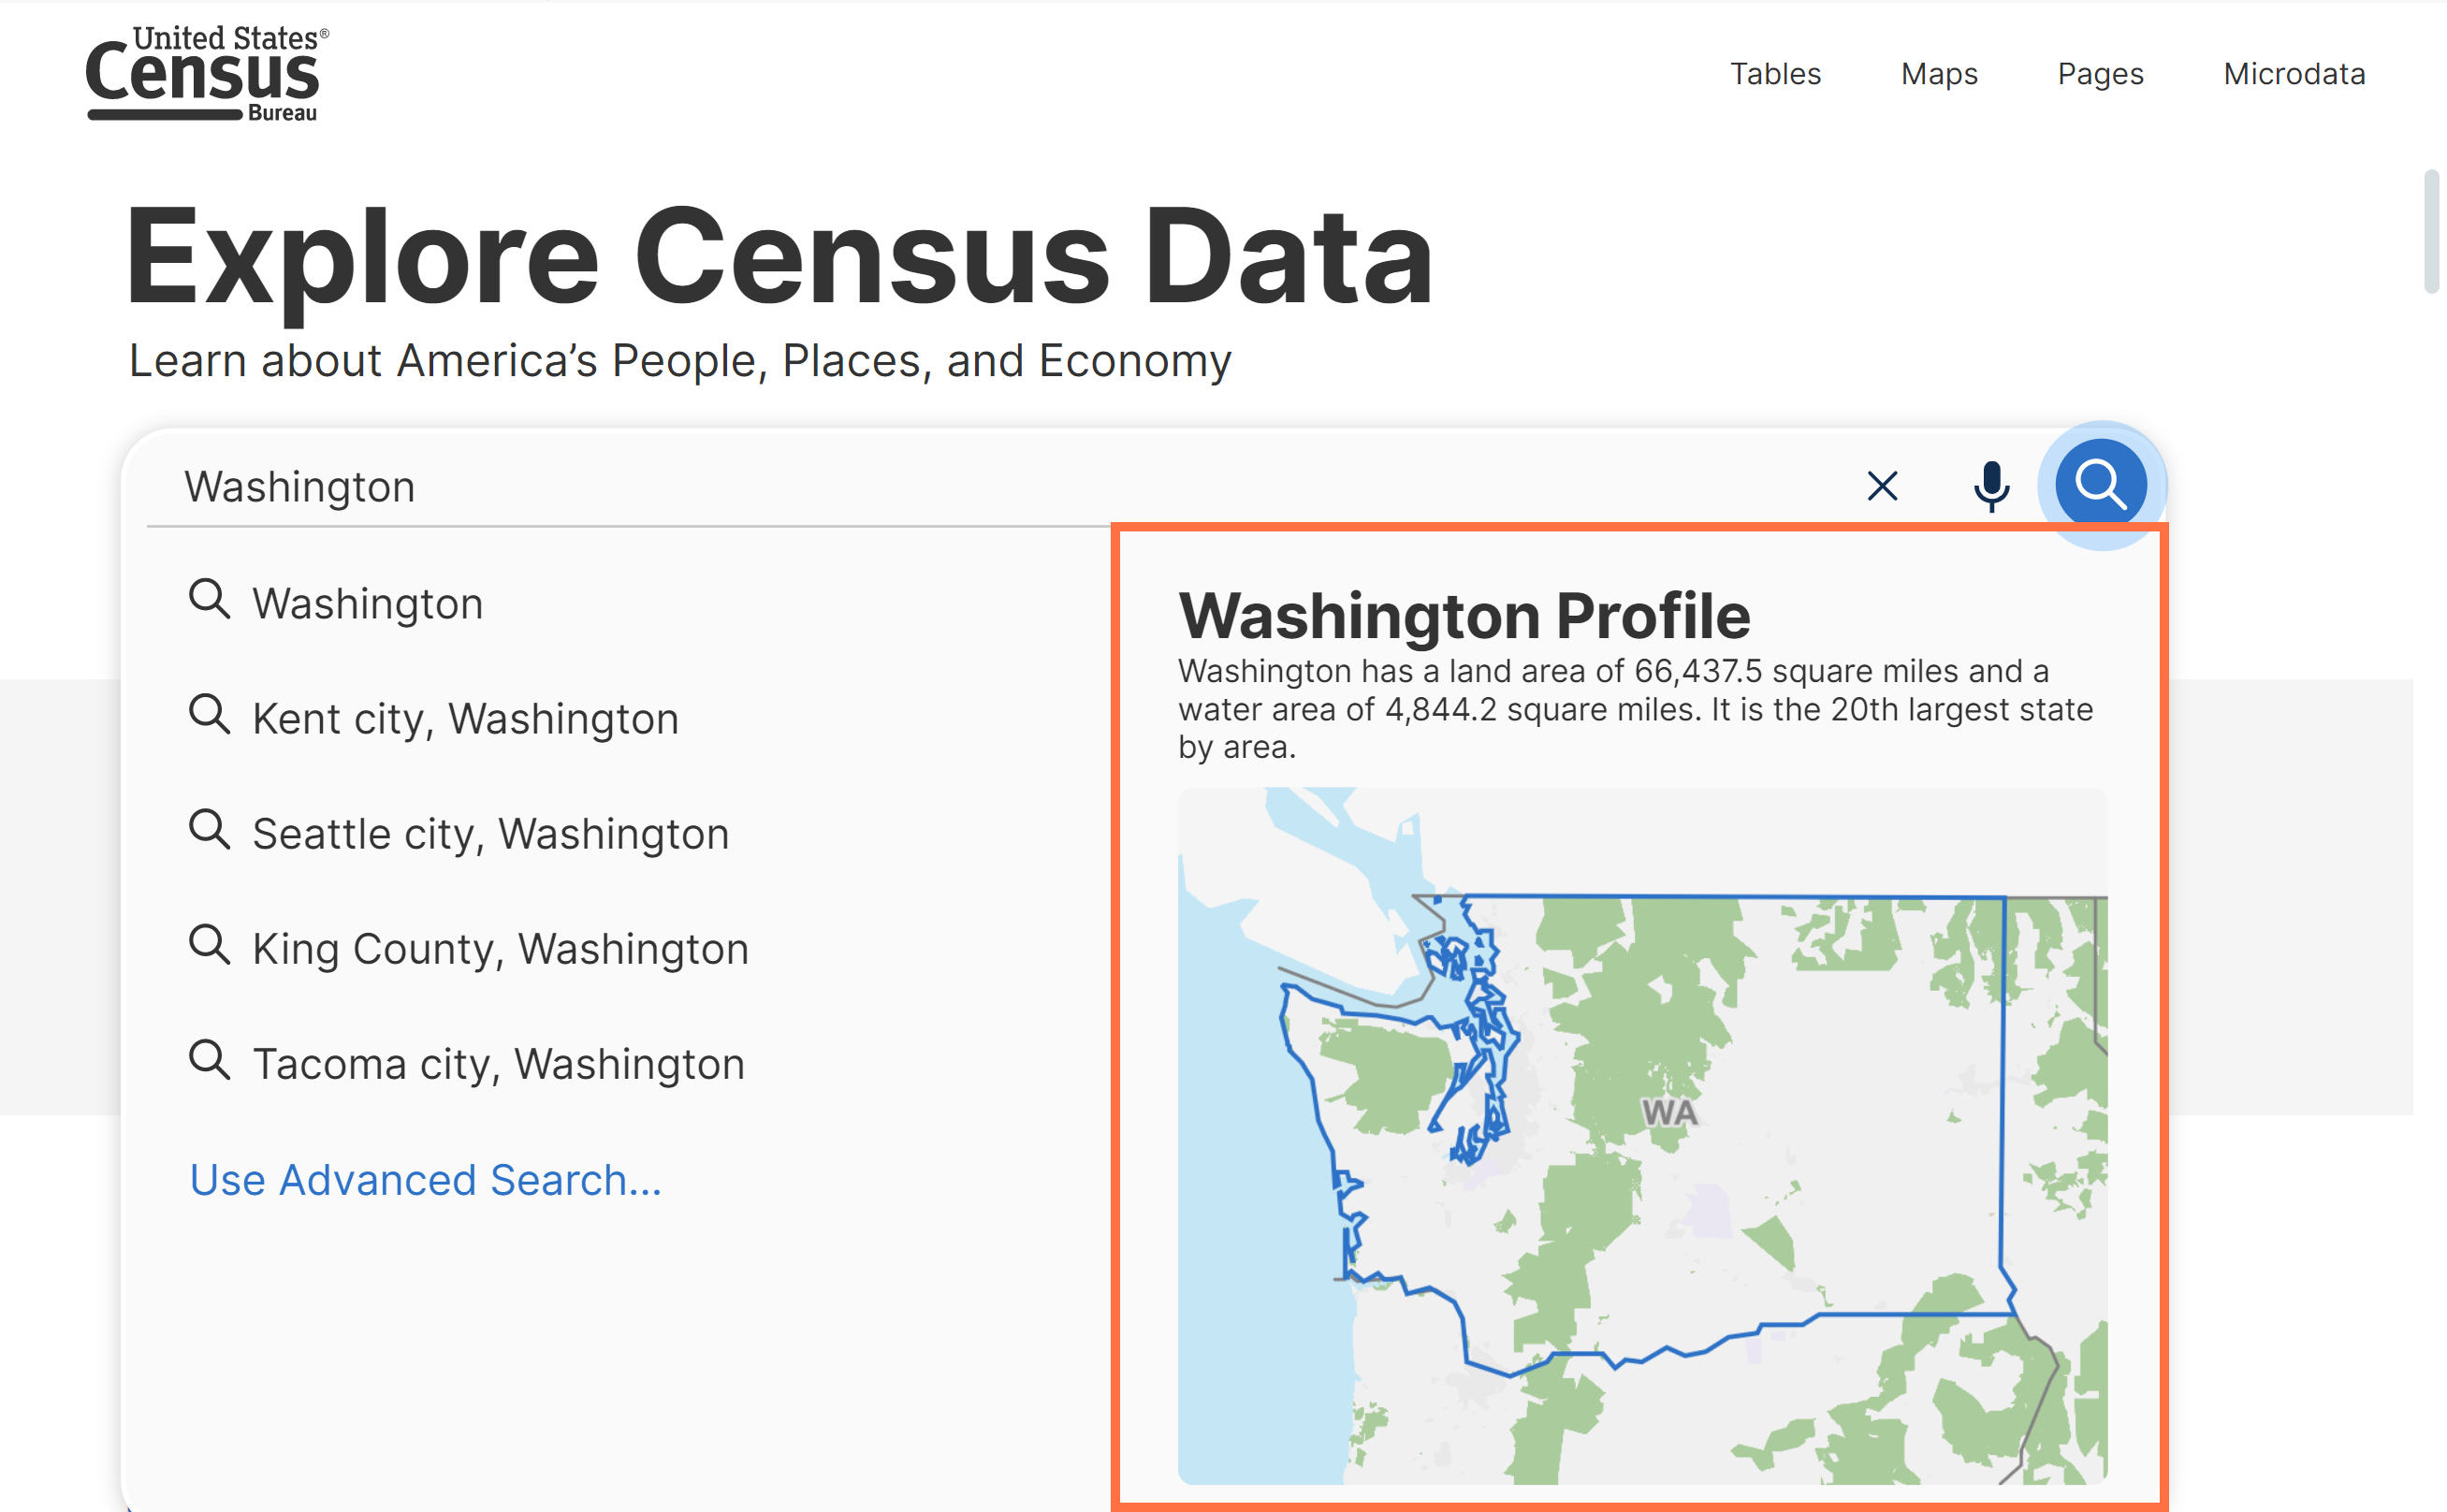
o Updated layout of typeahead search suggestions. If applicable to your search, you will see a profile link and map on the right side of the typeahead search suggestions. Phrases for all other suggested searches appear on the left.
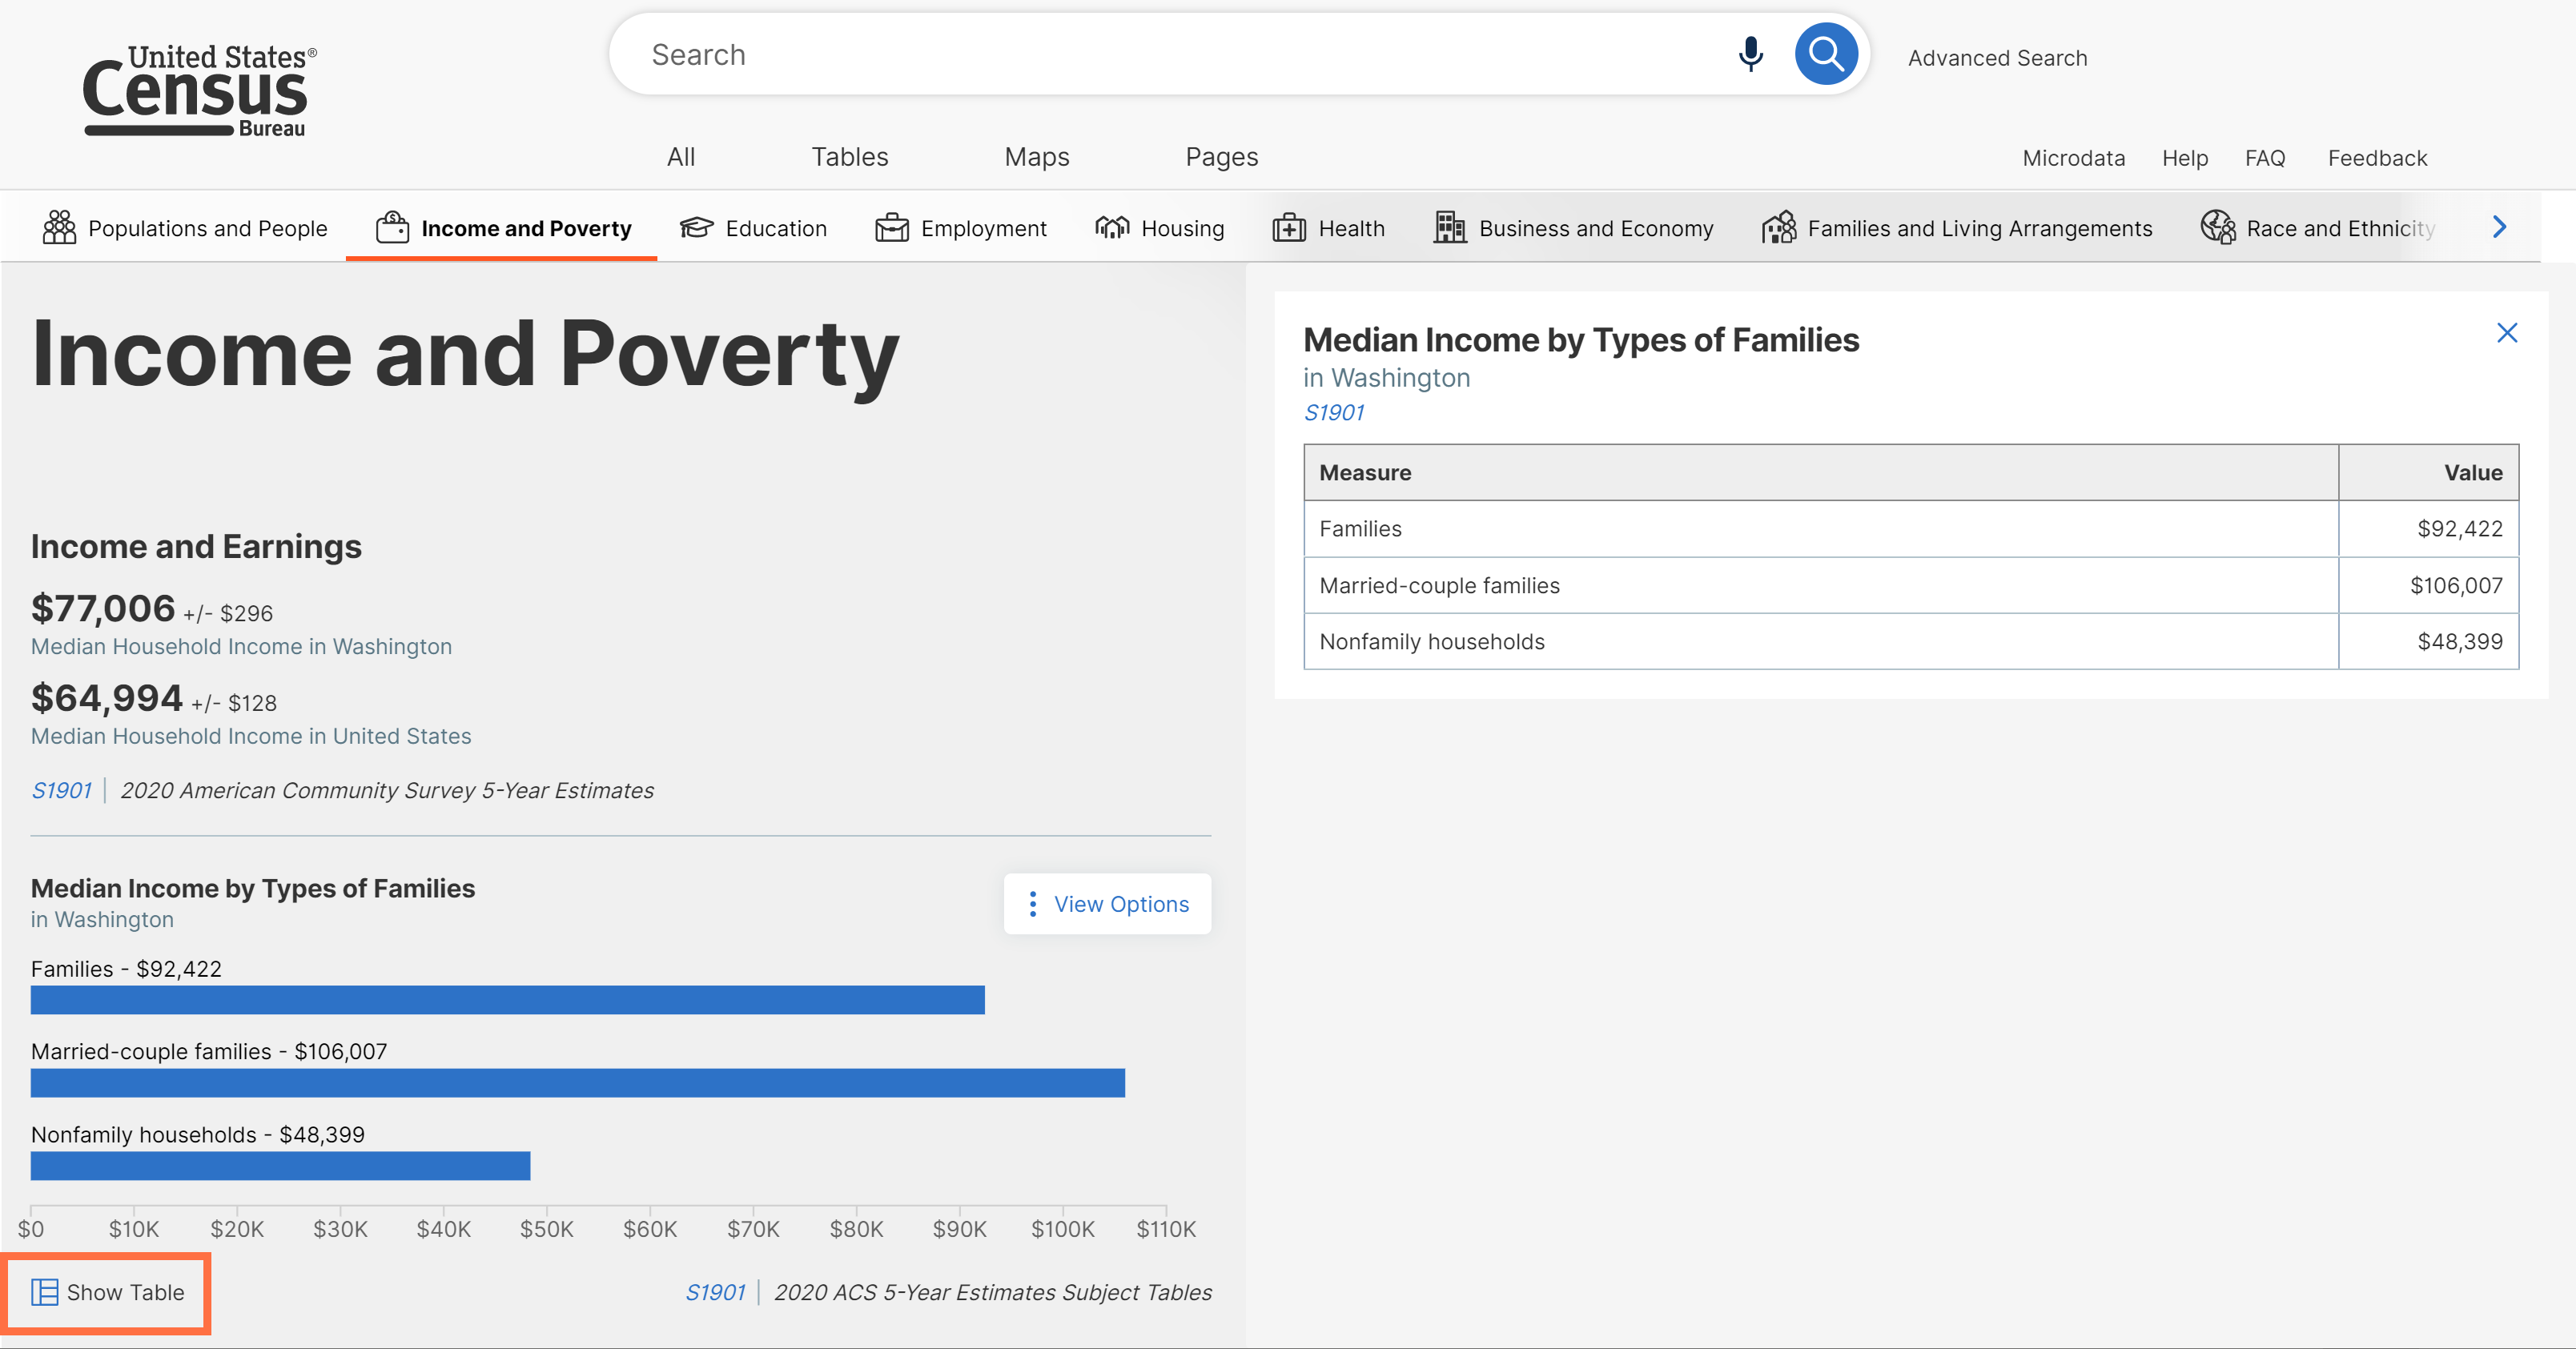
- Redesigned Profile pages:
o New source statements for highlighted statistics. These are provided by default, and you may turn off the “Display Sources” toggle to hide them from view.
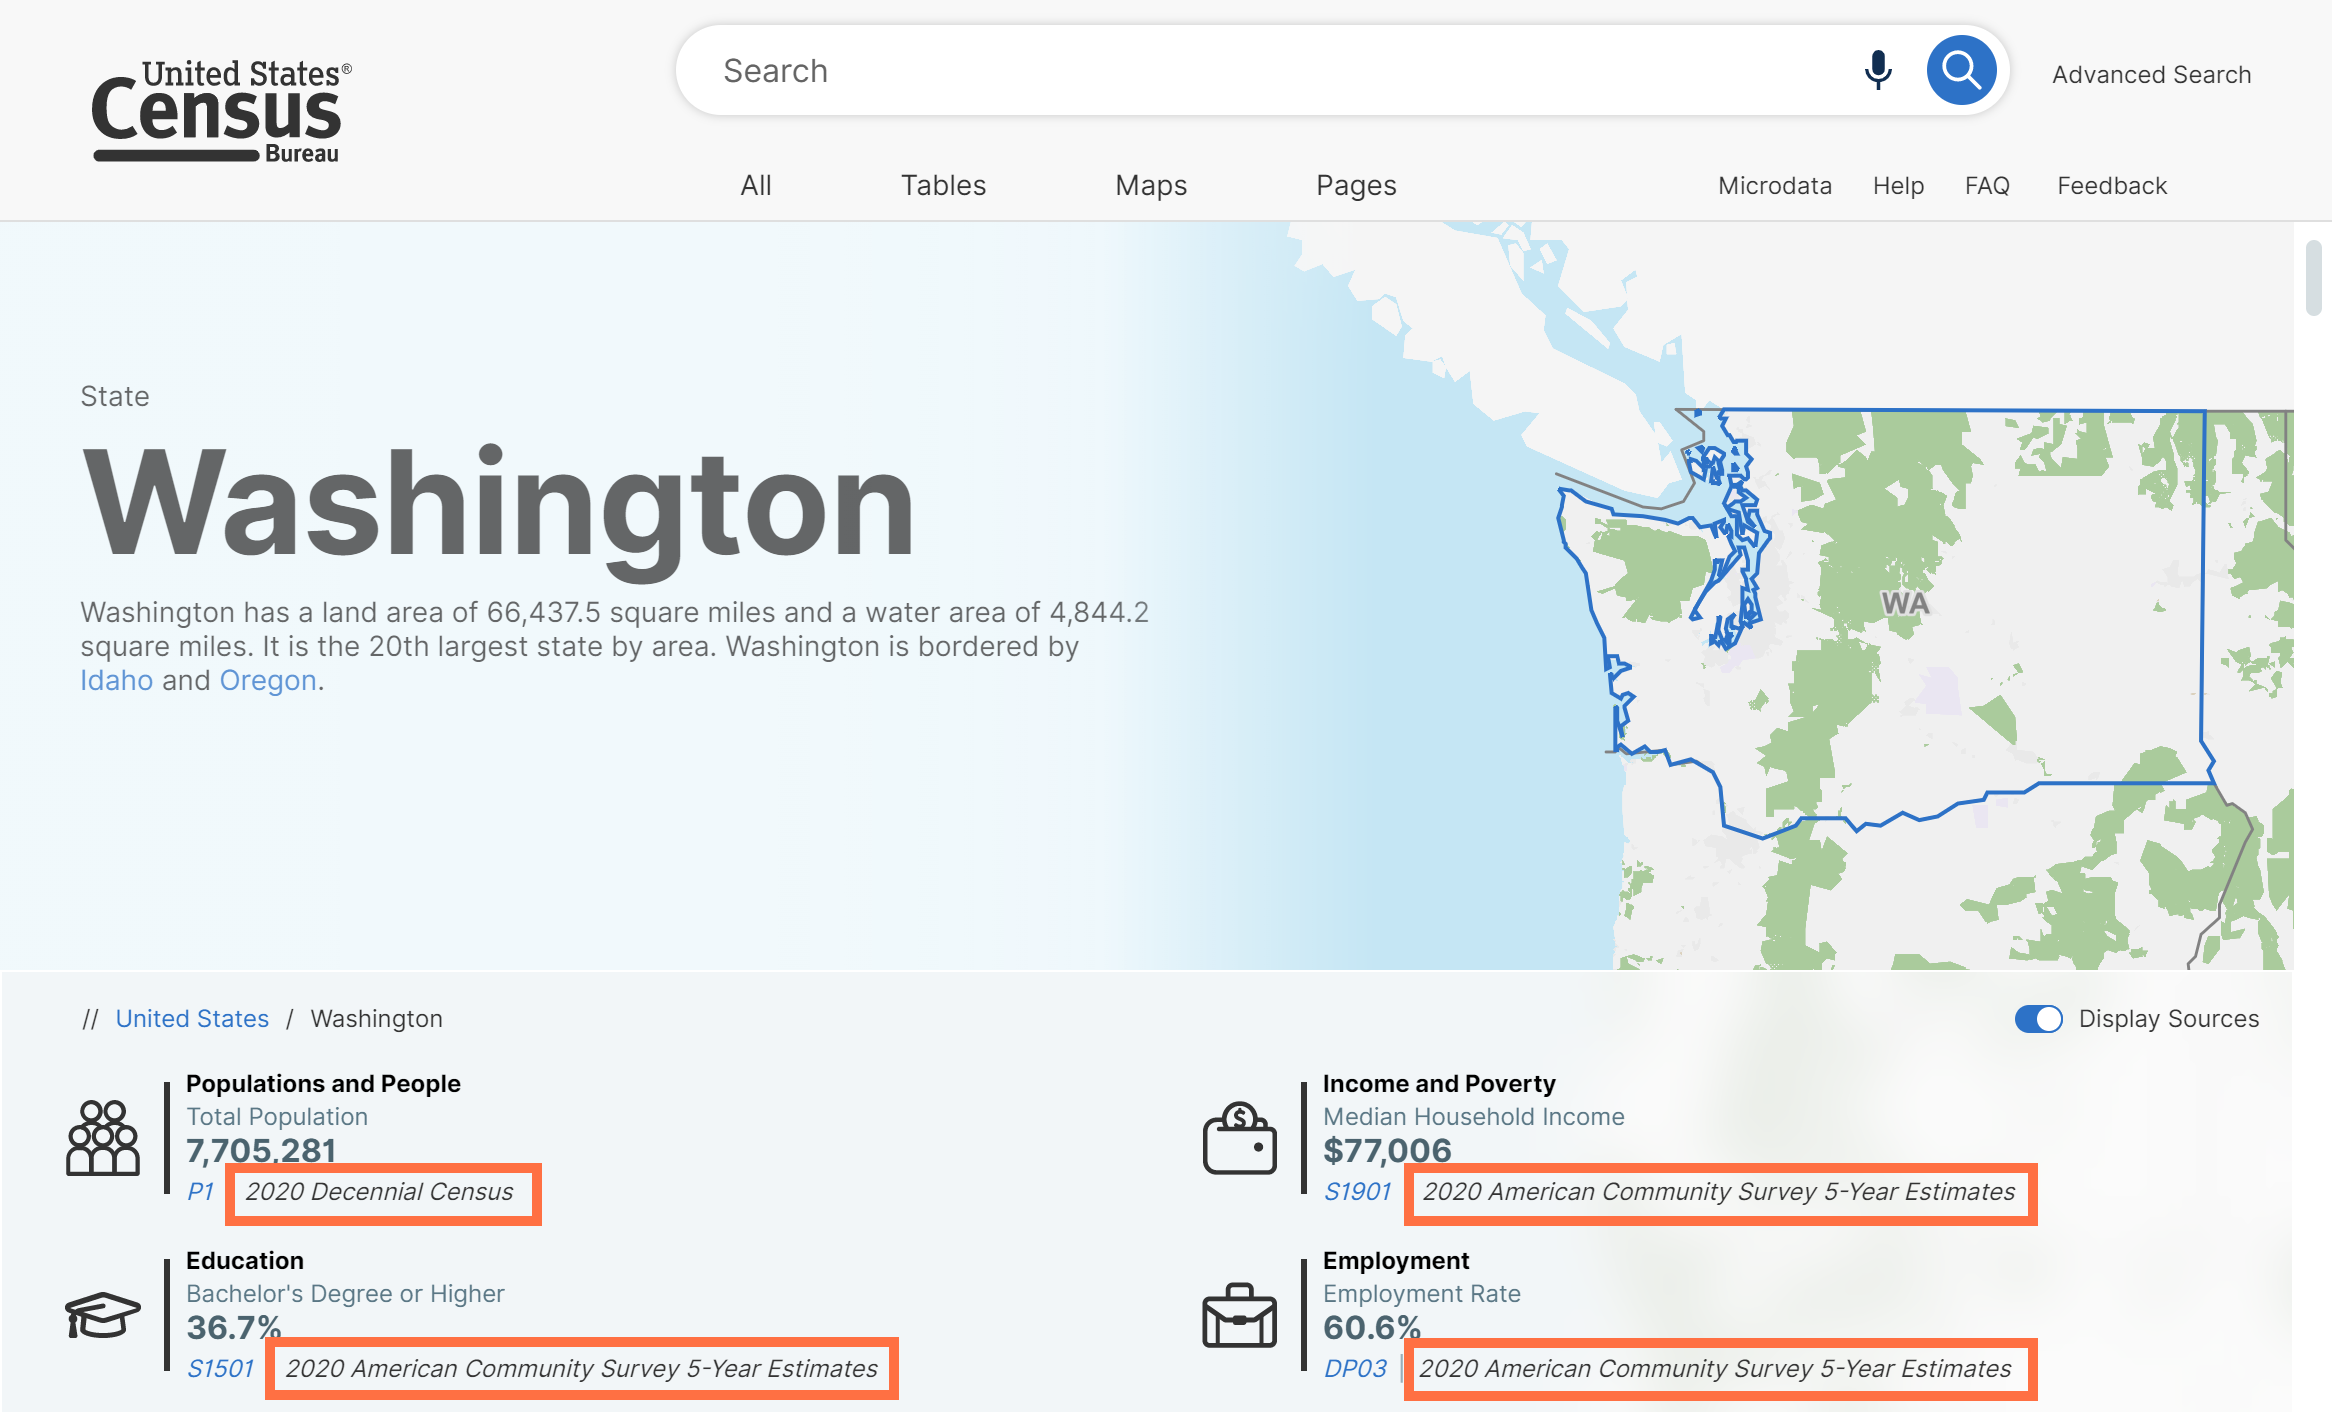
o Refreshed look and feel of profiles, along with an improved layout:
■ Key statistics and charts displayed on the left
■ Map shown on the right
■ New tabs at the top to navigate to the different sections of the profile
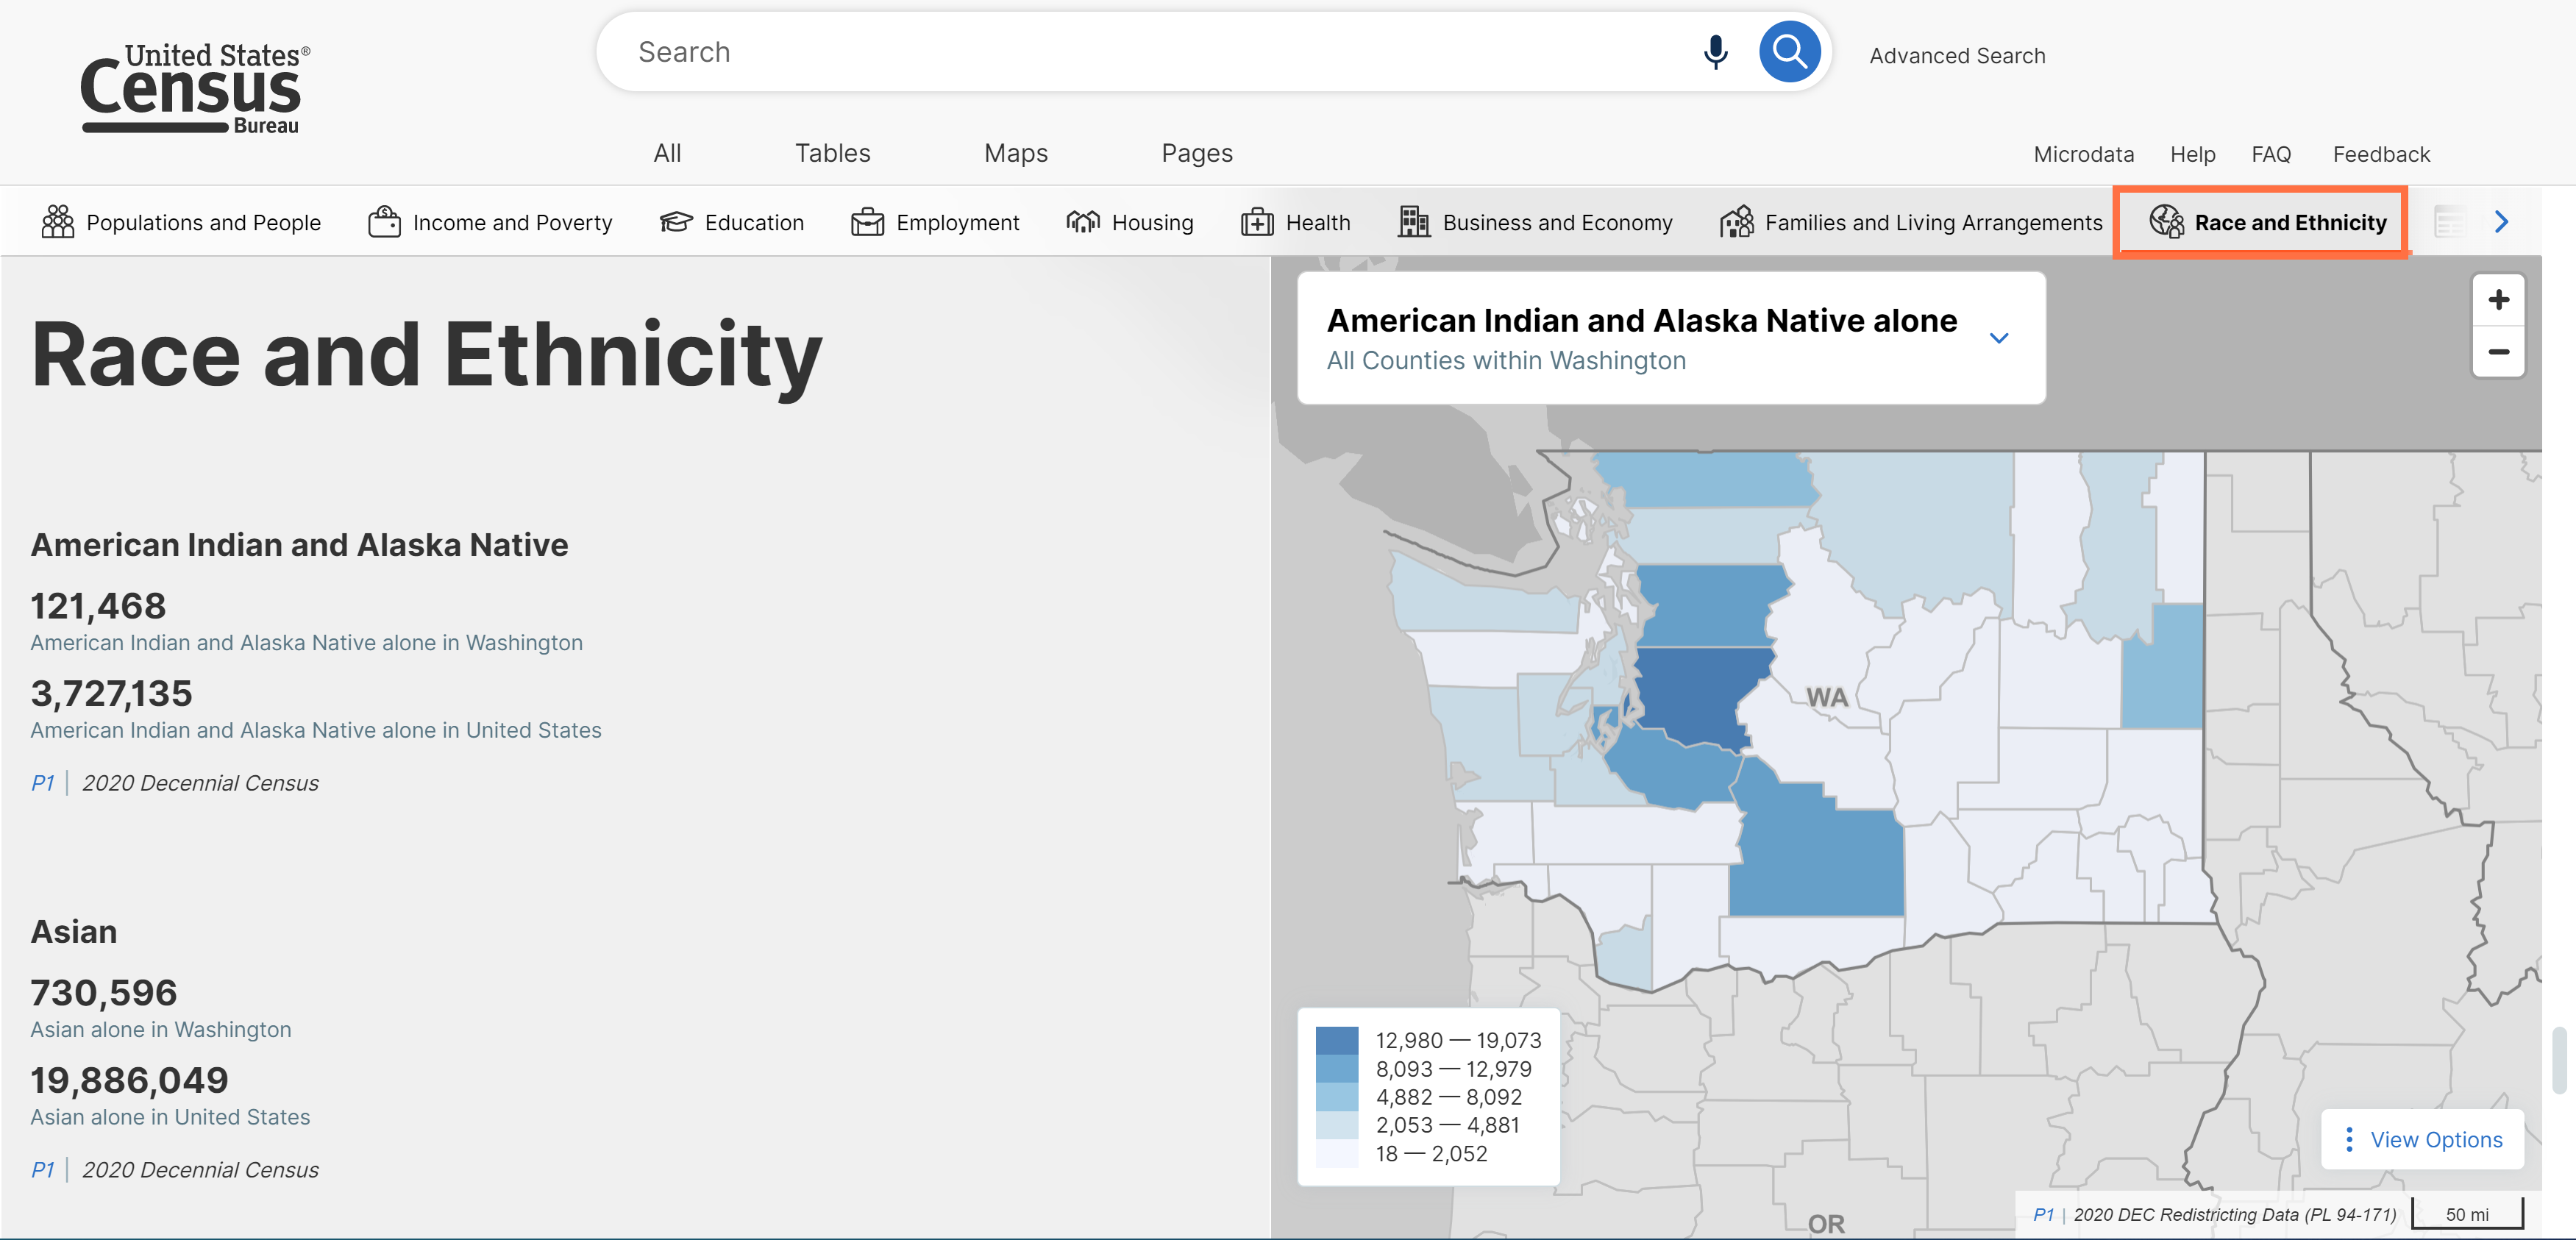
o Interactive map available at all times. Depending on which section of the profile you are clicked into, you will be able to interact with the map to:
■ Change the variable by clicking the drop-down menu
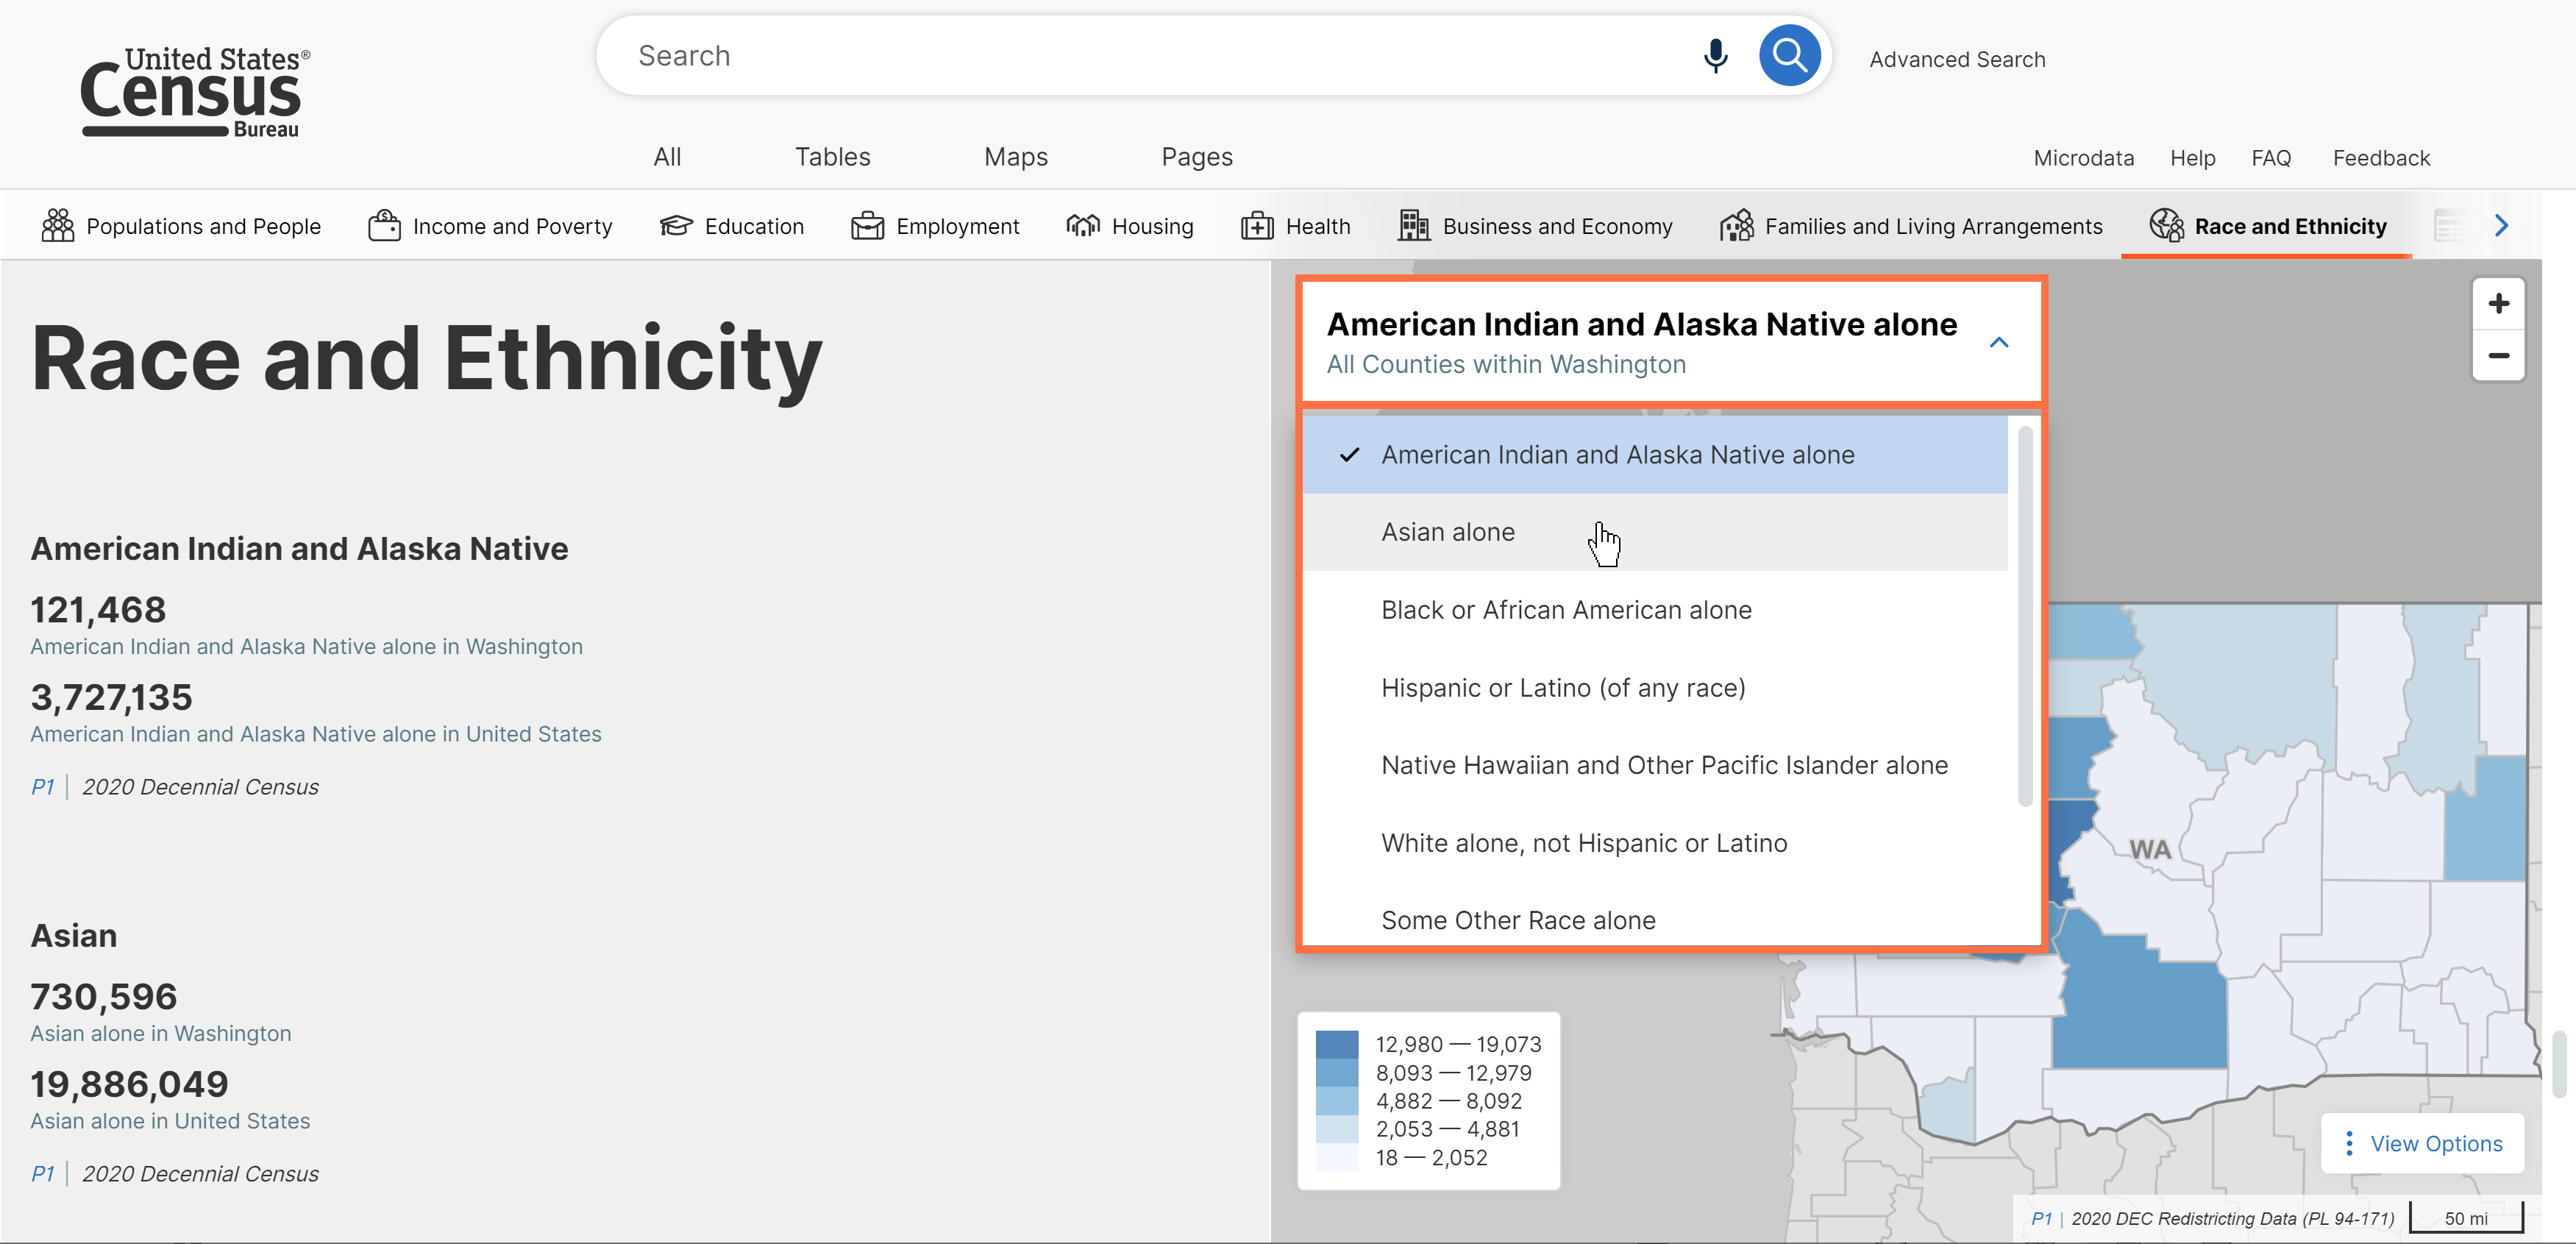
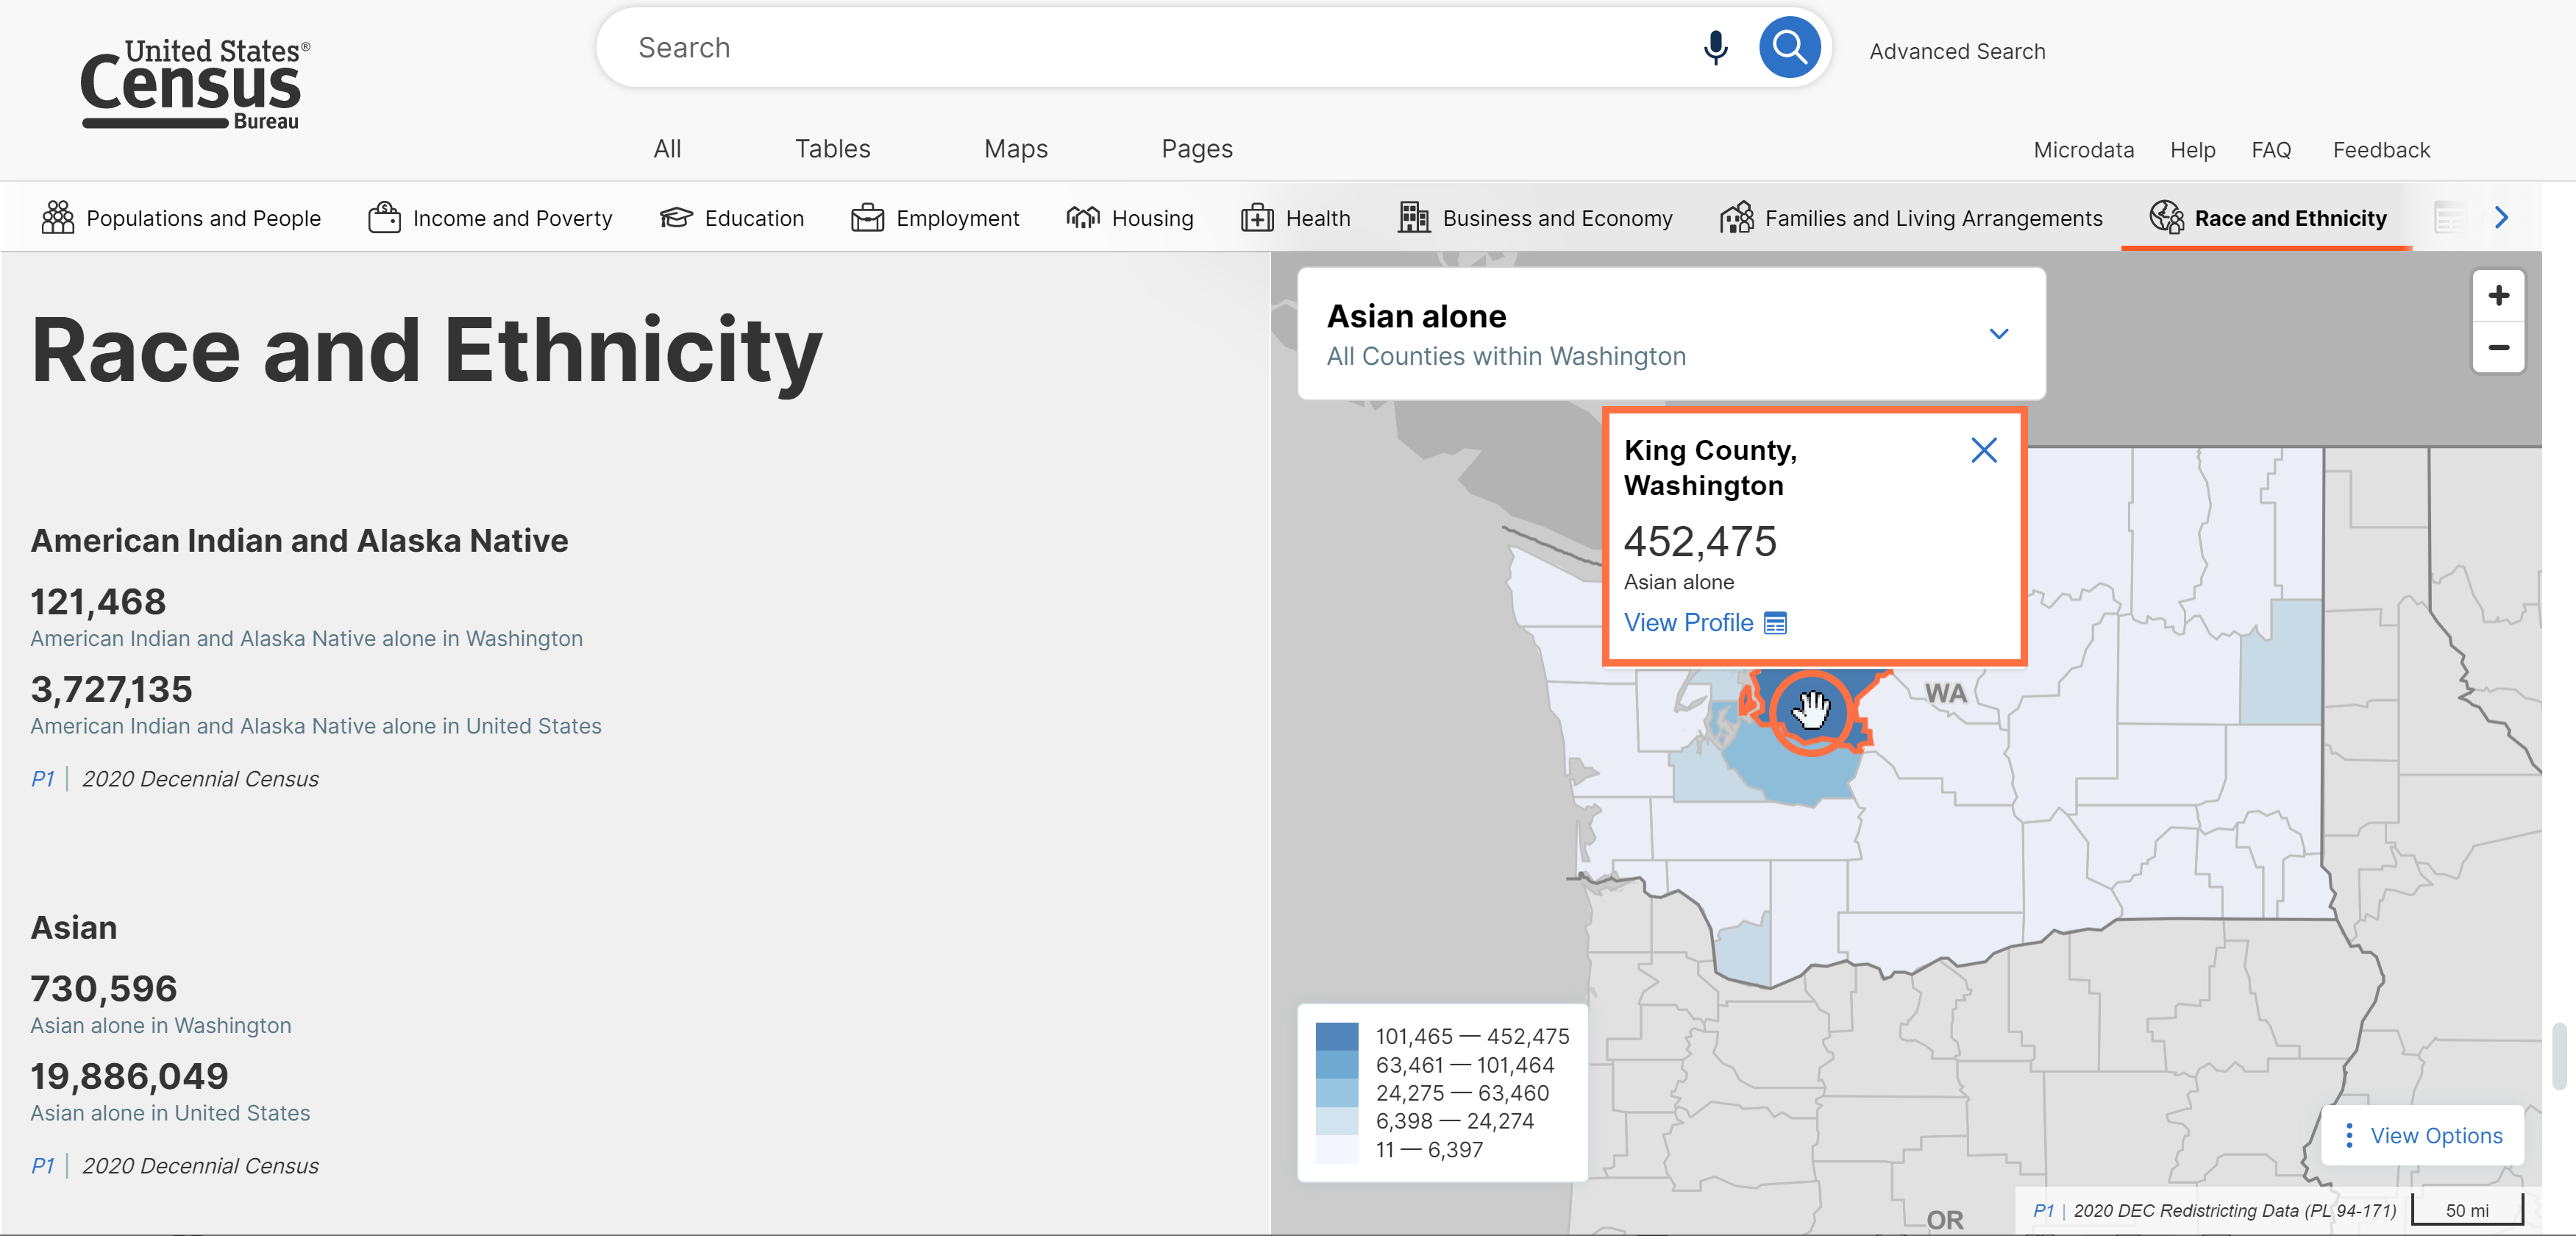
■ Click the map to view a data value or to get a link to navigate to that geography’s profile.
NOTE: Map data are currently only available in some sections of the profile. In the remaining sections, you can interact with the map to navigate to profiles views for related geographies.
o New “Show Table” link. This allows you to view data from the chart in a table format.
o Technical updates to profiles:
■ If a highlighted statistic is unavailable, the corresponding section of the profile will be hidden from view. This update makes it easier to see the data that are available for your area.
■ You may continue to use Ctrl + P to print the profile. With this update, it will print the active section of the profile that you are currently clicked into.
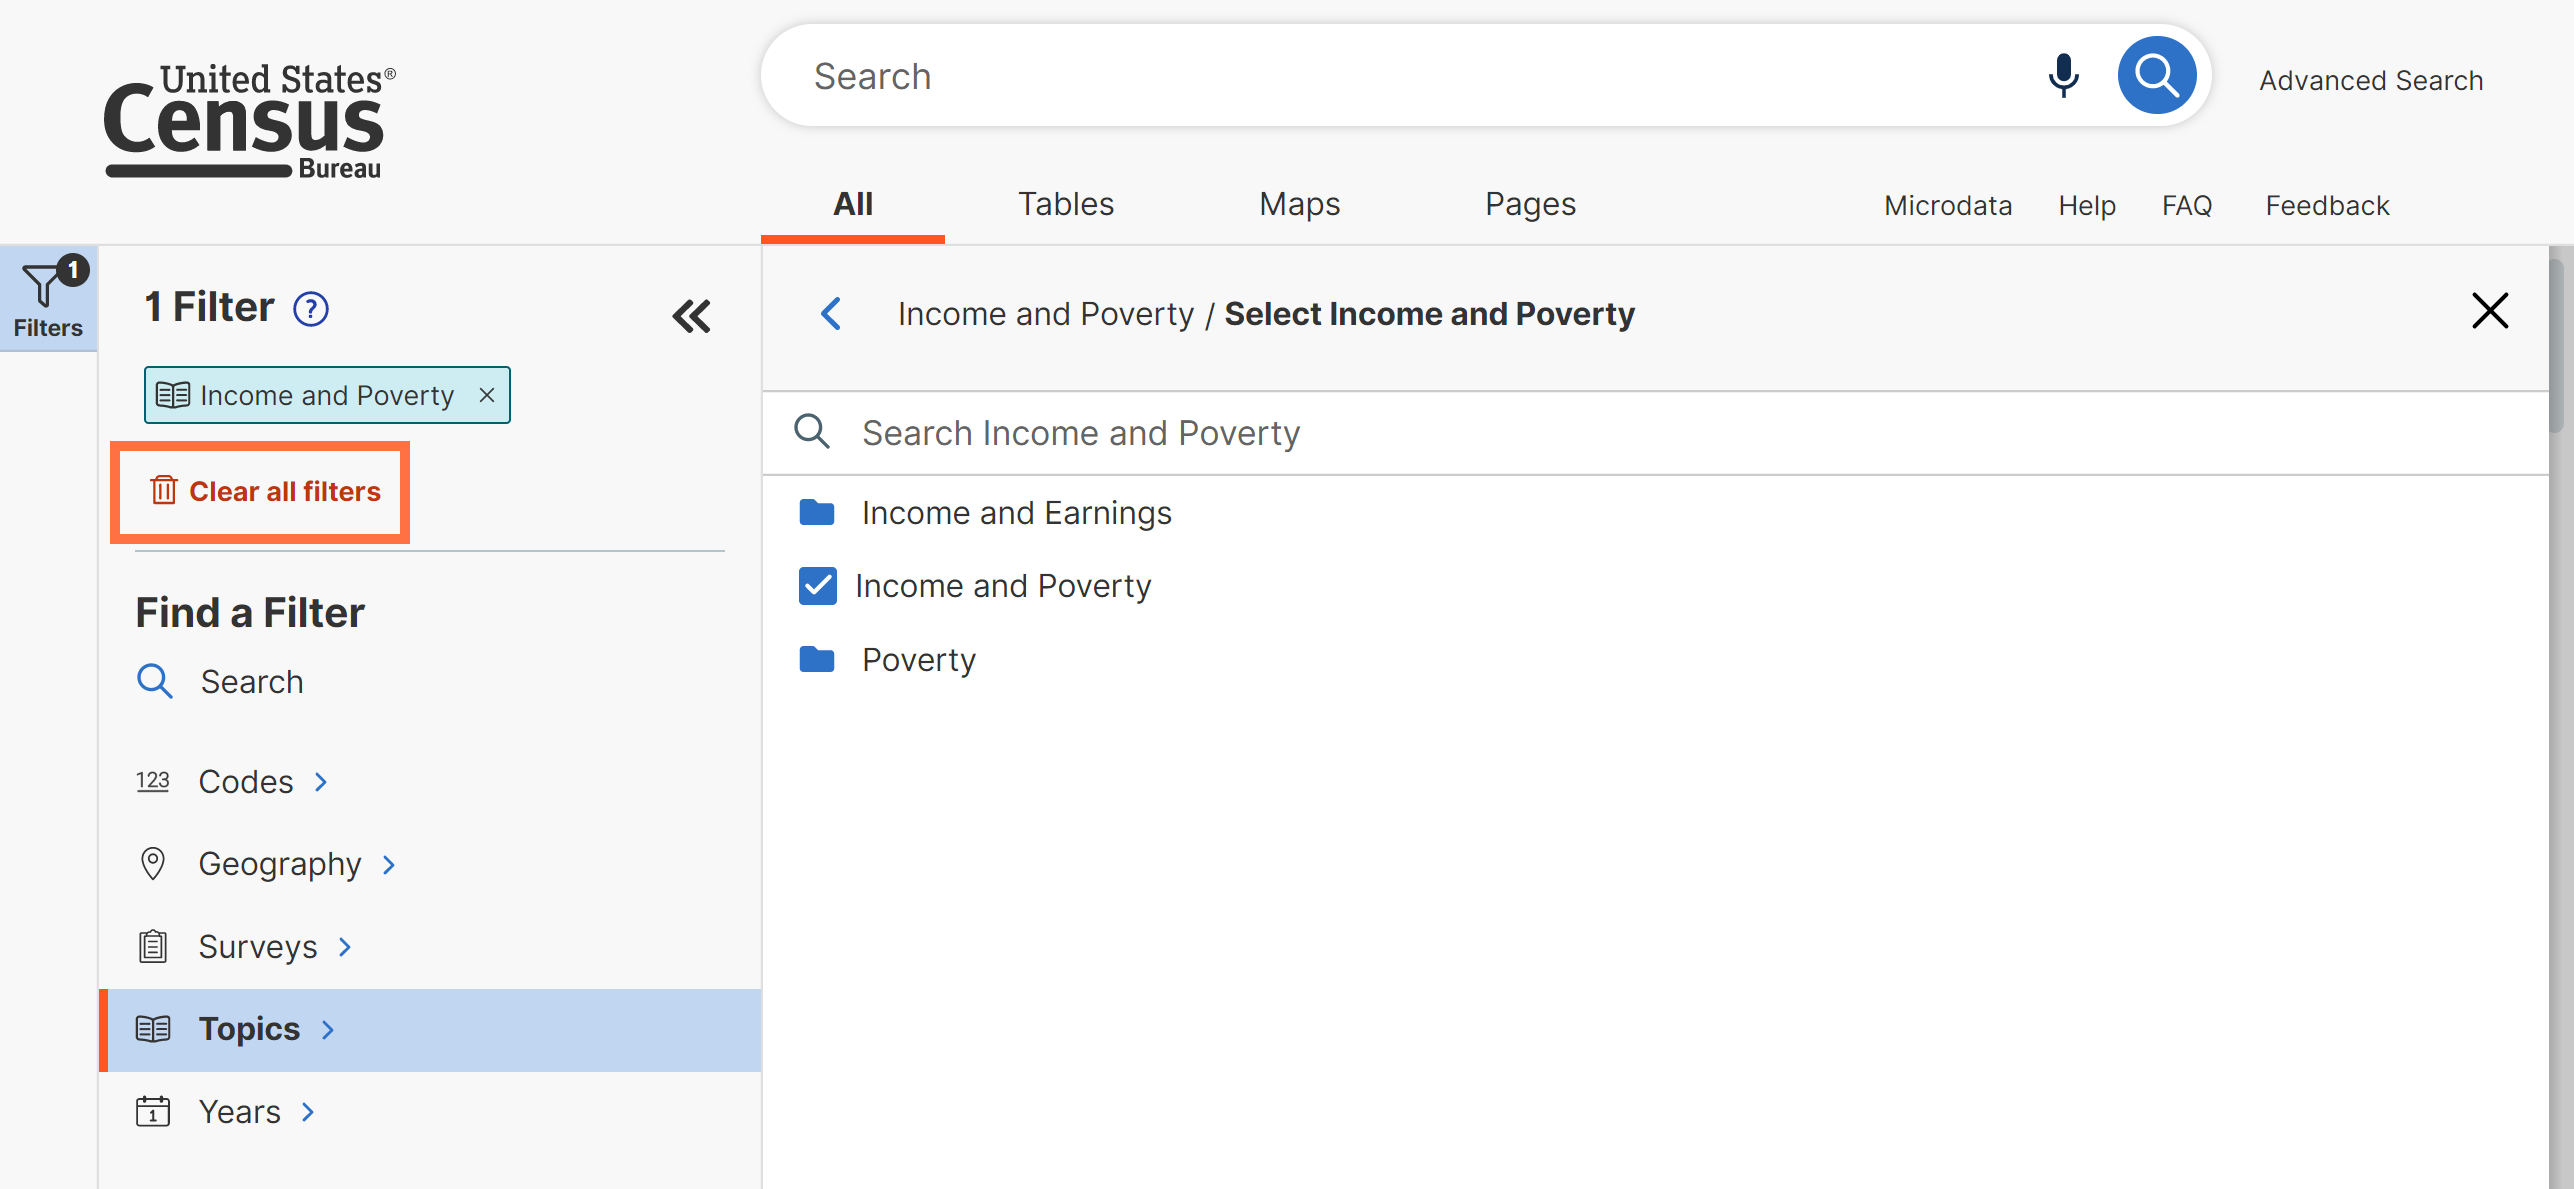
- Improved language to clear filters. It will now say “Clear search,” “Clear all filters,” or “Clear search & filters” depending on the type(s) of search criteria you have selected.
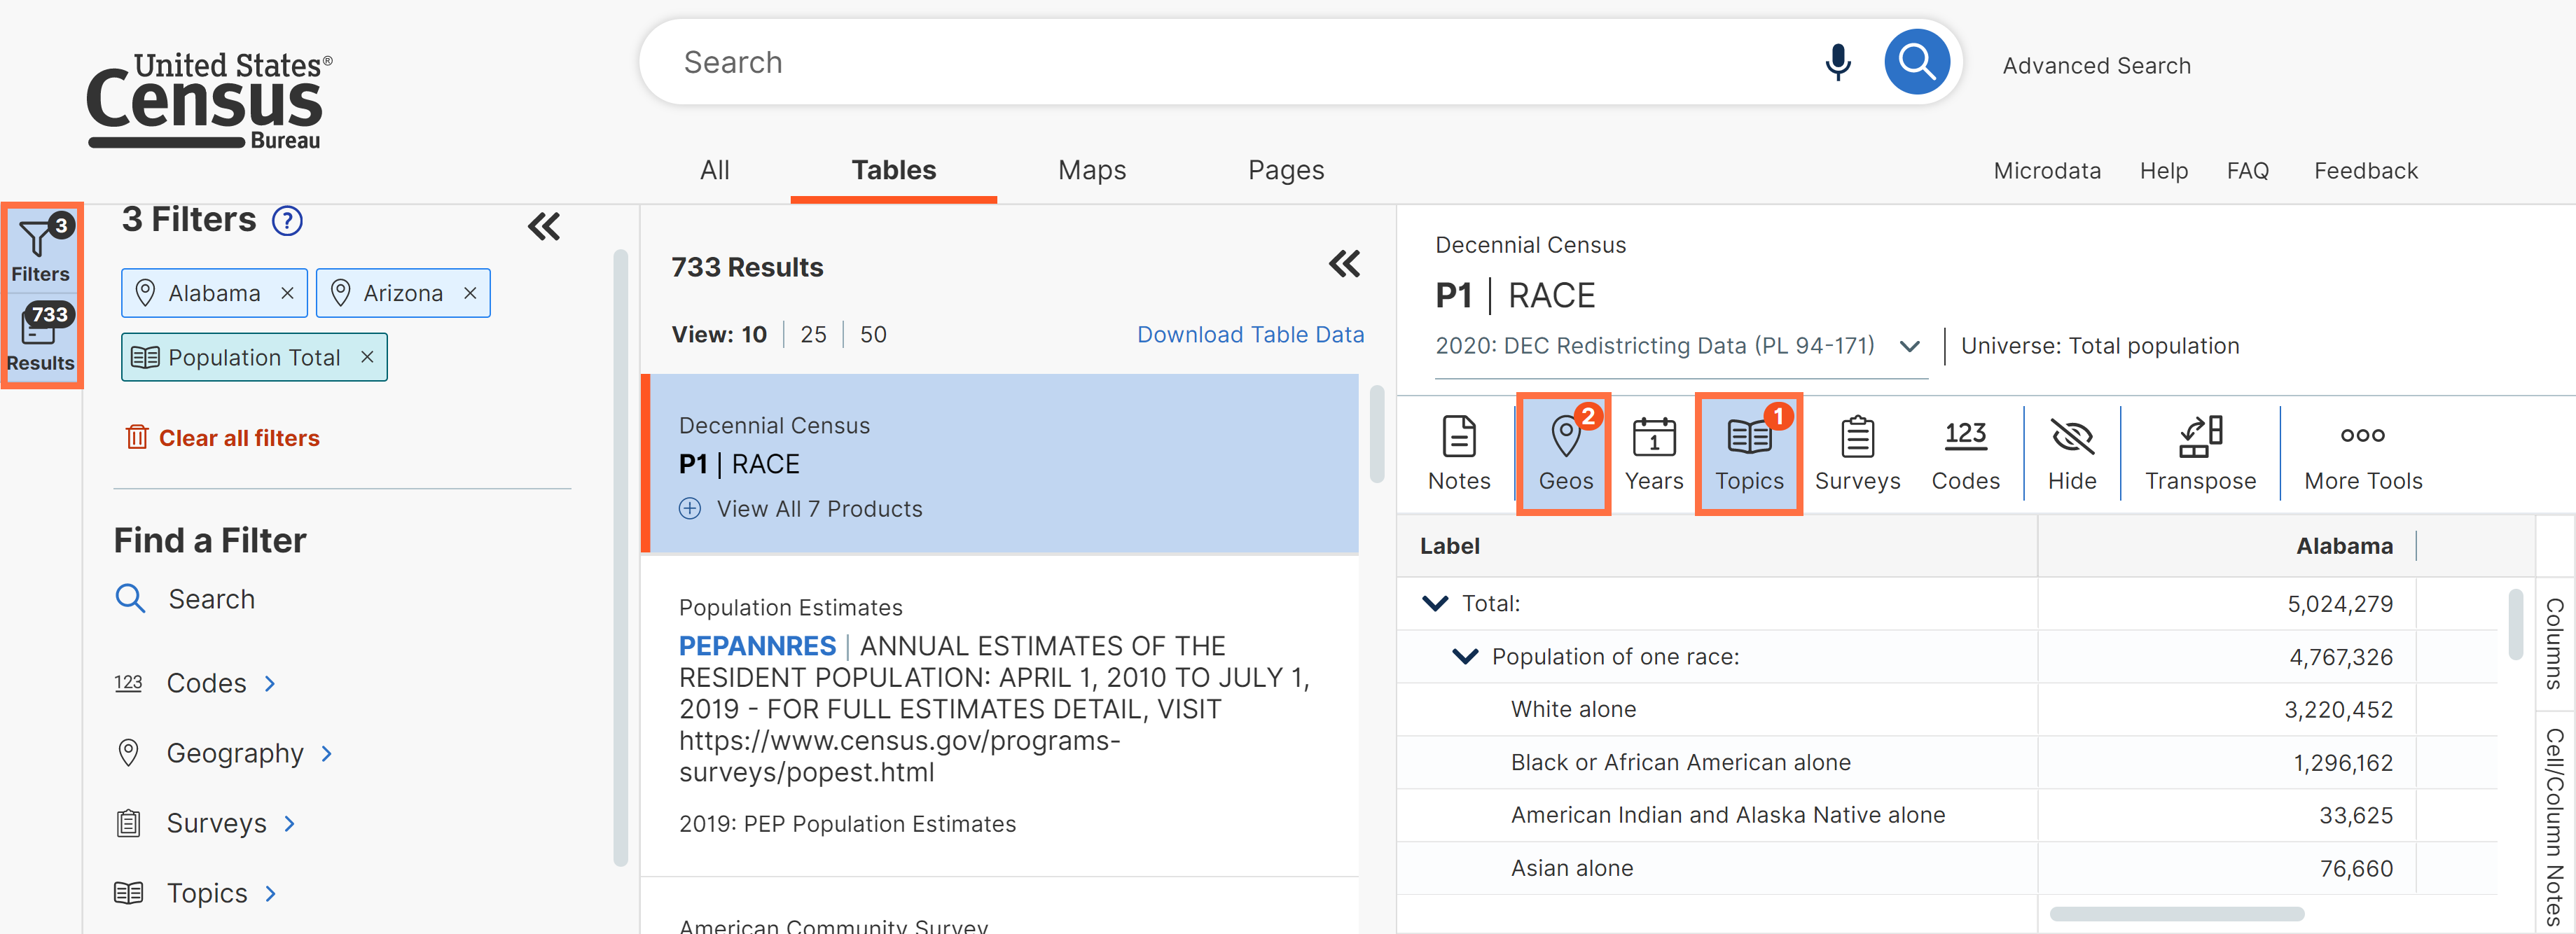
- Dot style indicator to more clearly see the number of table results and selected filters
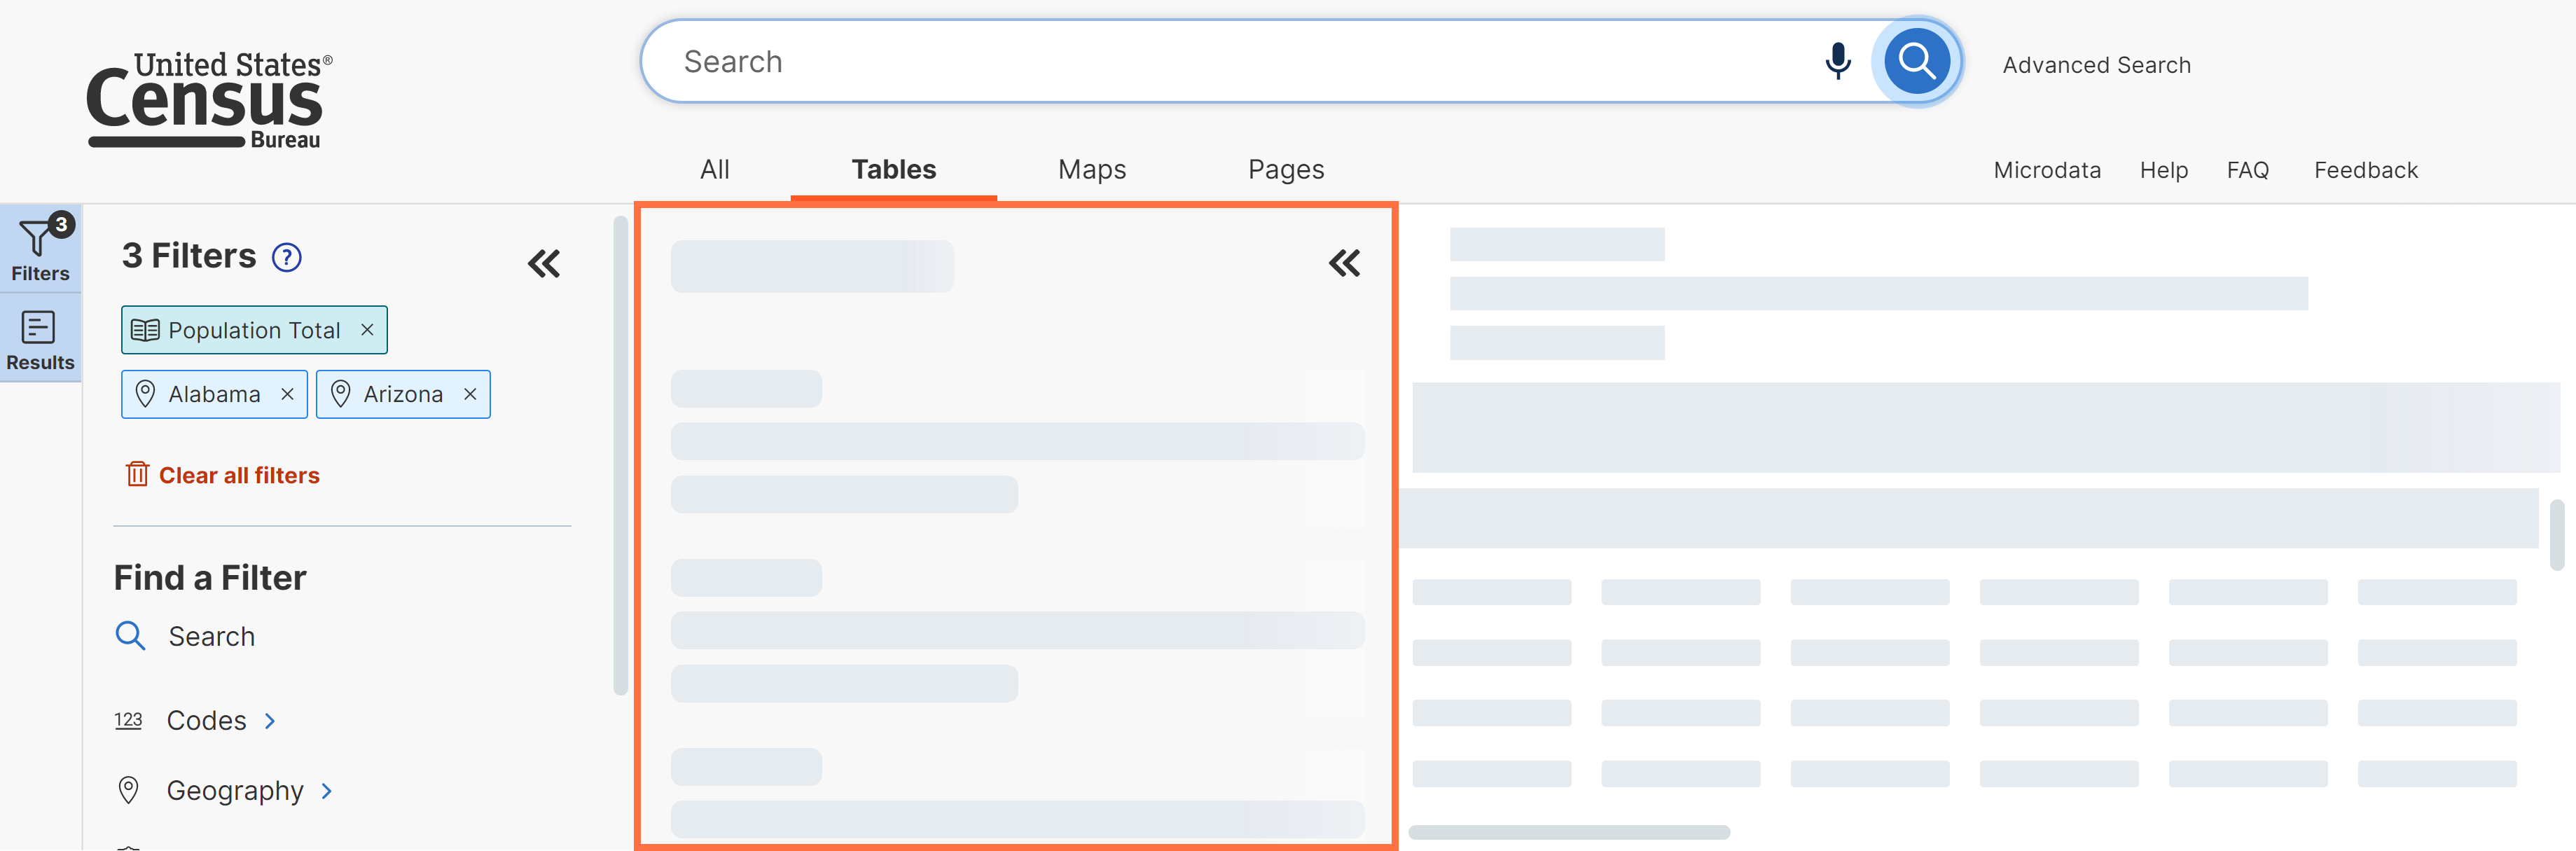
- Skeleton loading indicators added to the all results page, results panels, and filter panel items
- New hover effects applied across the site. These effects outline, expand, or shift clickable items your cursor is hovered over. The effects help draw your attention to important parts of the page that you can interact with using your cursor.
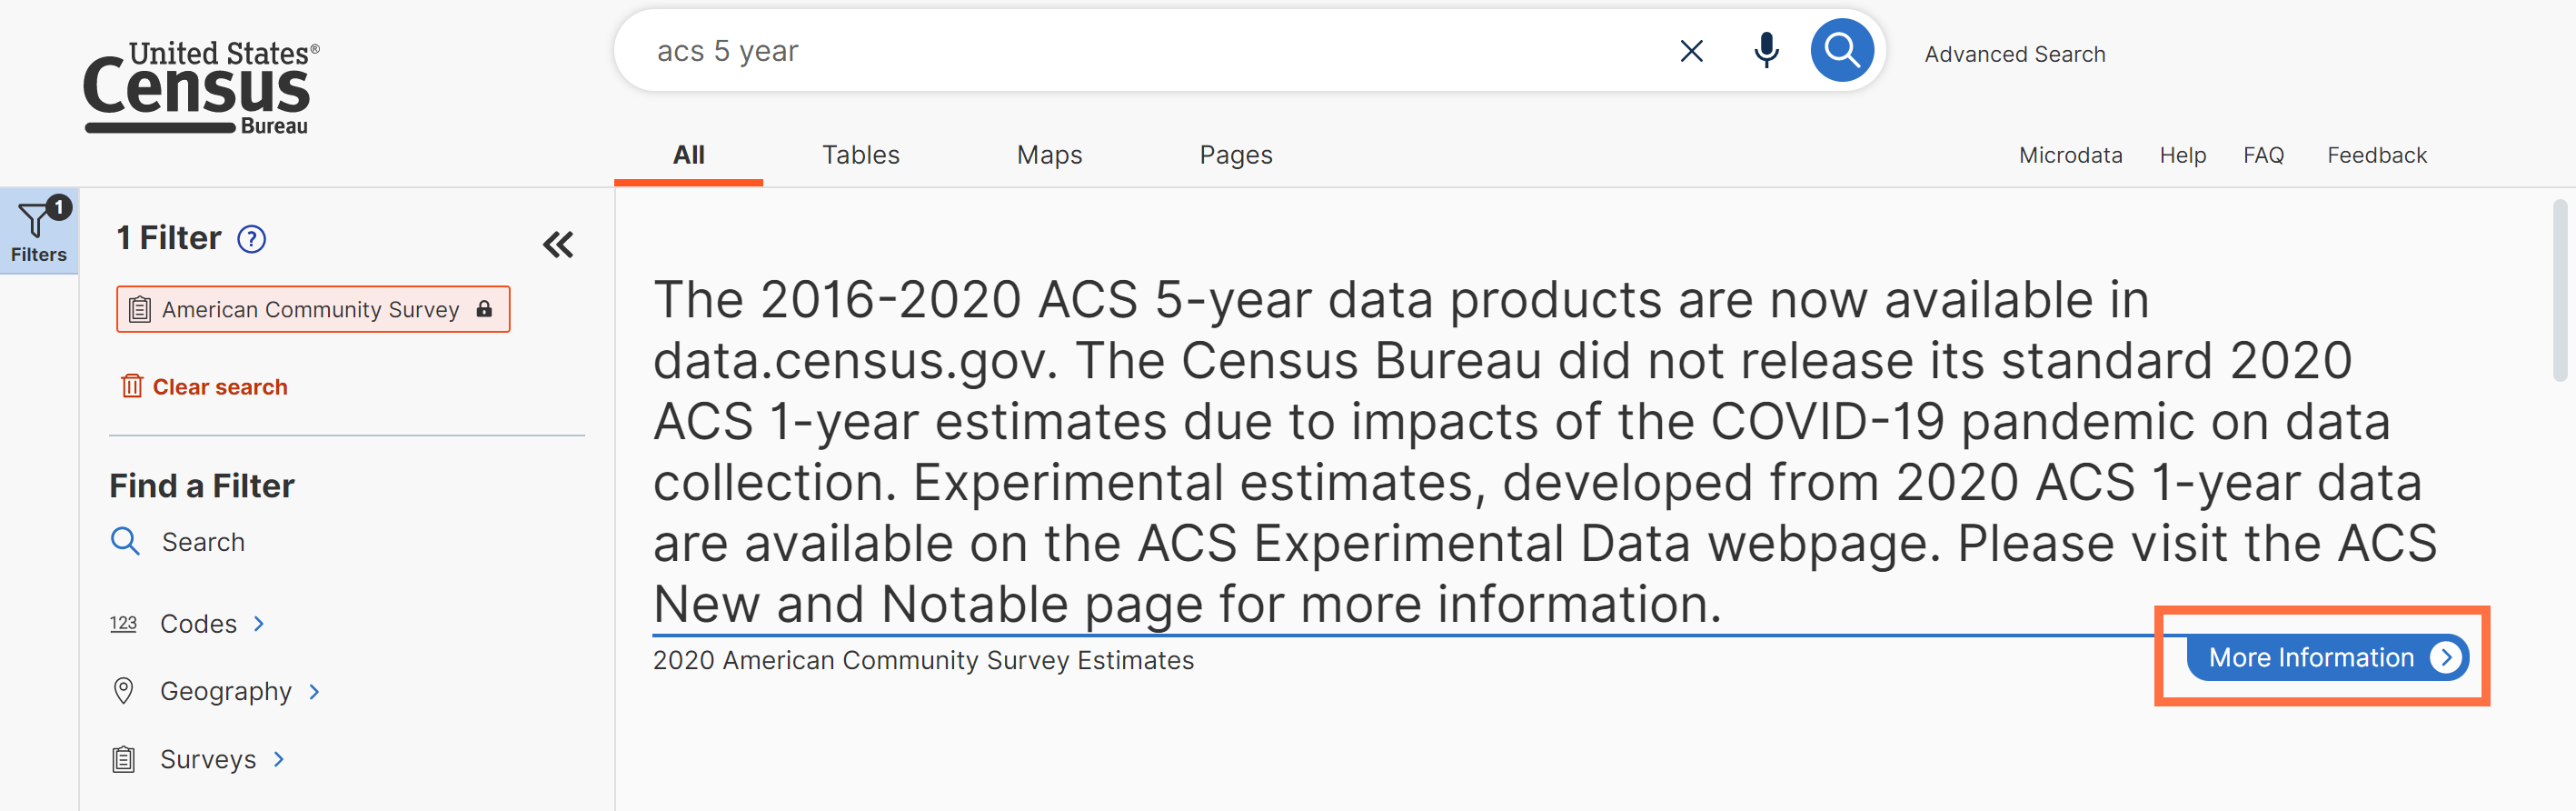
- New design for featured results and improved readability to provide a sentence-like format
- Updated featured result link for “ACS 5 Year” to read “More Information”
- Enhanced fonts for better appearance and consistency. Use of headers and large text whenever possible.
- Fixes to 20 defects, including fixes that allow you to:
- See typeahead search suggestions for the most common types of geographies
- View tables for 2000 Census by detailed population groups (race, Hispanic Origin, etc.)
- Maintain the dataset you are clicked into when changing the year in your map
- Recode continuous variables using Microdata Access
- Open URLs to saved tables created in Microdata Access with Puerto Rico datasets
On June 9, we released the following updates to the site:
- New search bars that allow you to search within filter panels as an alternative to scrolling through long lists. These search bars appear at the top of each filter panel. We applied this feature to all geography, topics, surveys, codes, and years filter panels.
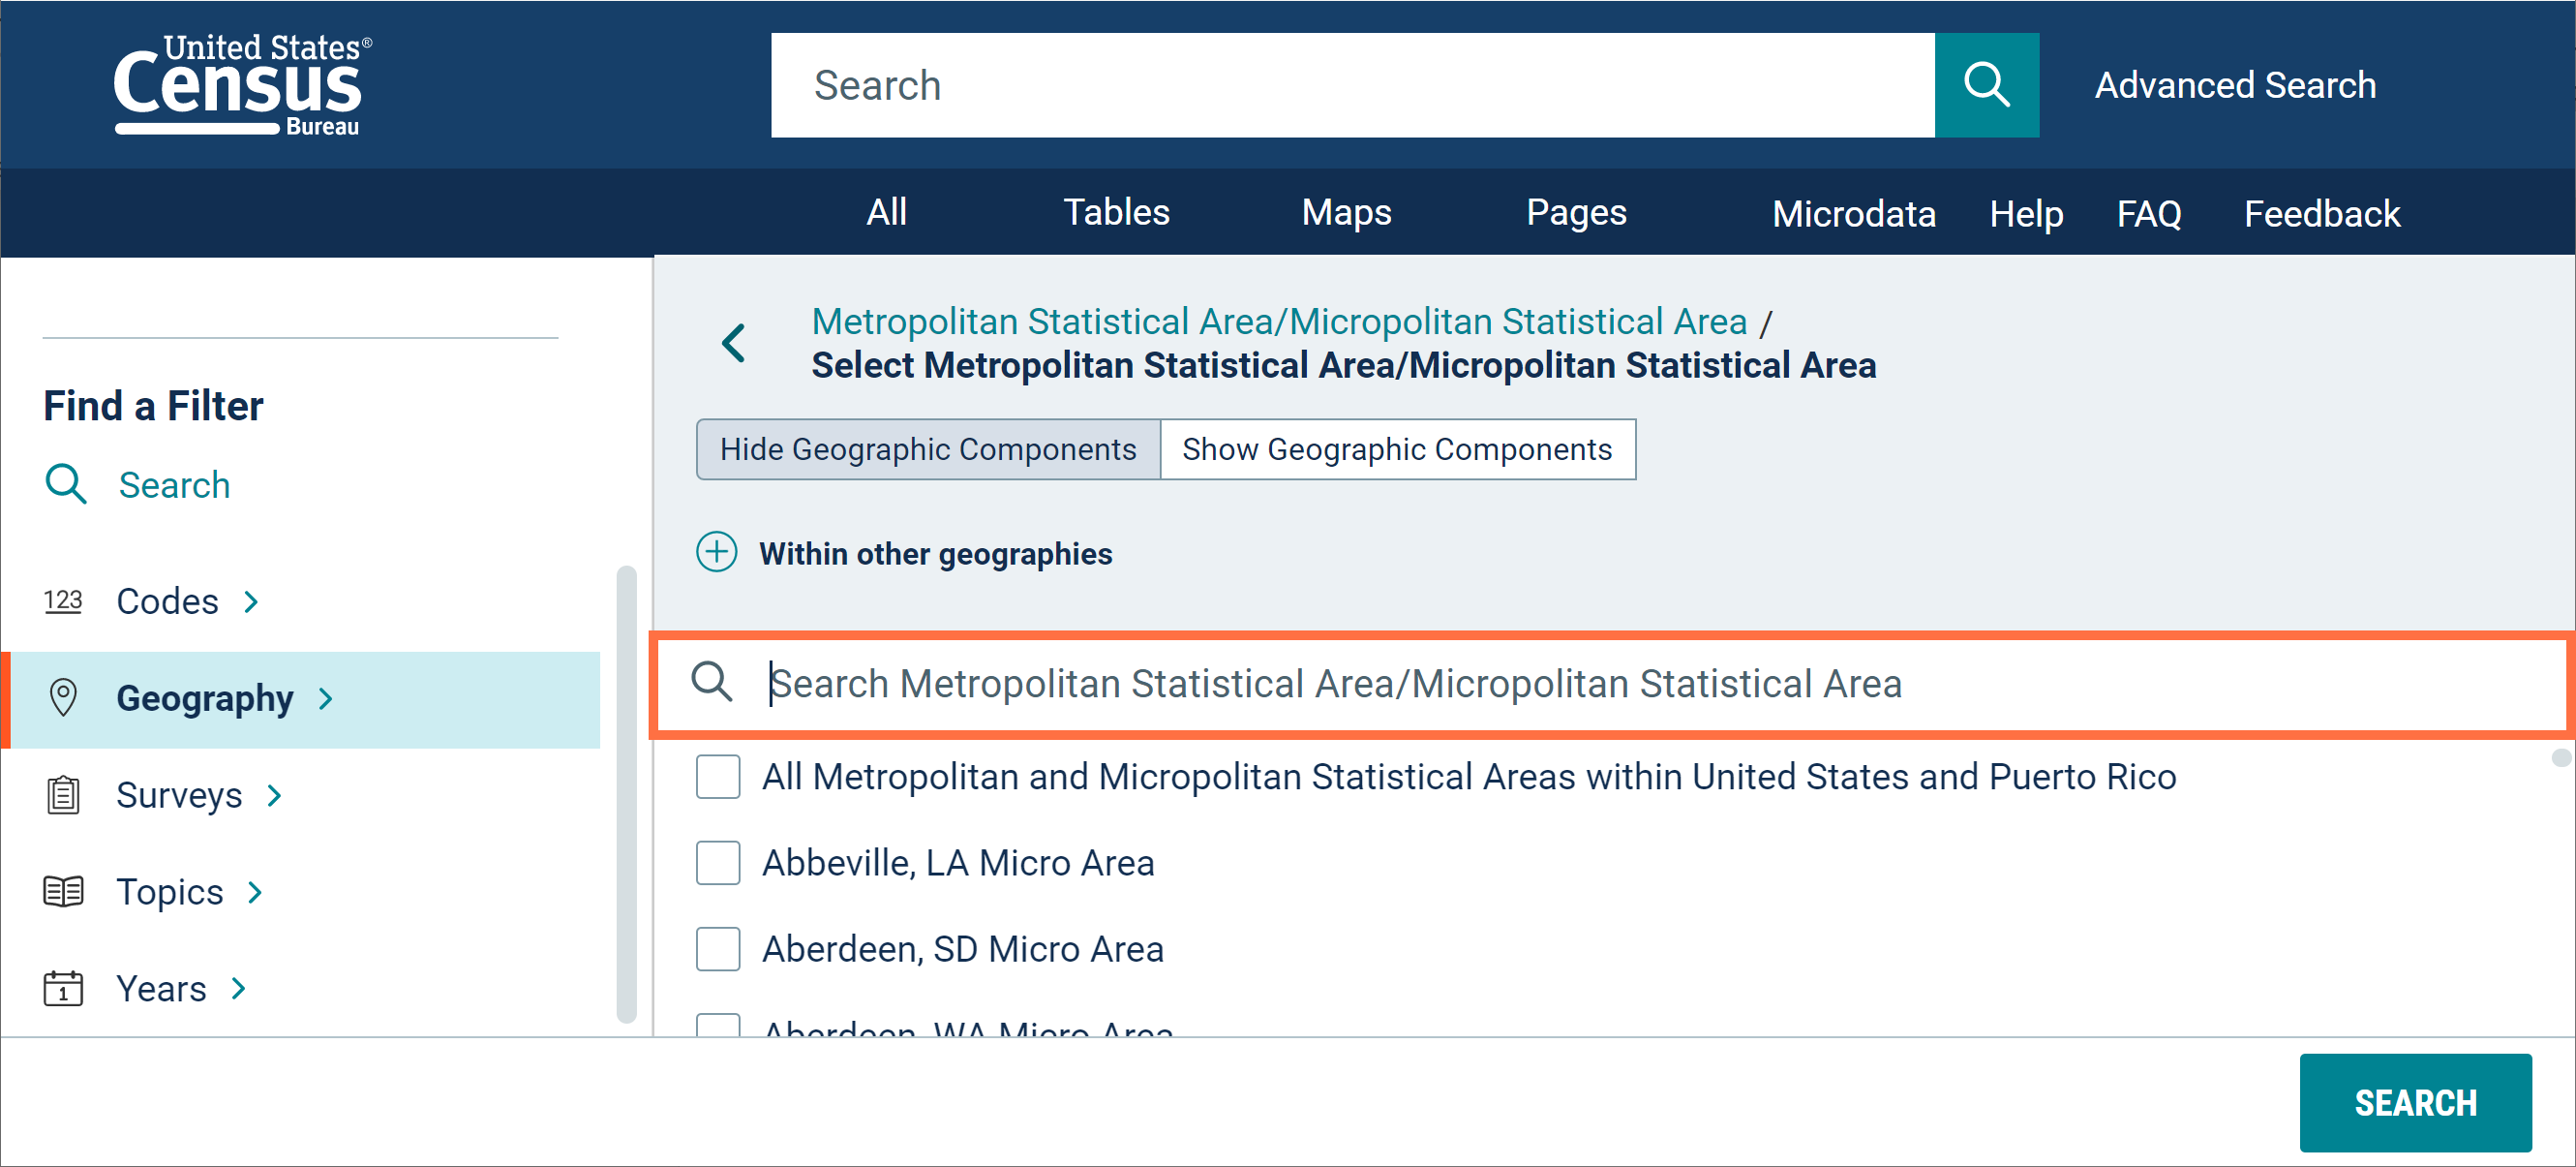
To use the search within filter panel feature, you must type a minimum of 3 characters. You will get results for any option in the list that contains an exact text match for your search. For example, a search for “Reno” in the metropolitan/micropolitan statistical area filter panel will pull up a match for the “Reno, NV Metro Area.”
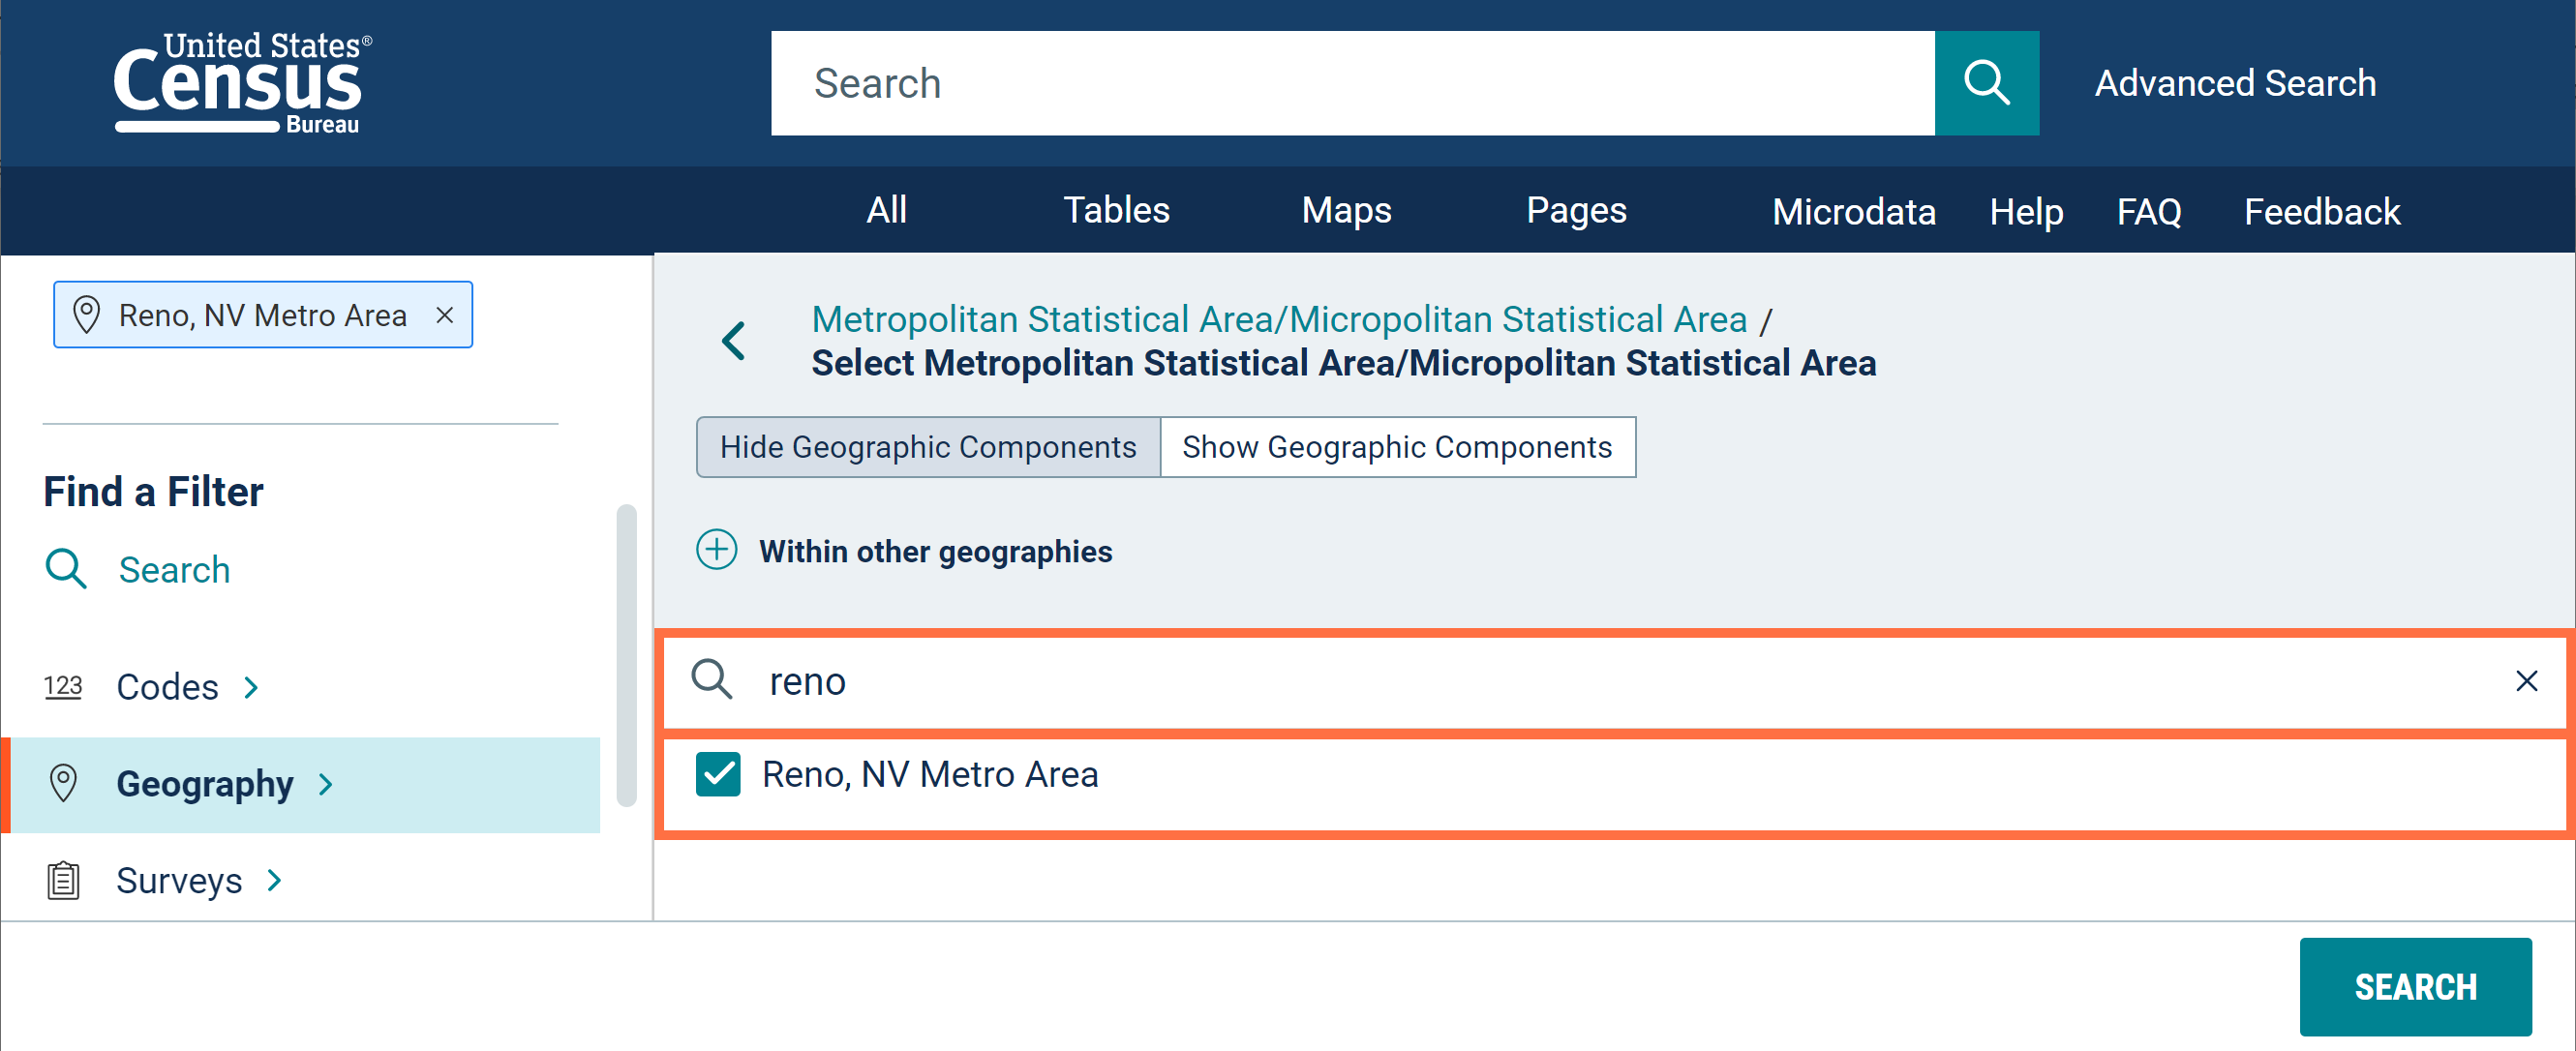
Almost all these new search bars allow you to search the content of a single list.
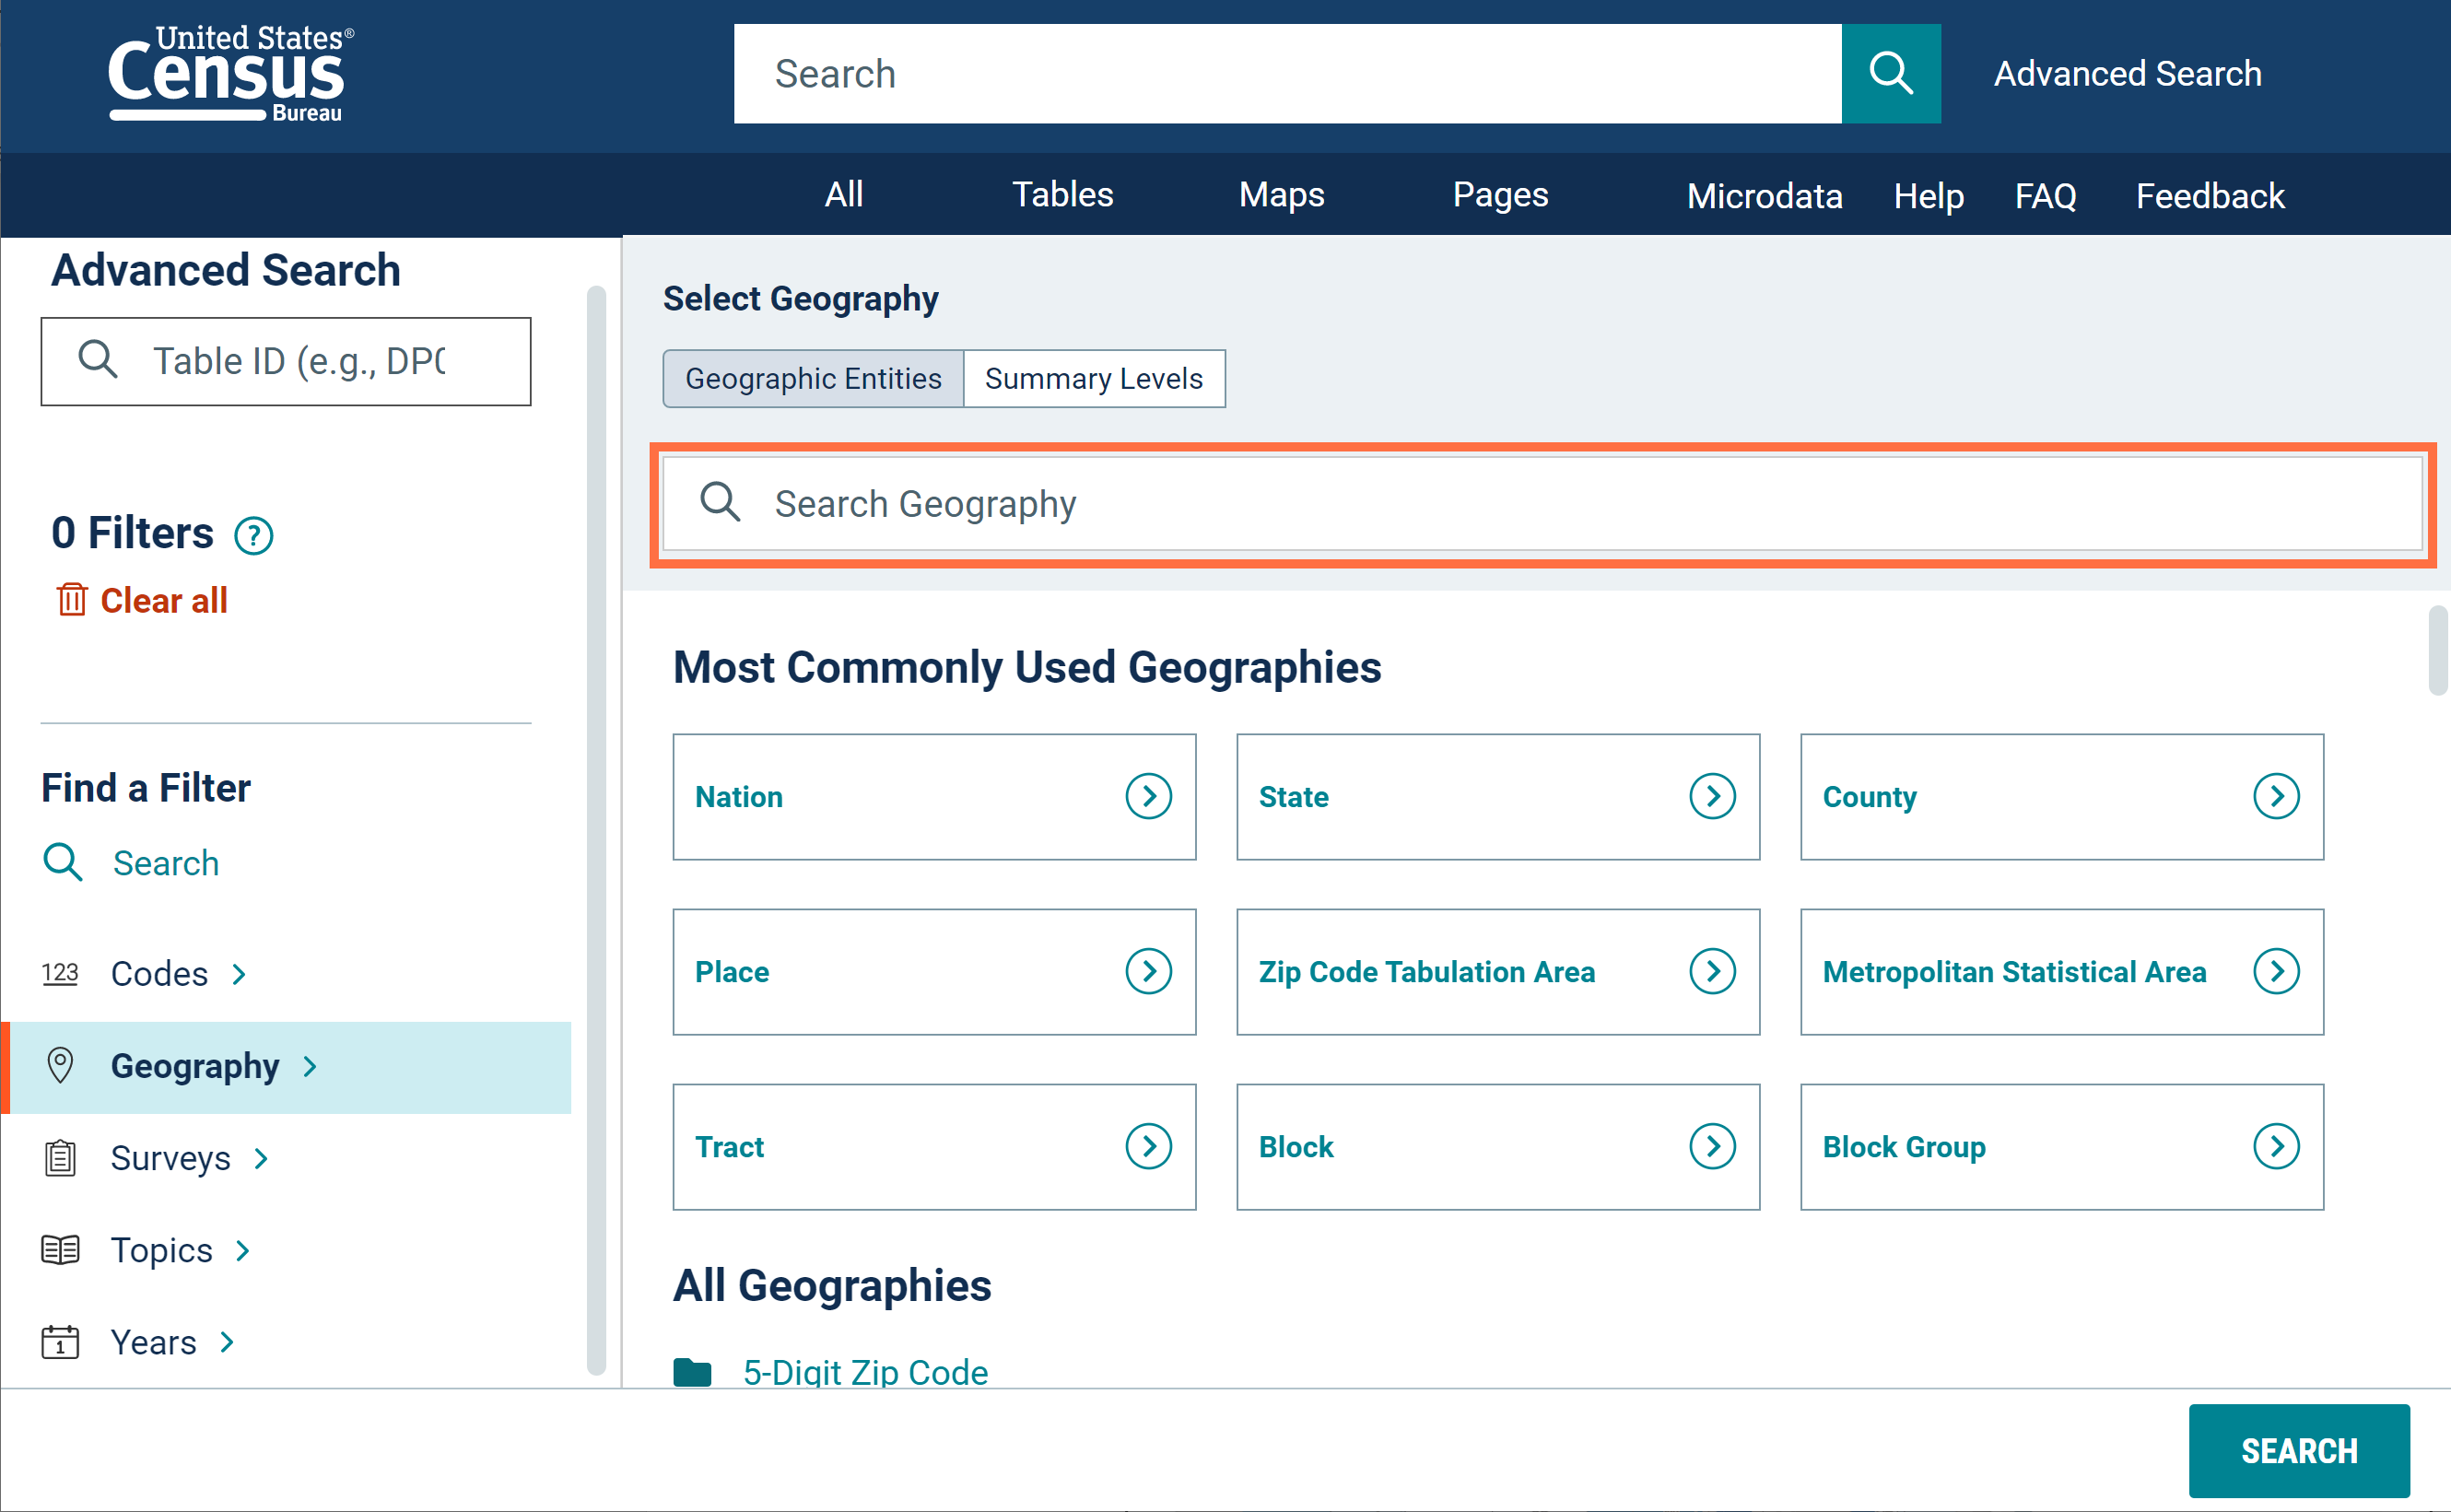
However, the new “Search Geography” box at the top of the main geography filter panel is a global geography search bar. Using this search will look for results across all types of geography filters that match your text and is not limited to the words and phrases on this one page.
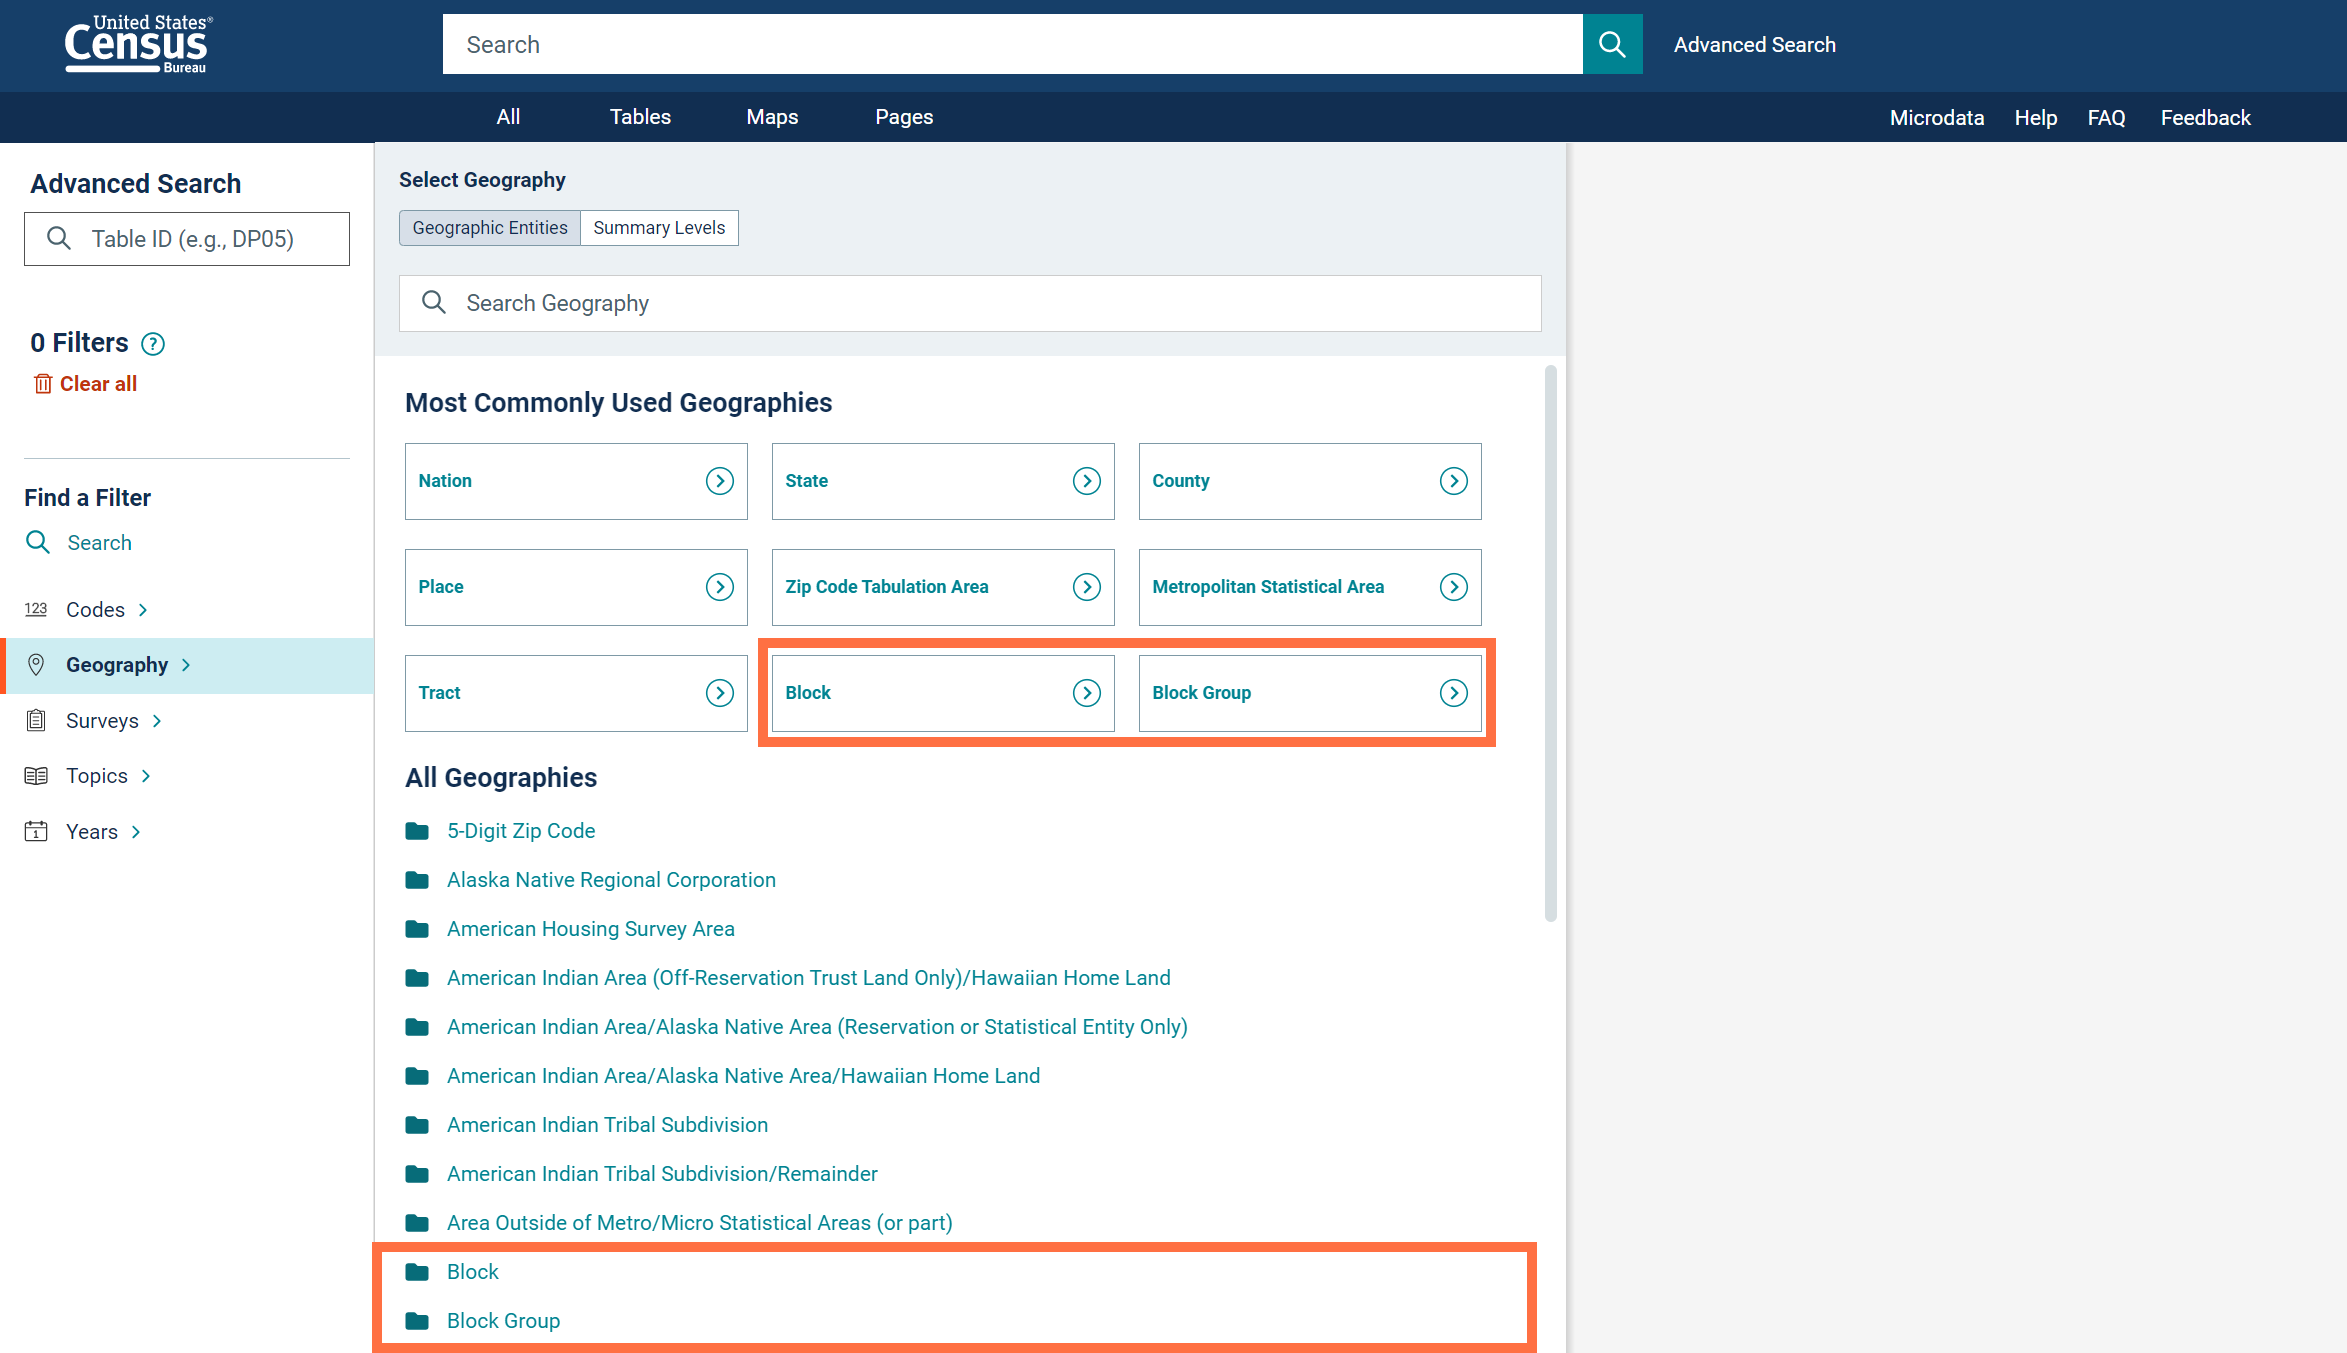
- The most common geographies are also included as folders in the updated list of “All Geographies” in the filter panel. We made this change to provide a complete list and make sure the most common geographies are accessible in both places.
- New options to specify custom manual breaks in your map legend. We offer two ways to do this:
o Click the “Classes” button and use the text boxes to edit, add, or delete legend values.
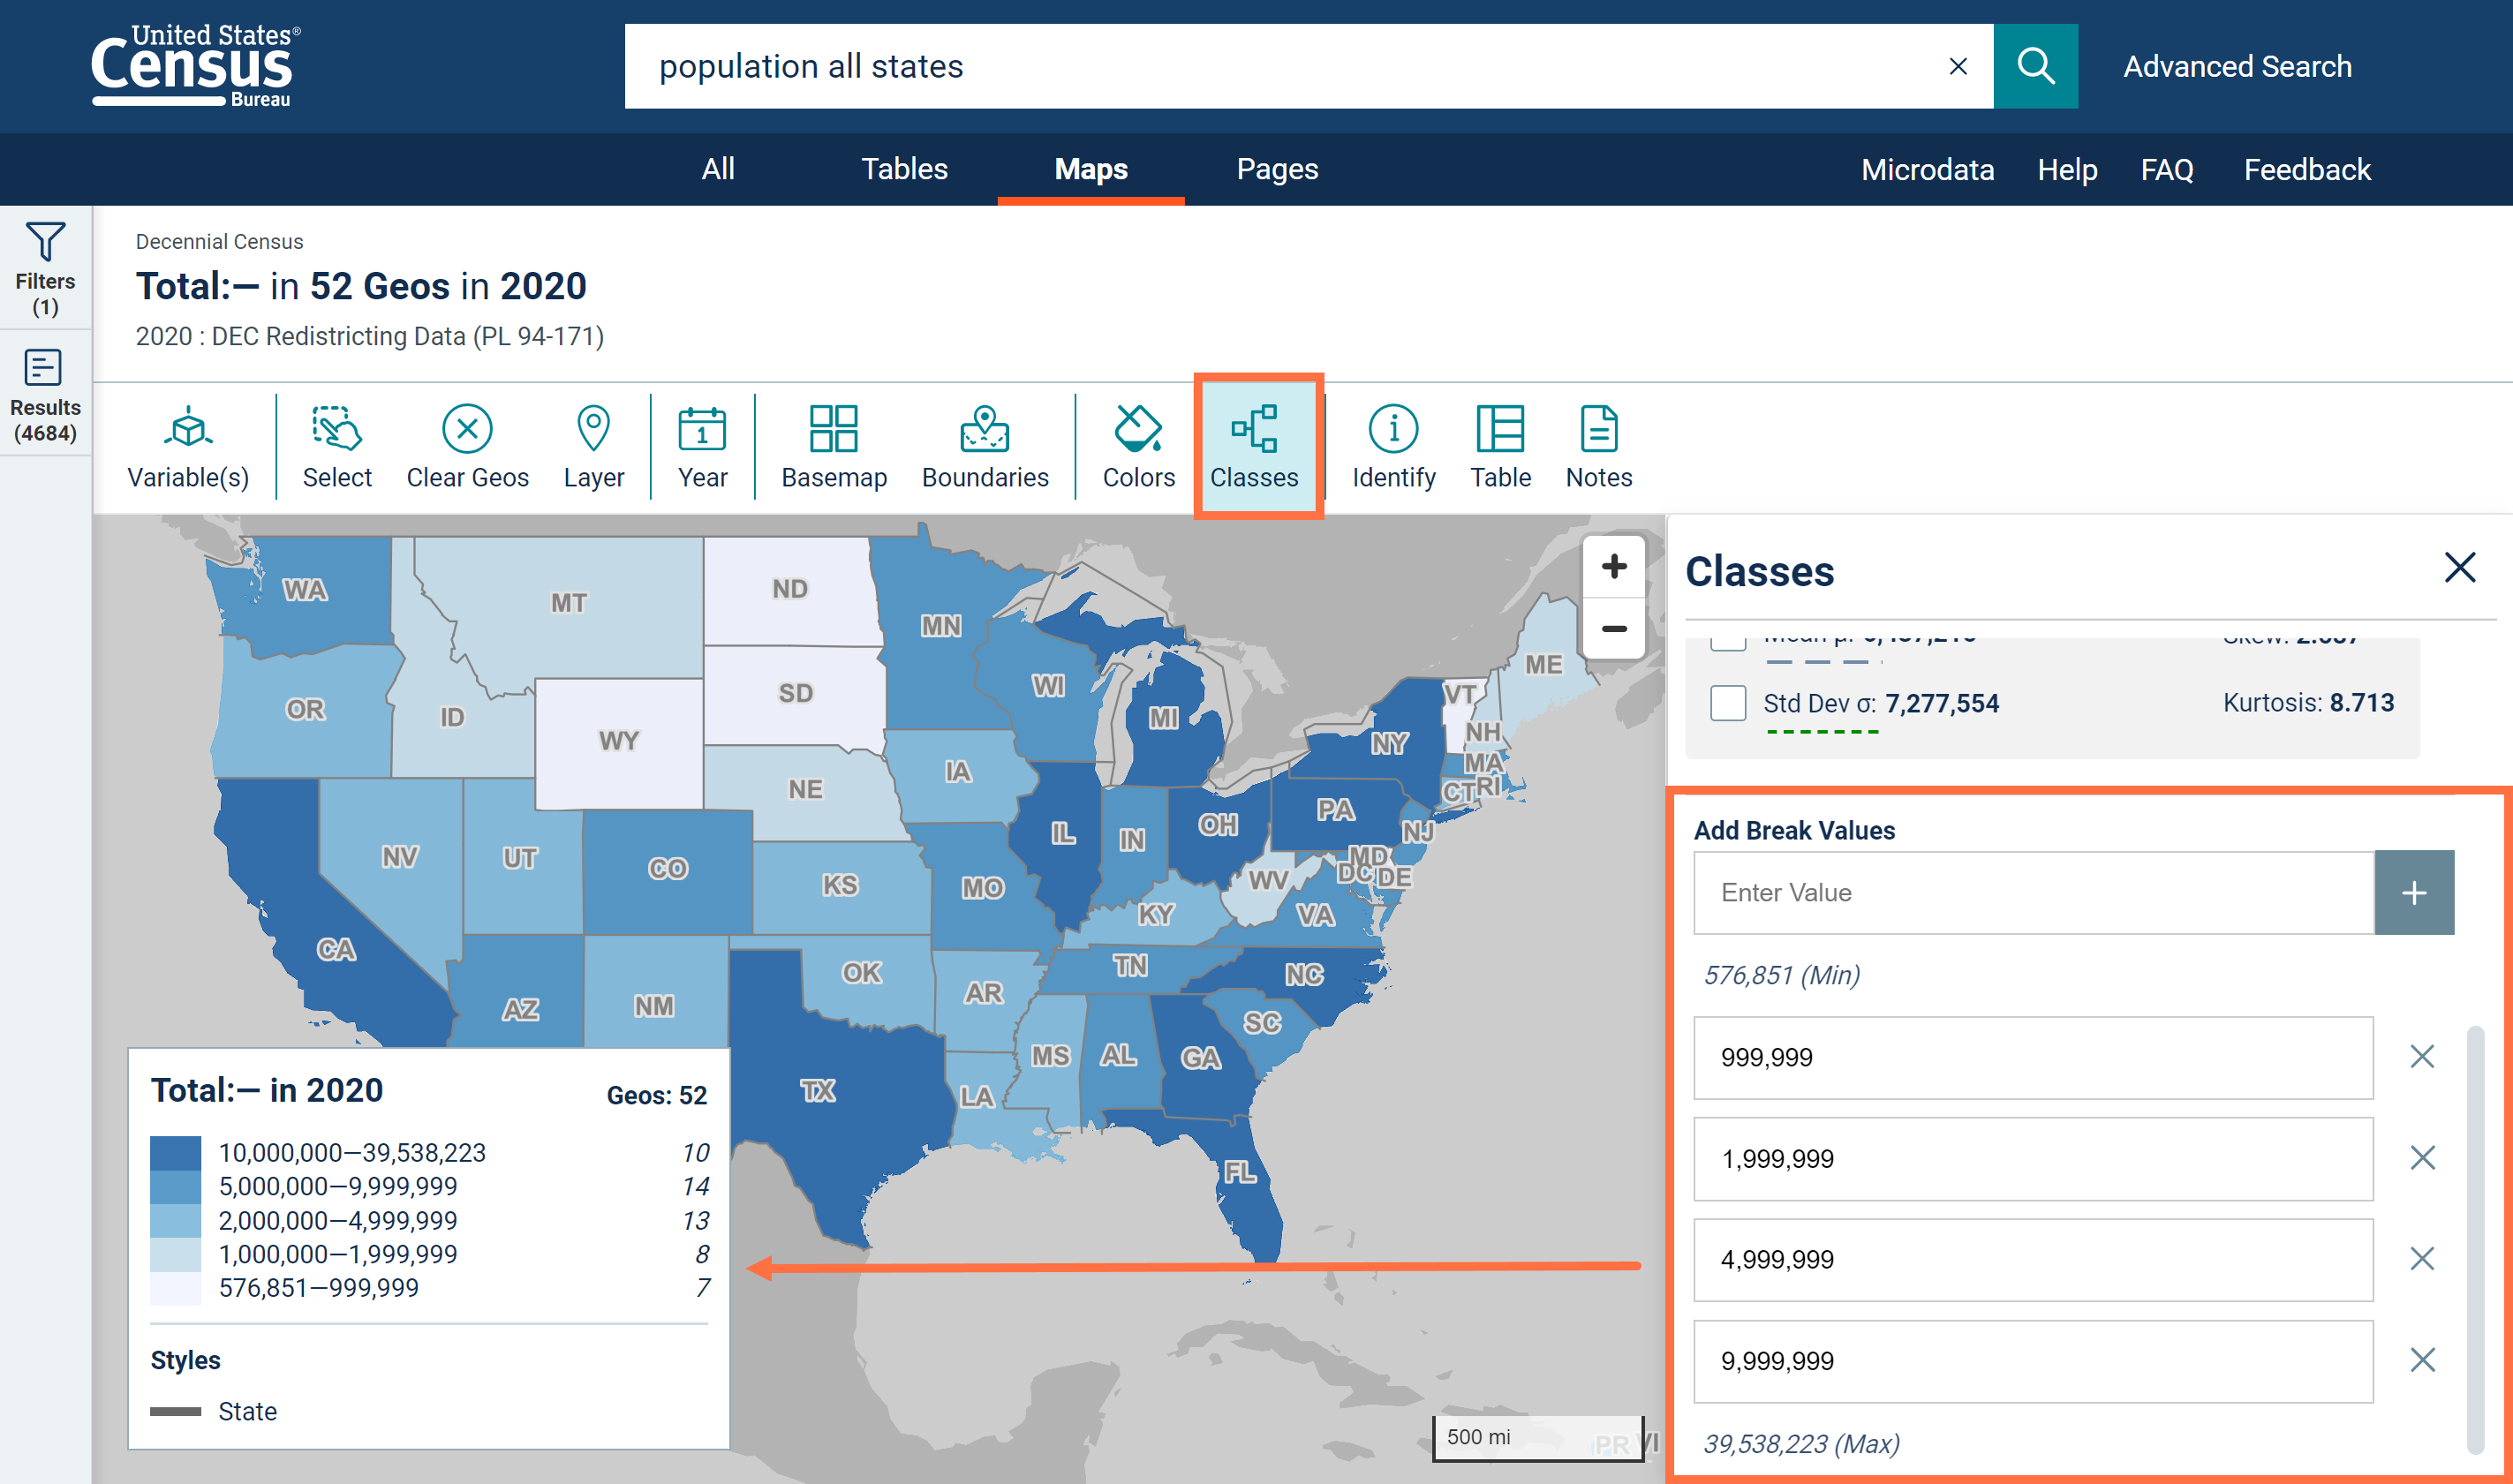
o Click the “Classes” button and drag the interactive histogram.
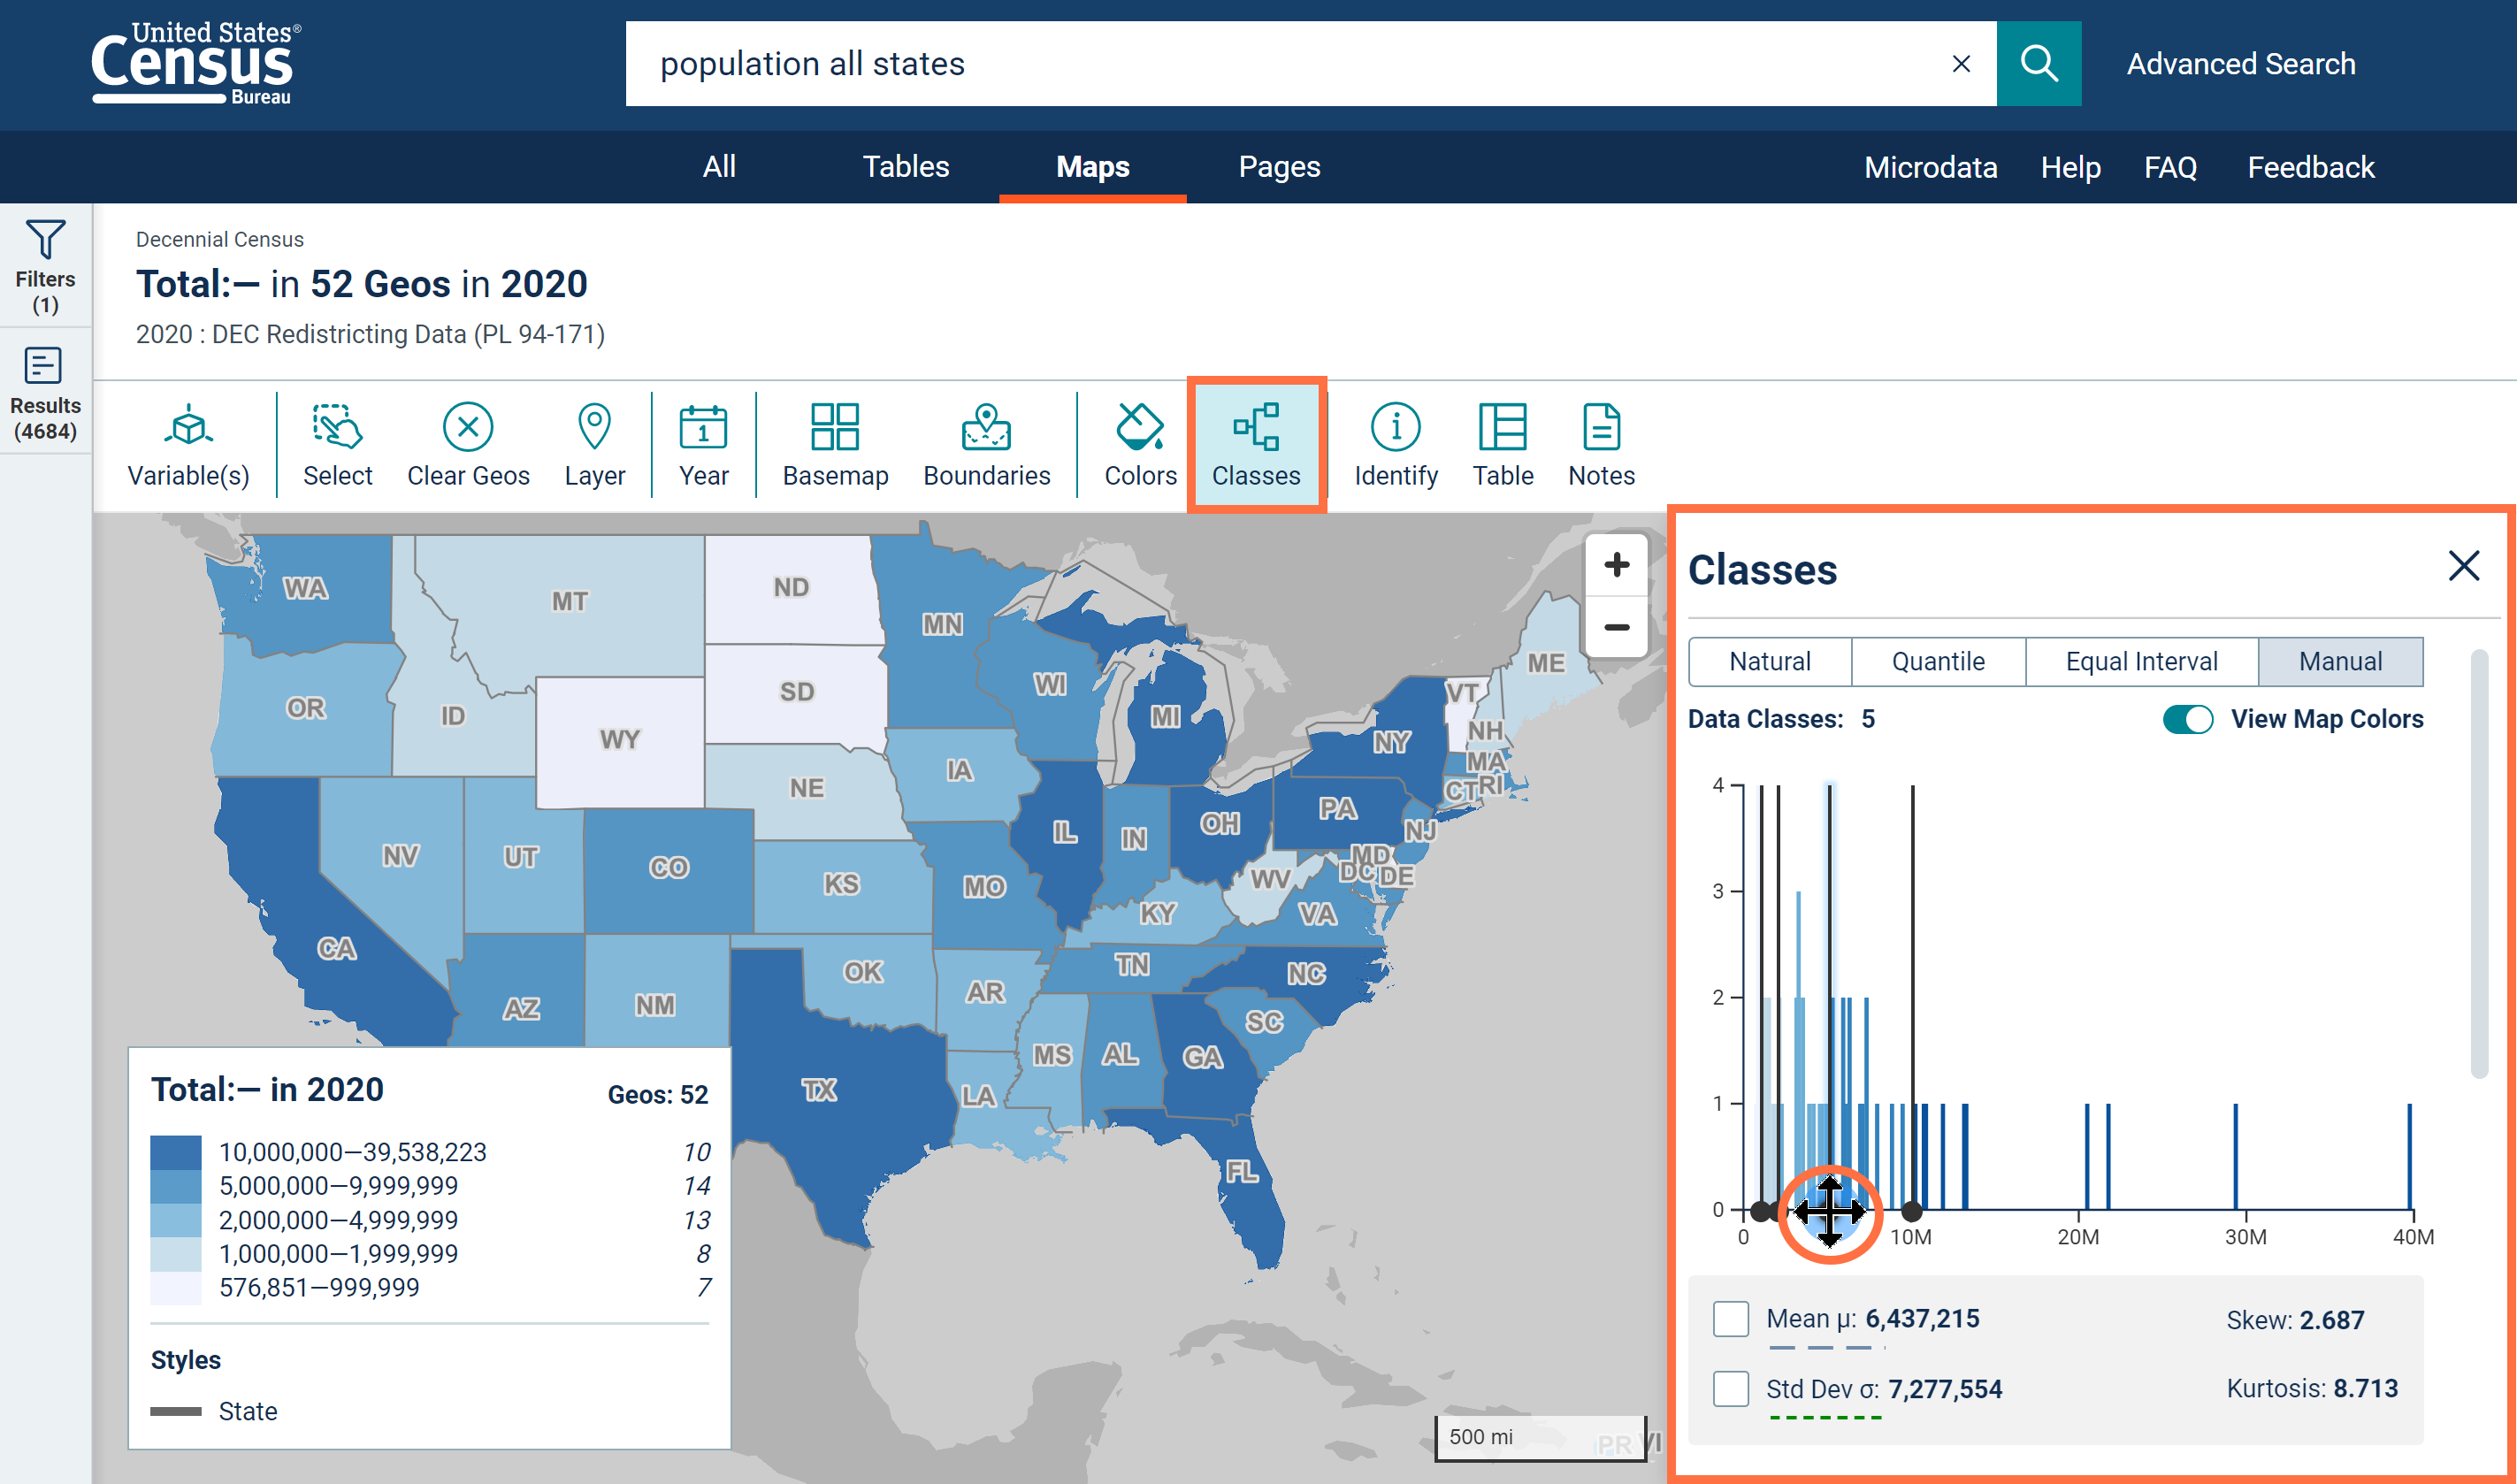
This new histogram shows the range and frequency of data values for the geographies on your map. It also includes the mean, standard deviation, skew, and kurtosis.
We also included details in the URL for manual breaks. This means that after you apply manual breaks you can share a URL for your map with these breaks included. This is provided through the breaks parameter. For example, the URL for the map in the screenshots above is: data.census.gov/cedsci/map?q=population%20all%20states&tid=DECENNIALPL2020.P1&cid=P1_001N&layer=VT_2020_040_00_PP_D1&breaks=Manual%28999999,1999999,4999999,9999999%29&mode=thematic&loc=34.8022,-96.7695,z3.0000
- Side panel functionality for Boundaries, Classes, Table, and Notes buttons. When you click these buttons, you will now be able to interact with the functionality on a new side panel. This makes it easier to use the functionality and prevents it from covering up your map.
- Technical work to enable profile views for specific tables. The vision for this work is to provide more dynamic and visual ways to view data in upcoming 2020 Census data releases.
- Fixes to 15 defects, including fixes that allow you to:
- Find options to select collections of geographies (example: all metropolitan/ micropolitan statistical areas) at the top of the filter panel in all views
- View labels for all geographies in transposed tables
- Get complete links from Excel tables so you can return to the table view on the site
- View table results only for the table IDs you typed in the single search bar
- Map data for all available geographic areas when selecting more than one collection of geography (example: “All counties in Indiana” and “All counties in Ohio”)
- Download data for all zip codes in the U.S. from applicable Business Patterns data tables
On August 25, we released the following updates to the site:
- Technical updates to the search software
- Fixes to 7 defects to internal versions of the site that are used for testing and review purposes
On August 11, we released the following updates to the site:
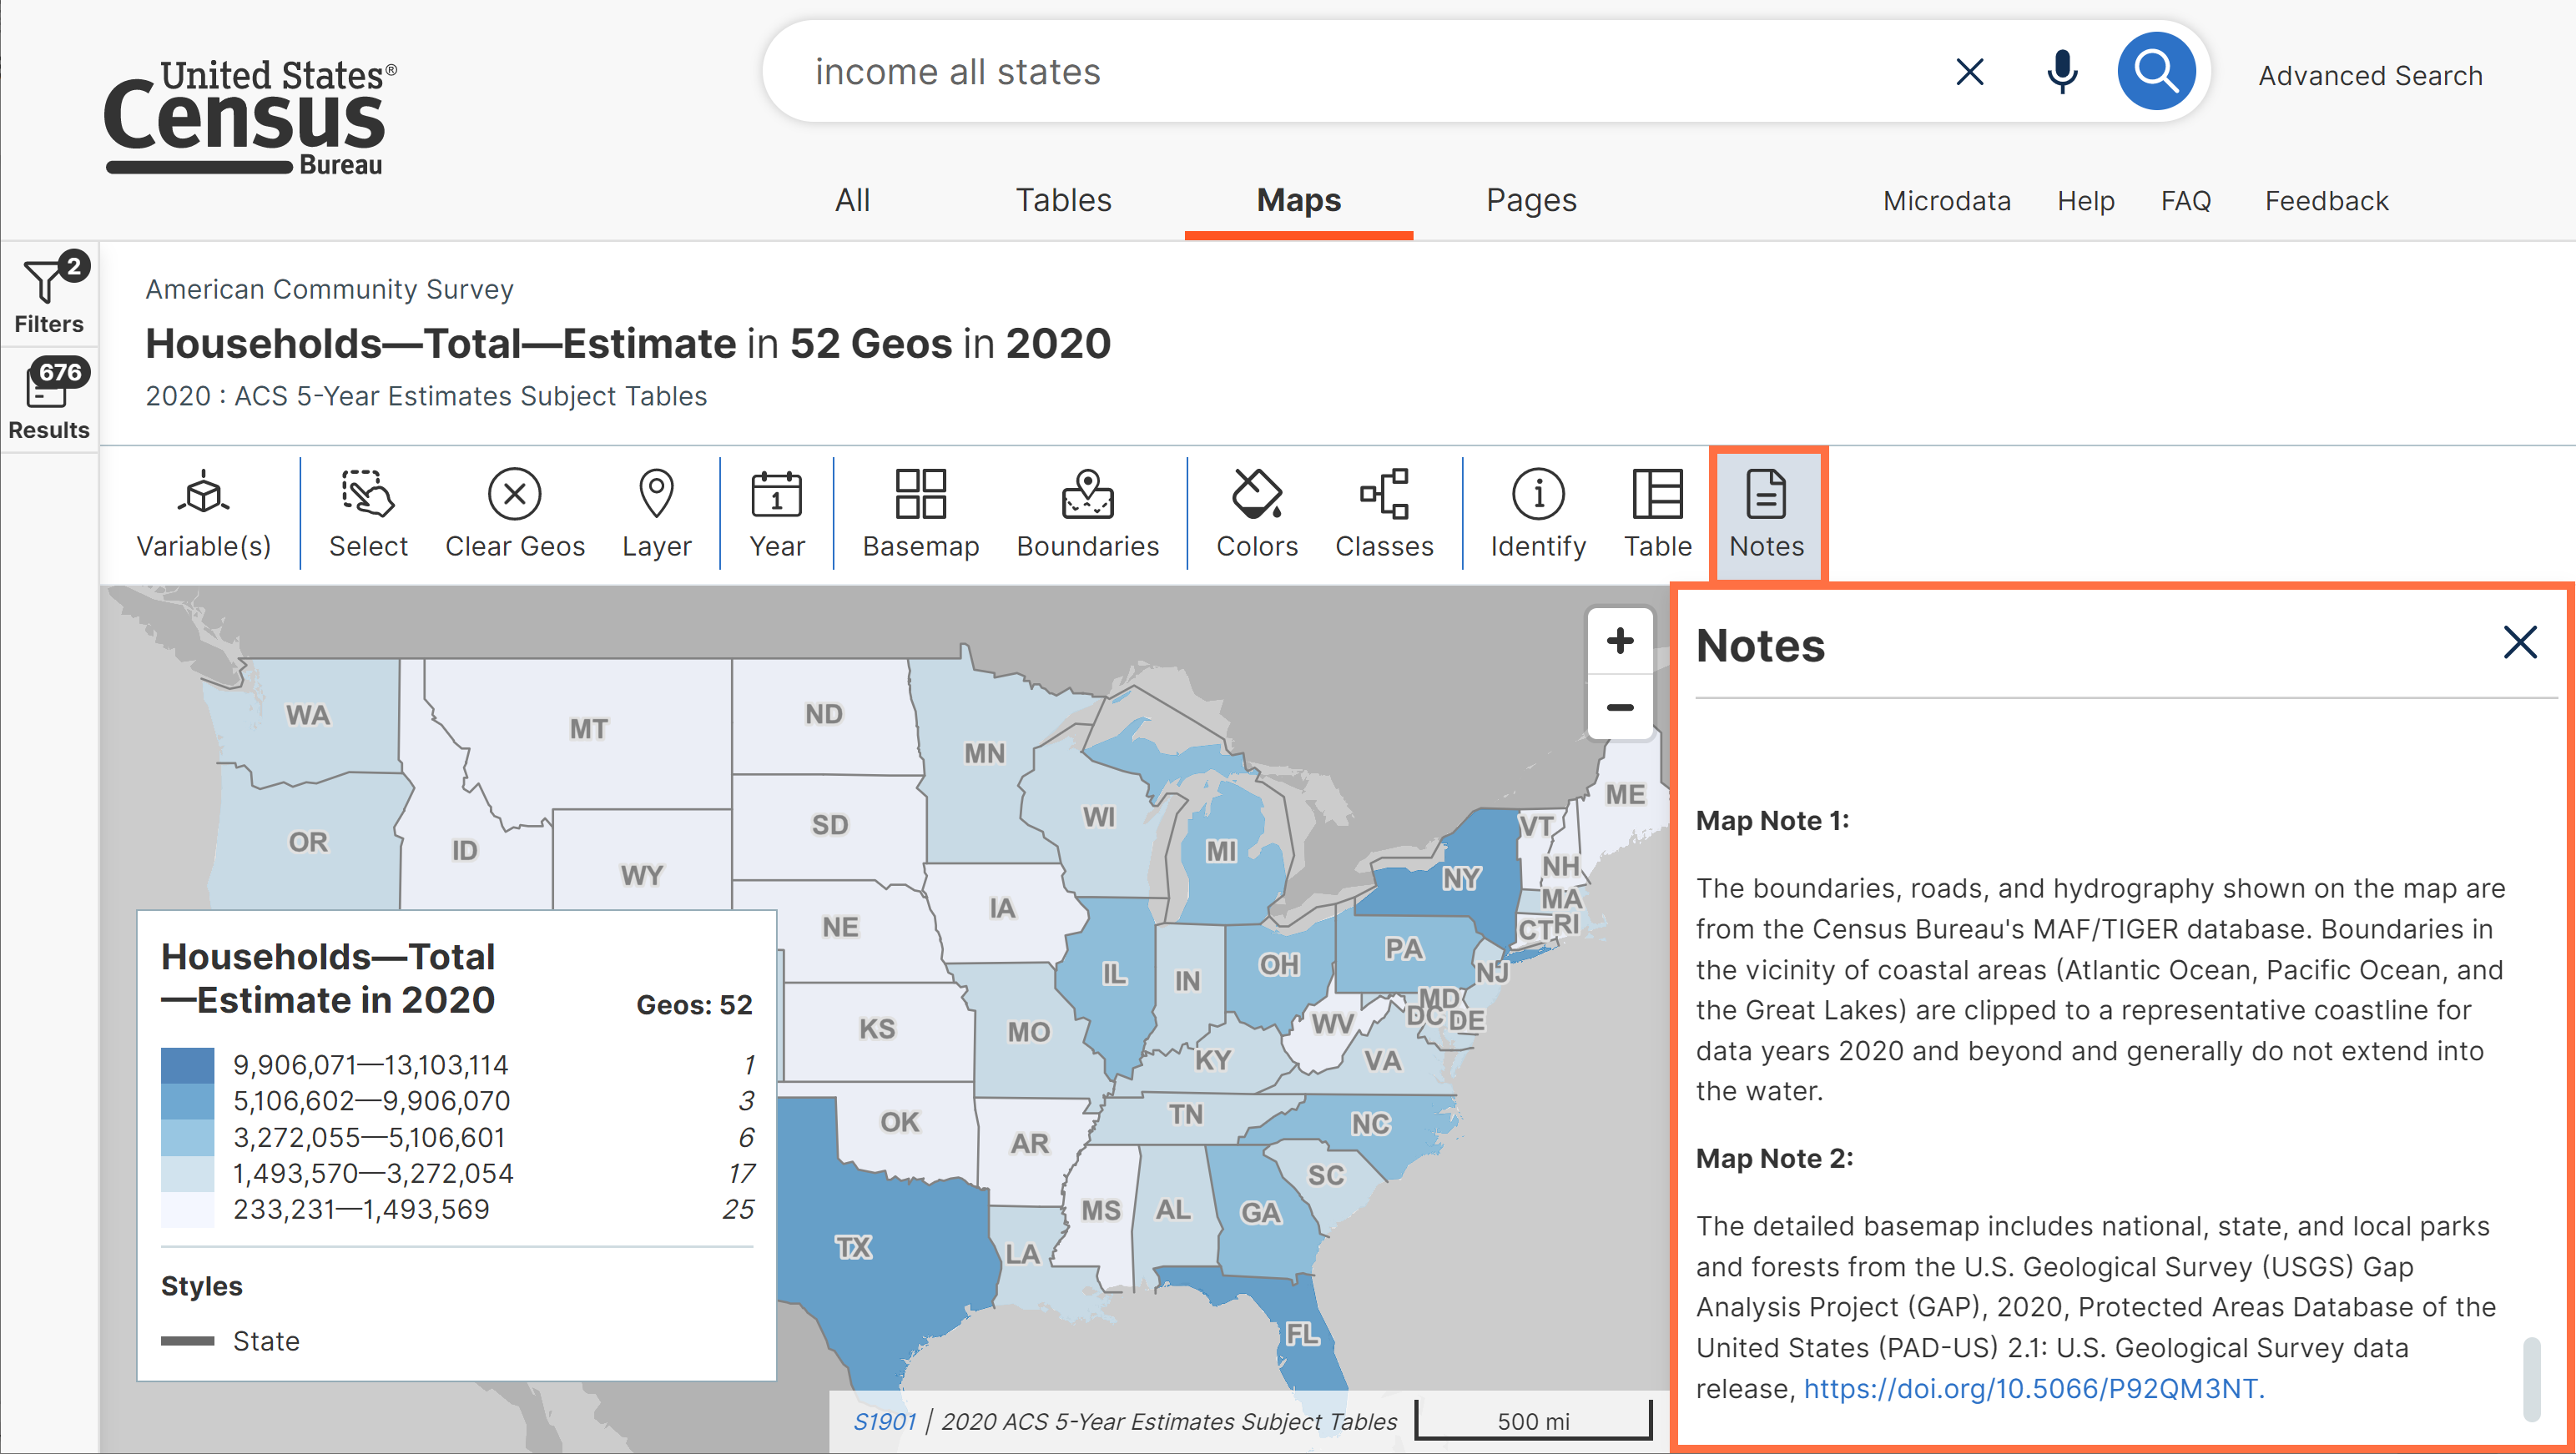
- New map notes. When you click the “Notes” button at the top of the map, you will now see notes relevant to the map, in addition to the rest of the table notes.
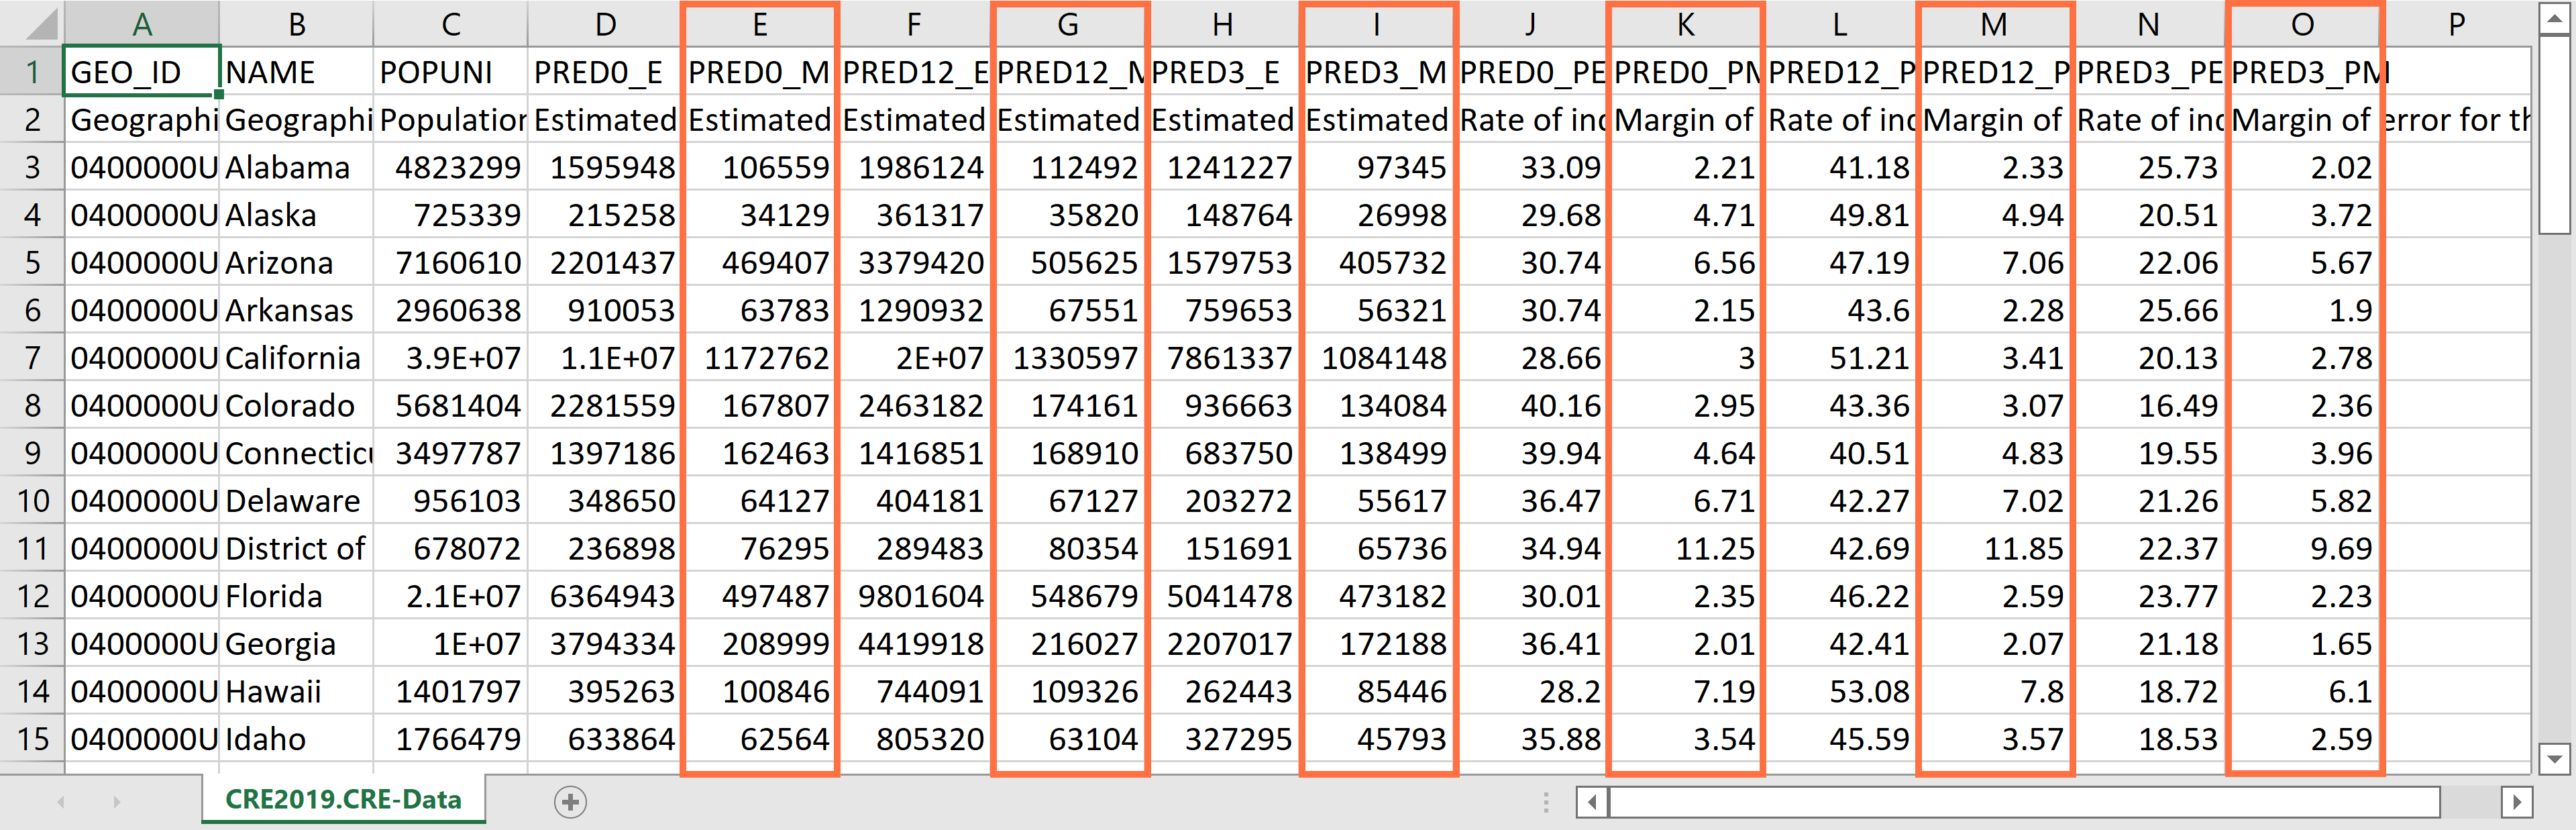
- Download improvements. You will now be able to see margins of error in tables you download from the Community Resilience Estimates (CRE).
- Technical updates to help us provide access to the Microdata Access Tool (MDAT) on an individual dataset level.
- Fixes to 9 defects, including fixes that allow you to:
- View table and dataset source statements in the lower right corner of your map
- Access data from data.census.gov URLs that contain old parameters
- View correct labels when editing the vintage of custom tables created in the Microdata Access Tool (MDAT)
- View variables in historical Current Population Survey (CPS) Annual Social and Economic Supplement (ASEC) datasets. This technical work supports future migration of these historical data to the Microdata Access Tool.
On September 8, we released the following updates to the site:
- Safari browser support. We applied updates to improve the site experience in Safari. You will no longer receive a message that the browser is not supported if you are using a current version of Safari. We consider “current version” to mean one of the three latest versions of the browser.
- Streamlined filters to select detailed population groups. With this update, we removed codes in the filter panel for detailed population groups to simplify each label.
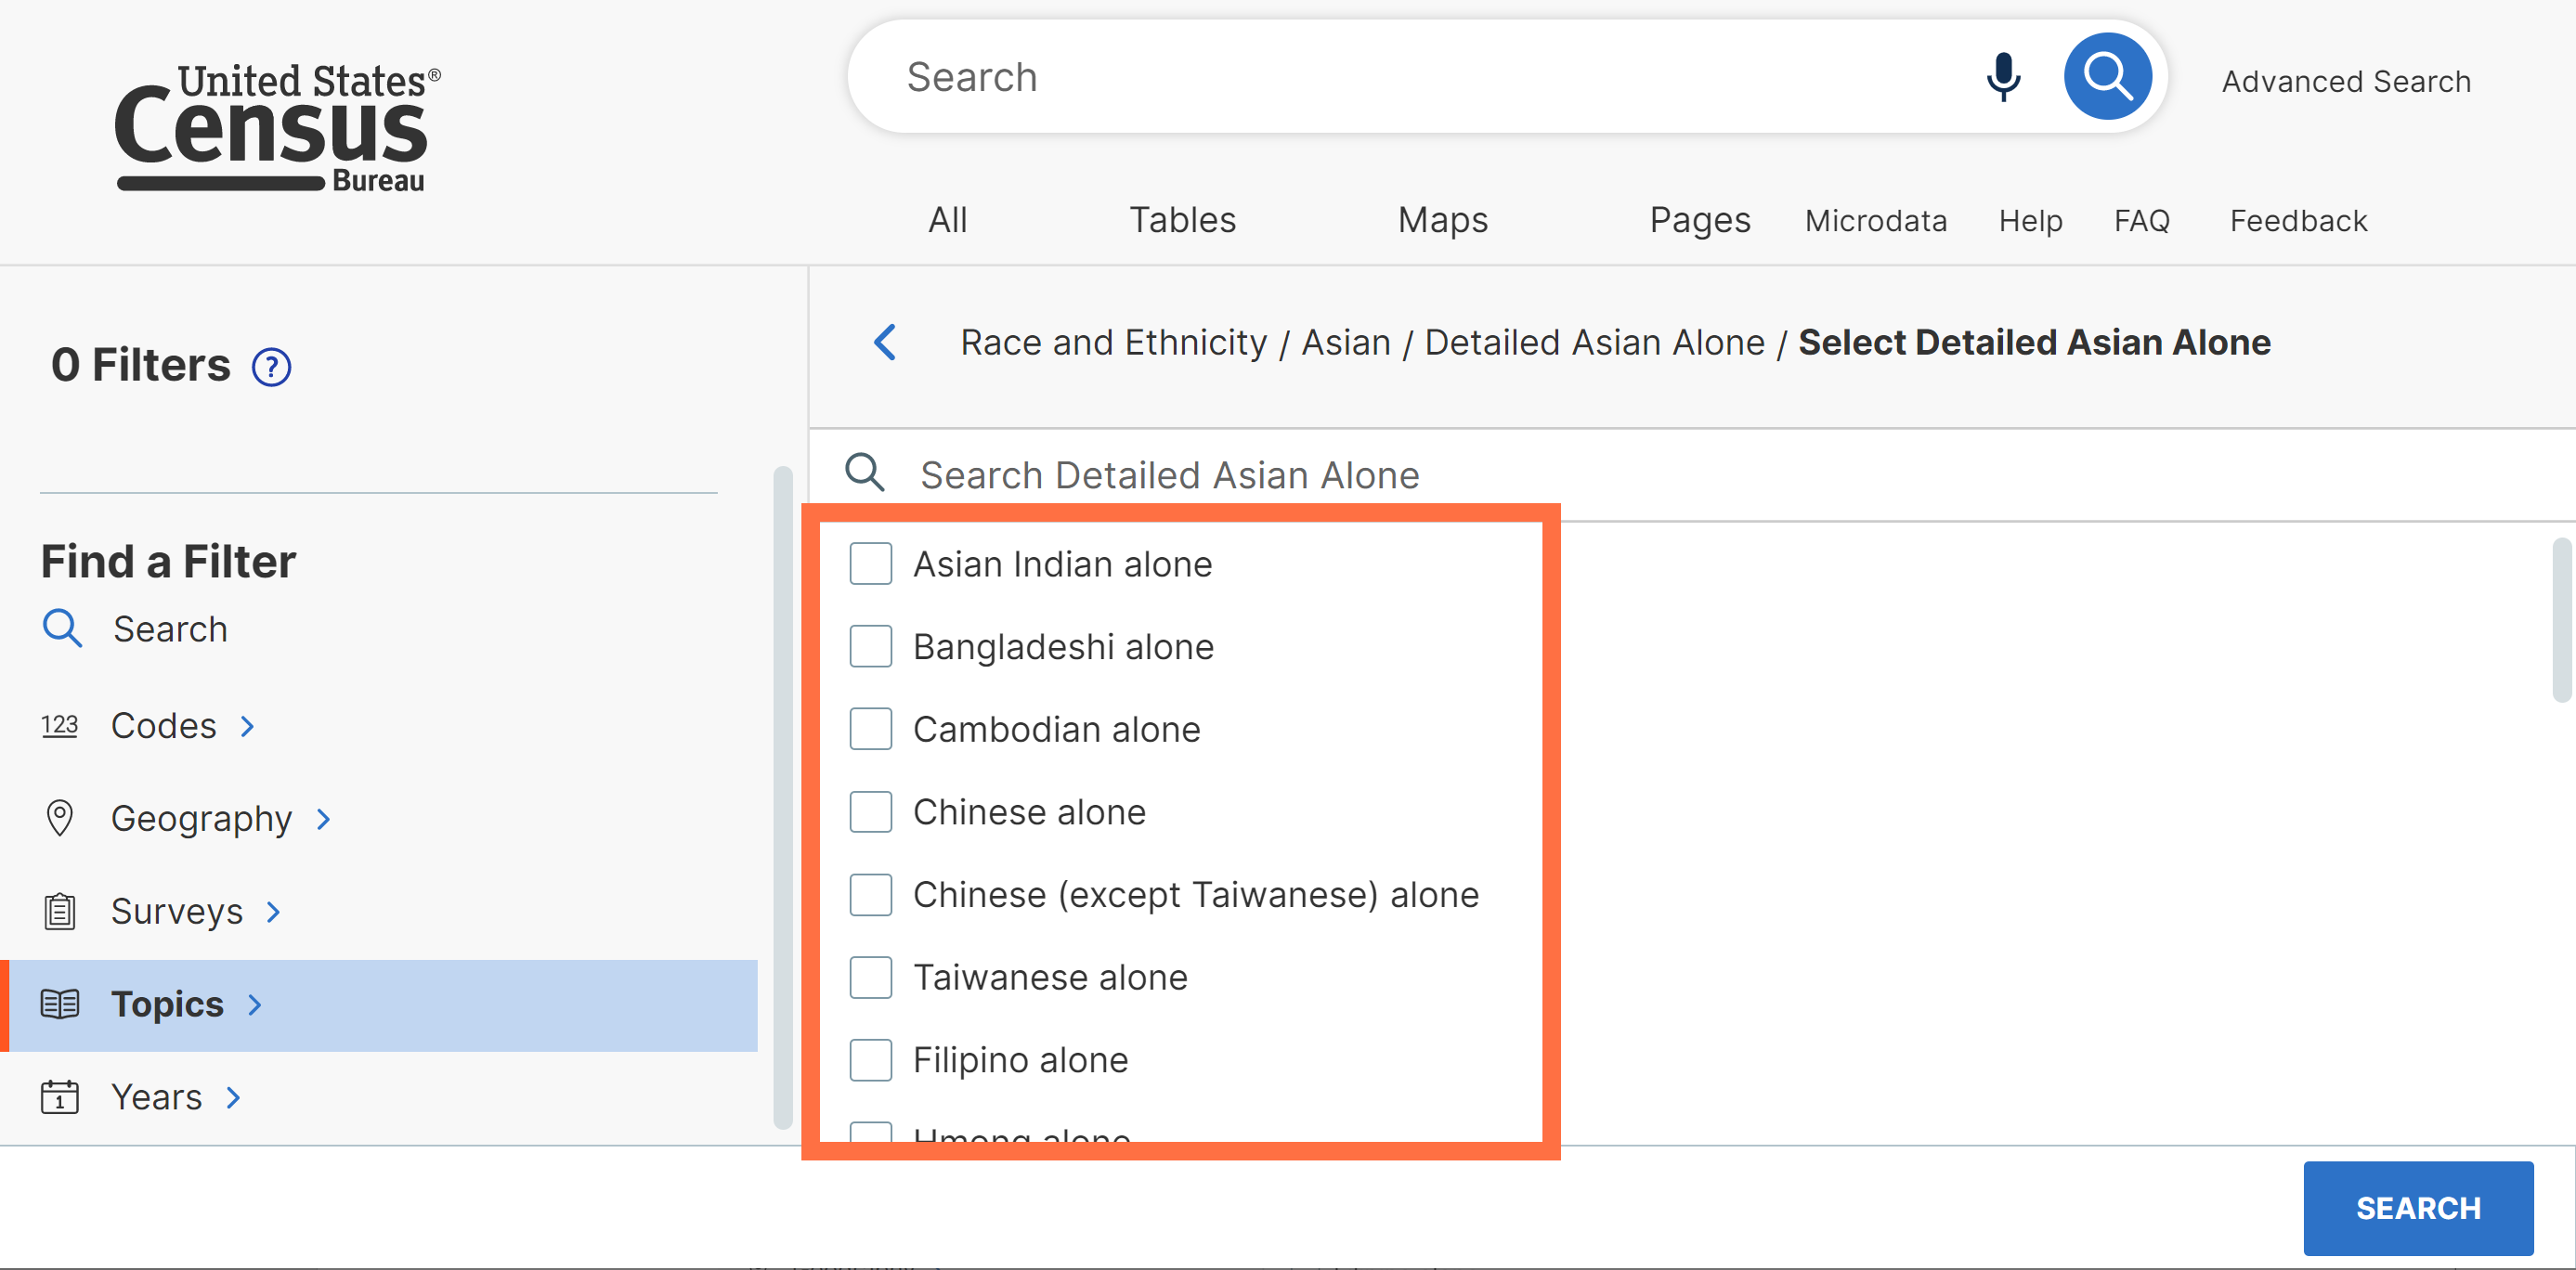
This applies to all filter options to select detailed race, ethnicity, ancestry, and country-of-birth groups individually or in bulk. We proactively applied this update in anticipation of upcoming data releases for detailed population groups that will make use of a new set of codes. Removing the code from the filter title avoids duplication in the filter panel when these new codes are released and will make it easier for users to choose the correct filter that applies to their data.
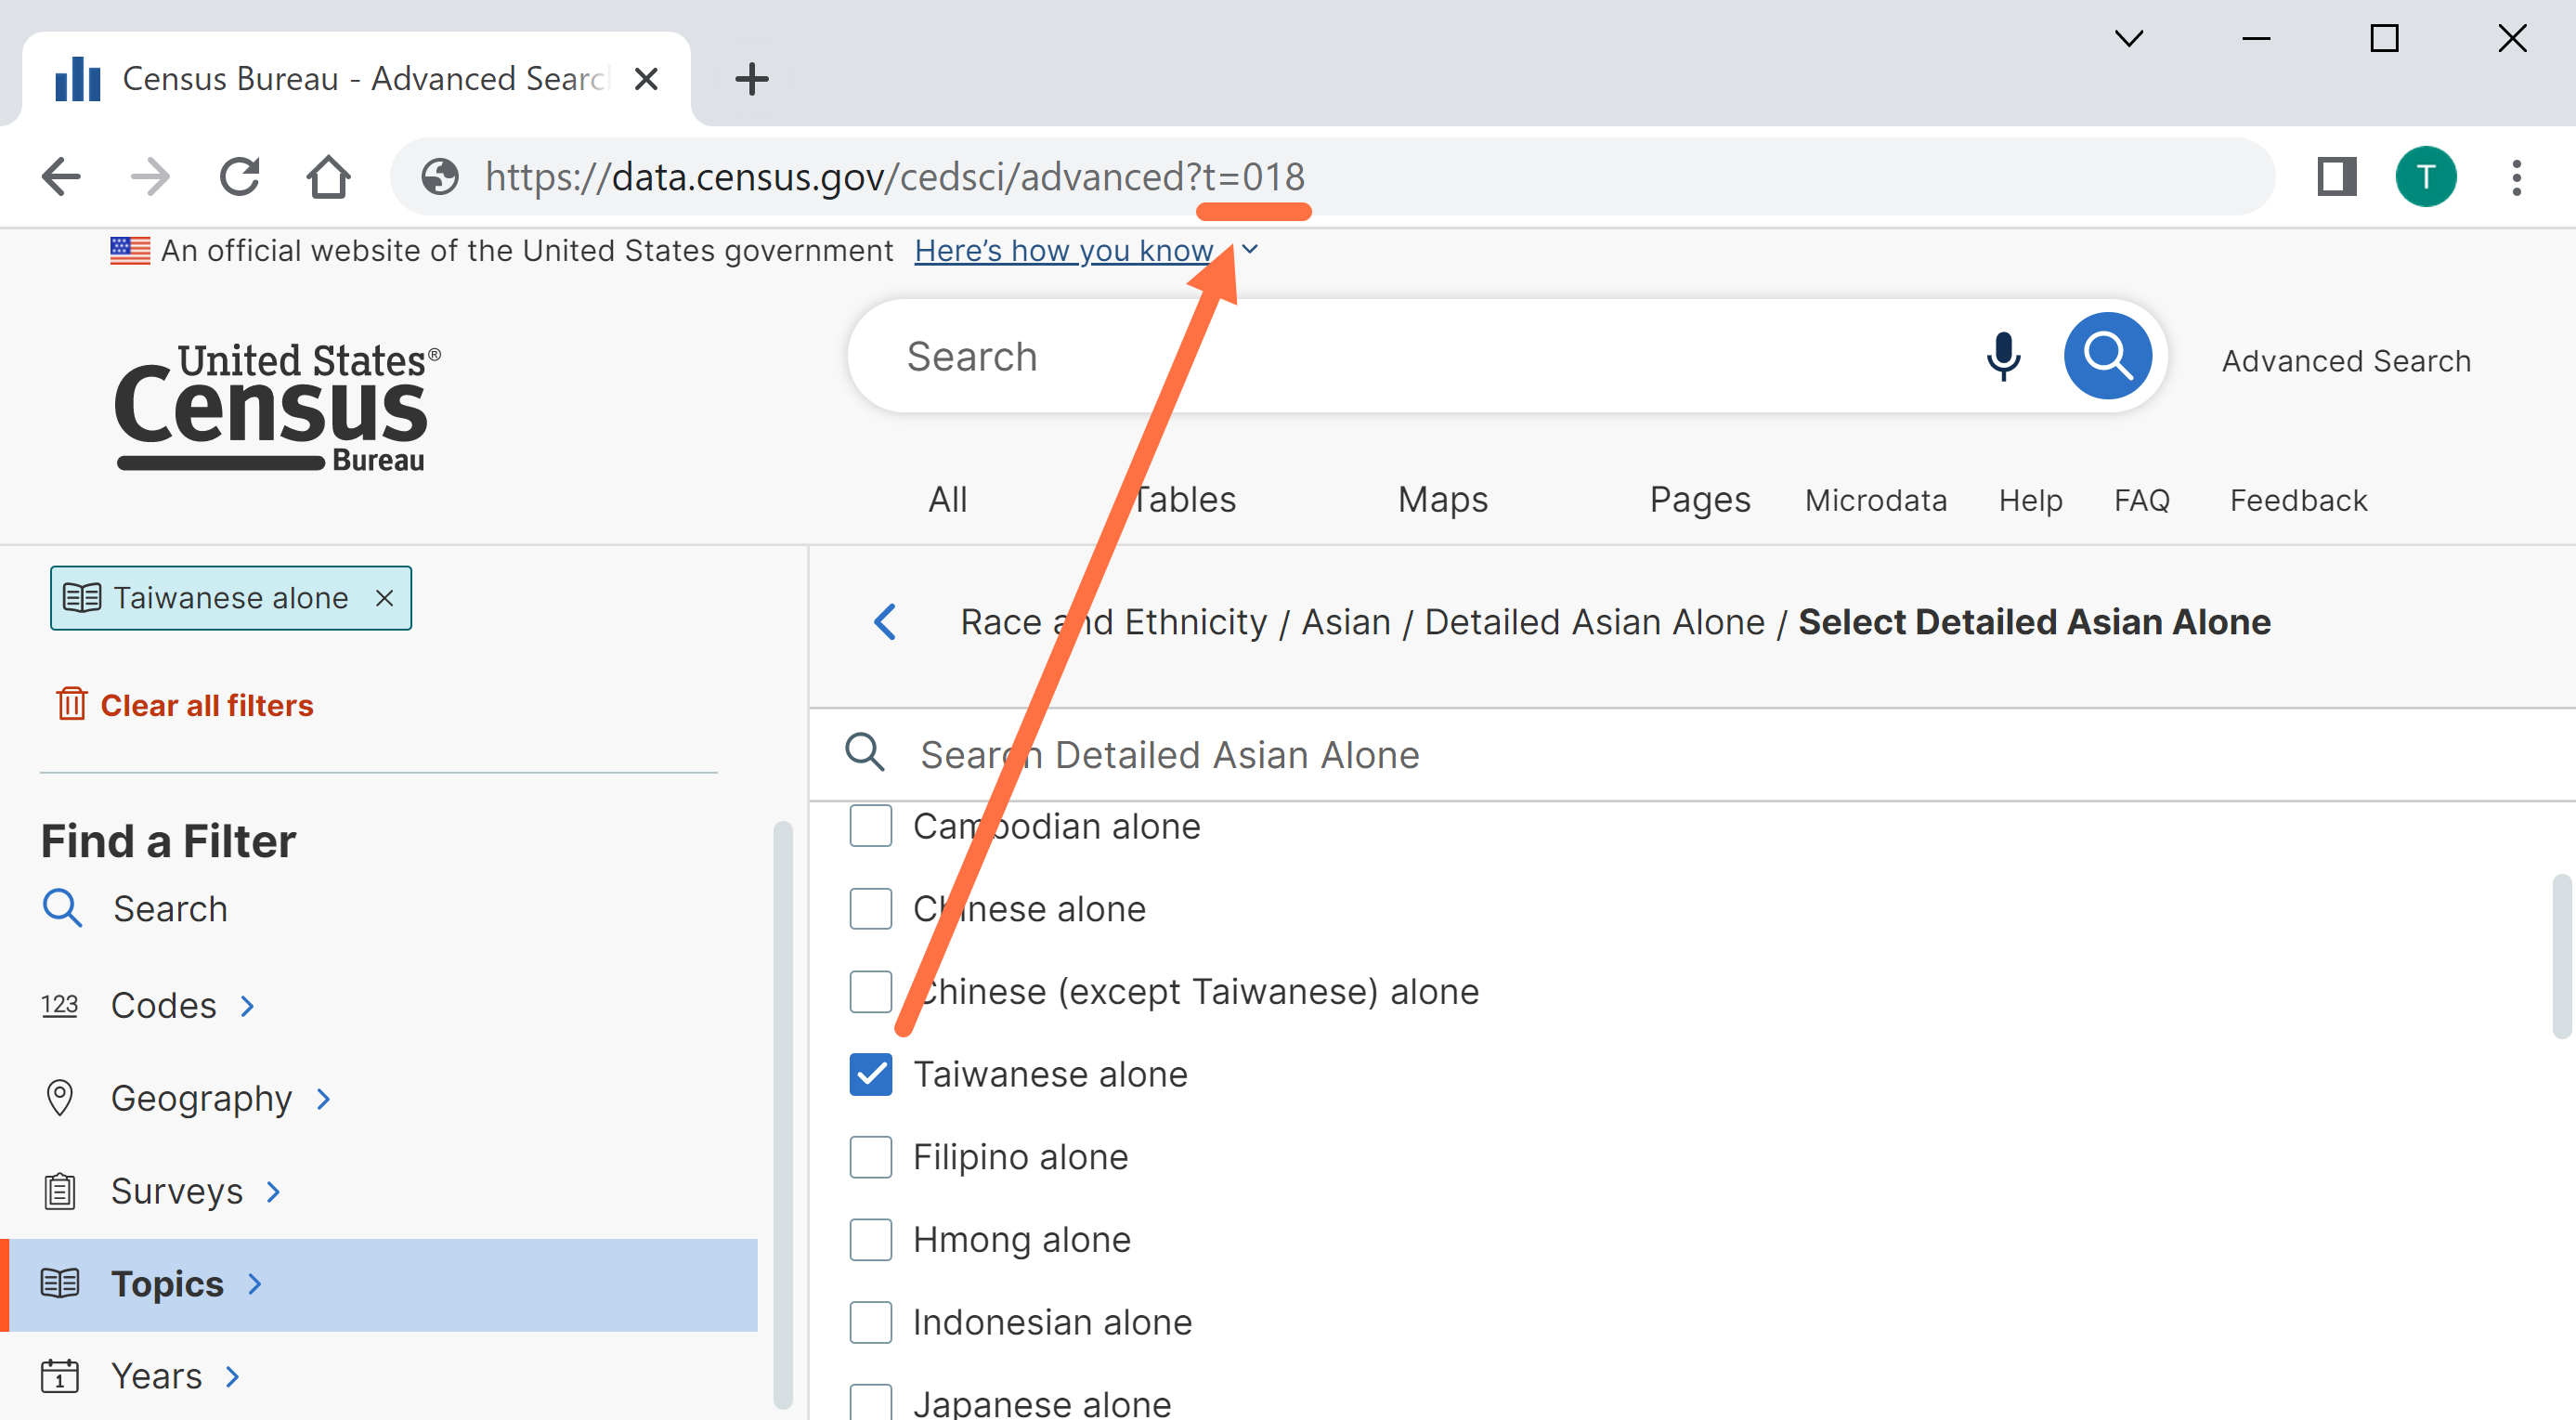
With this new feature, we also simplified the URL naming convention that captures filter selections for detailed population groups. Only the code will appear in the URL. We removed the population group name from the URL to keep it simpler.
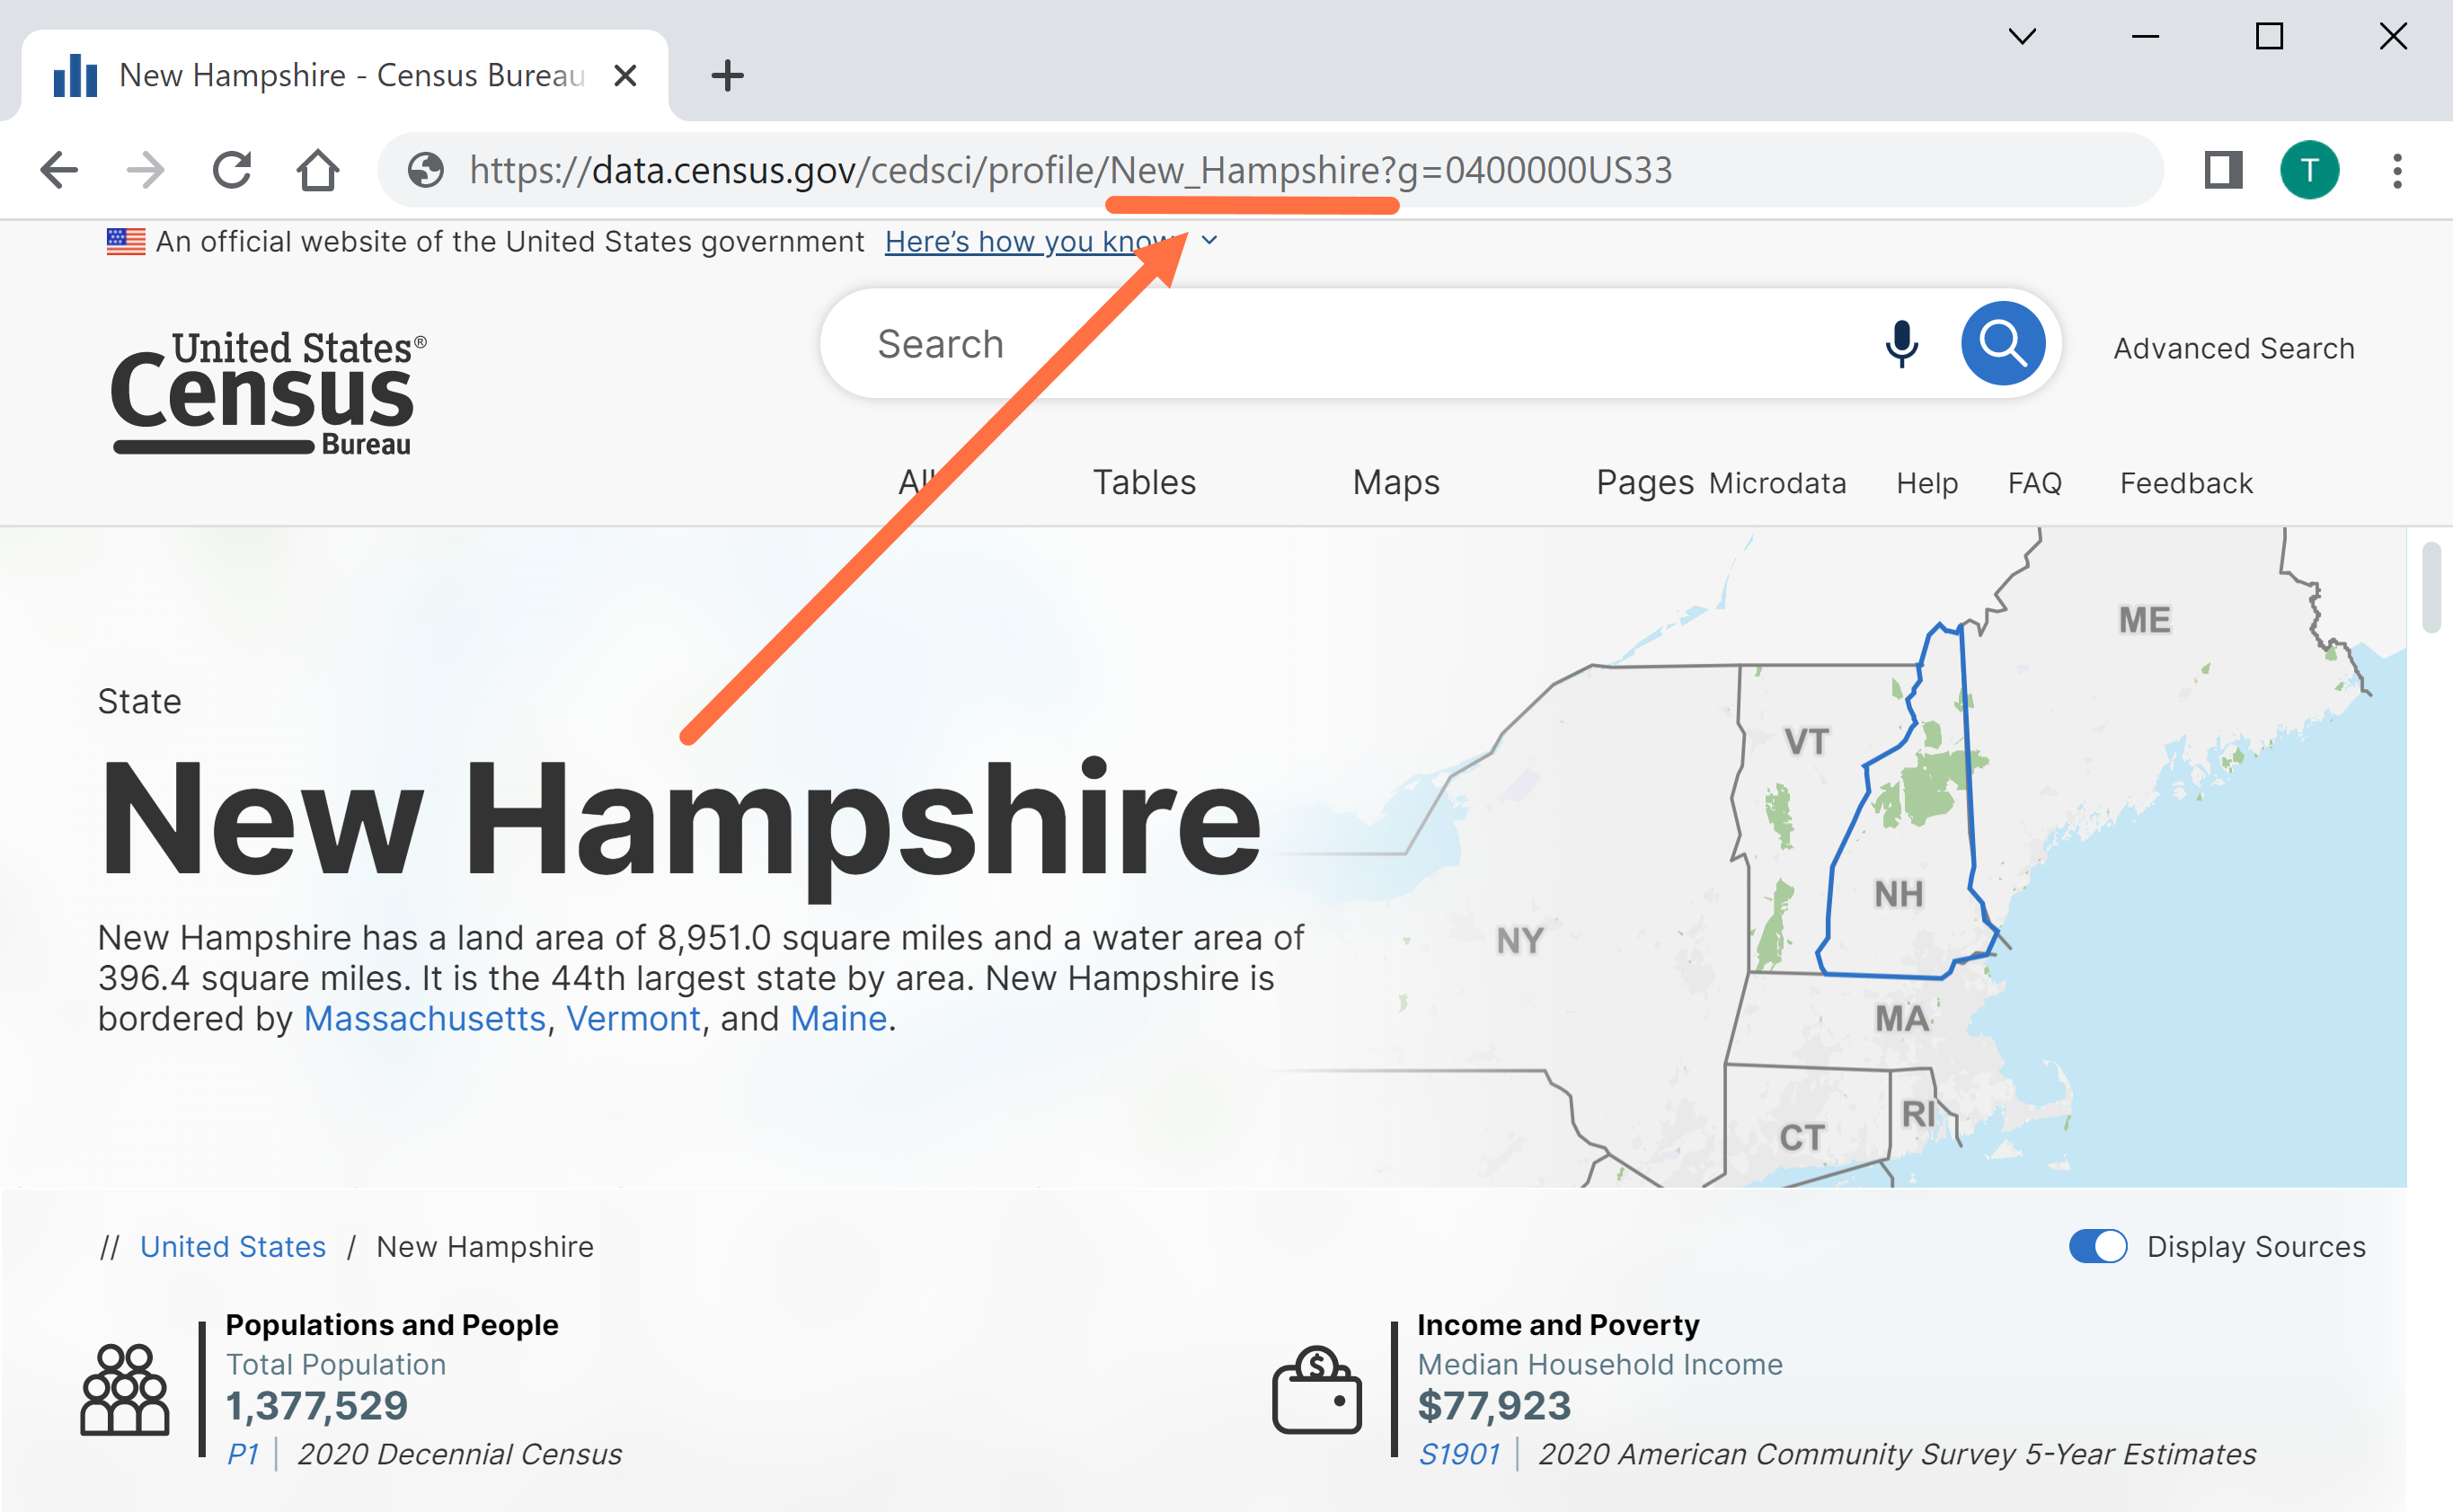
- Improved URLs for Geography and Industry Profile pages. With this update, you will now see the title of the Profile appear in the URL. This update makes the URLs more readable. It also helps external search engines better understand and link to the content on our site.
- Behind the scenes updates to the typeahead search suggestions
- Fixes to 22 defects, including fixes that allow you to:
- View featured table results and statistics for common search terms including: race, families, rent, value, and other housing phrases.
- View data after searching for American Indian and Alaska Native detailed population groups in the single search bar. We continue to recommend the advanced search for more precise search selections that allow you to view data for these population groups across all available years.
- Automatically navigate to the top of the list in each filter panel as you click through the panel
- View data correctly in economic tables without any duplicated data rows
- Download economic data tables for all ZIP codes in the U.S.
On October 13, we released the following updates to the site:
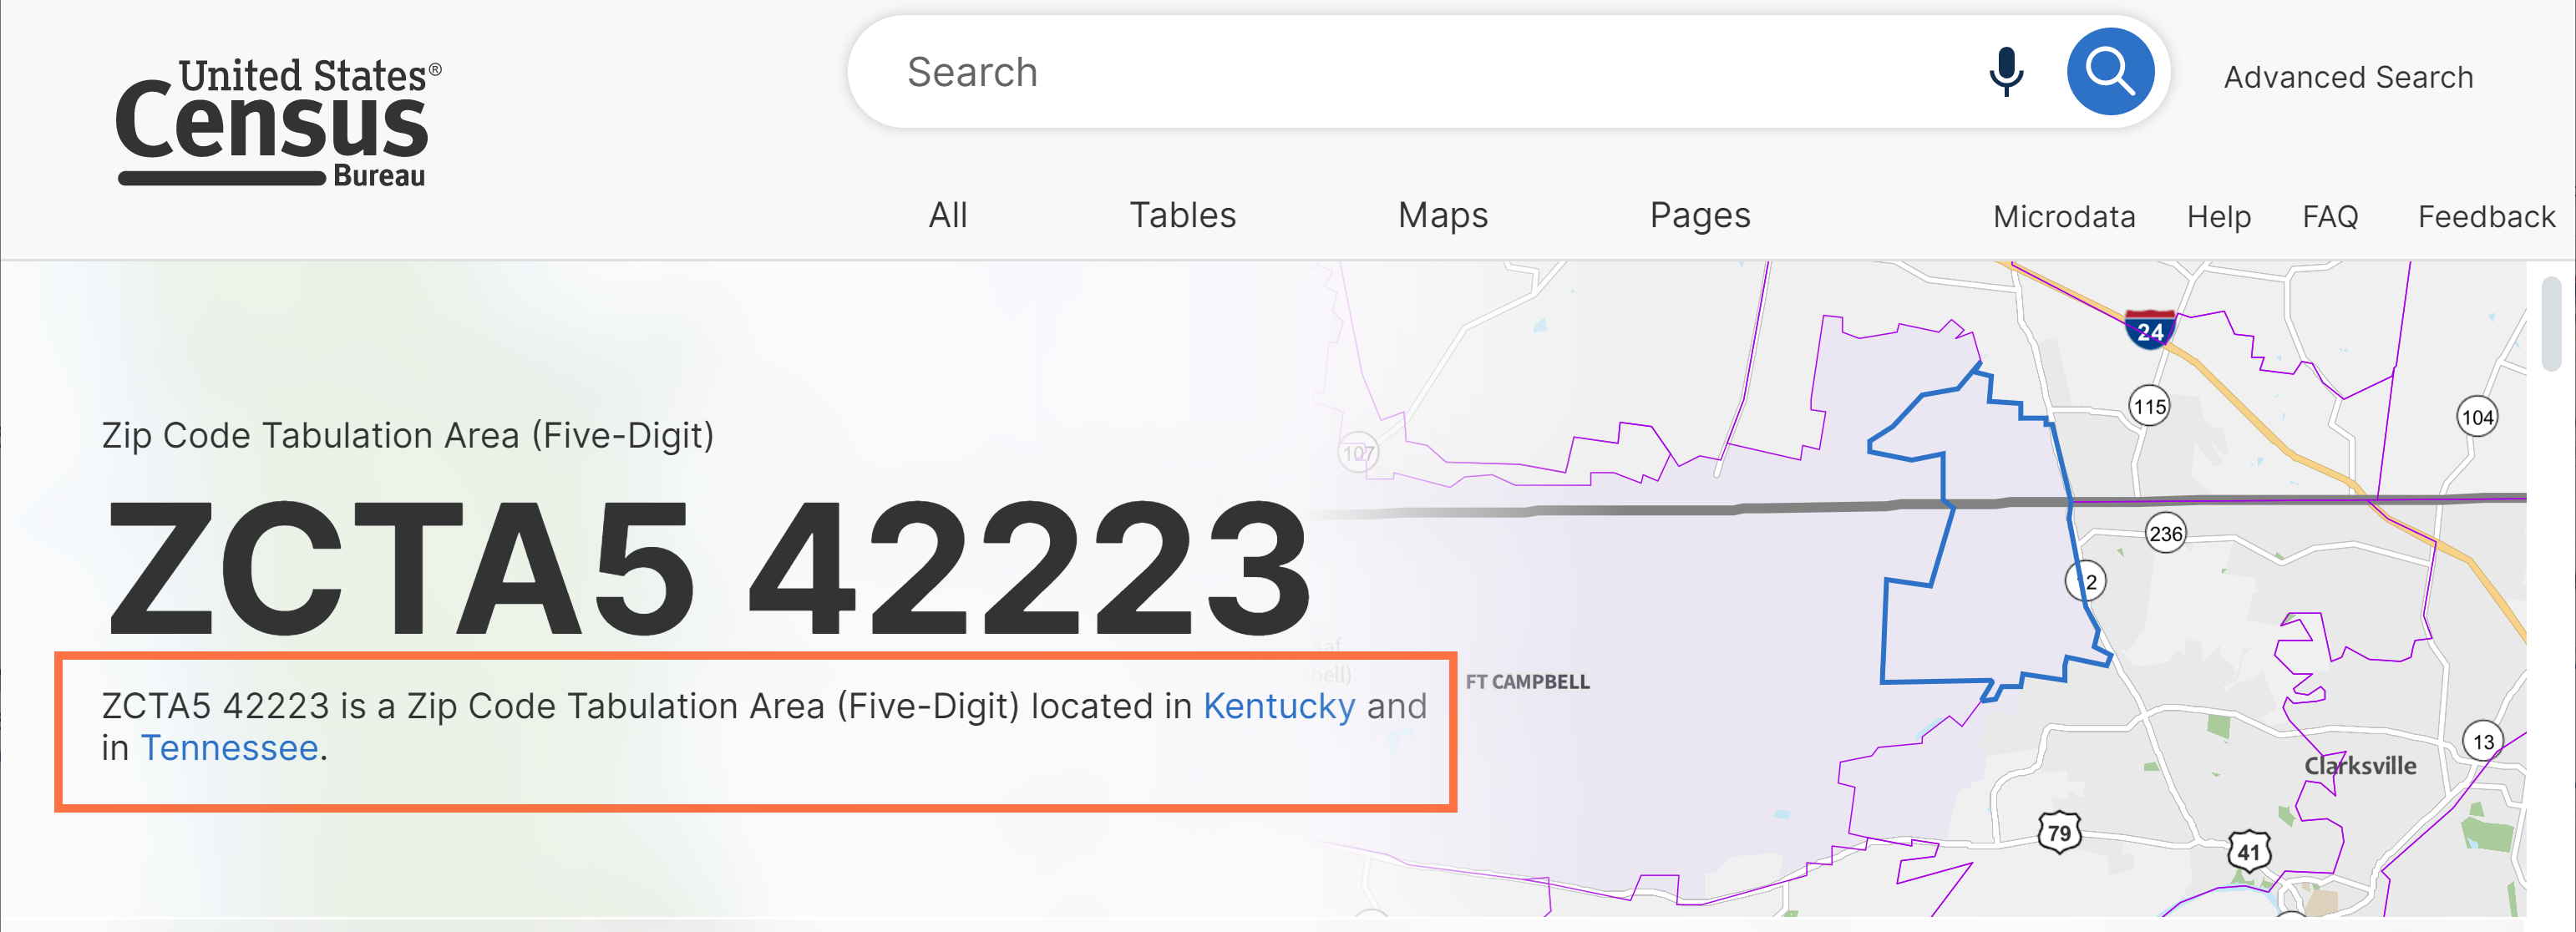
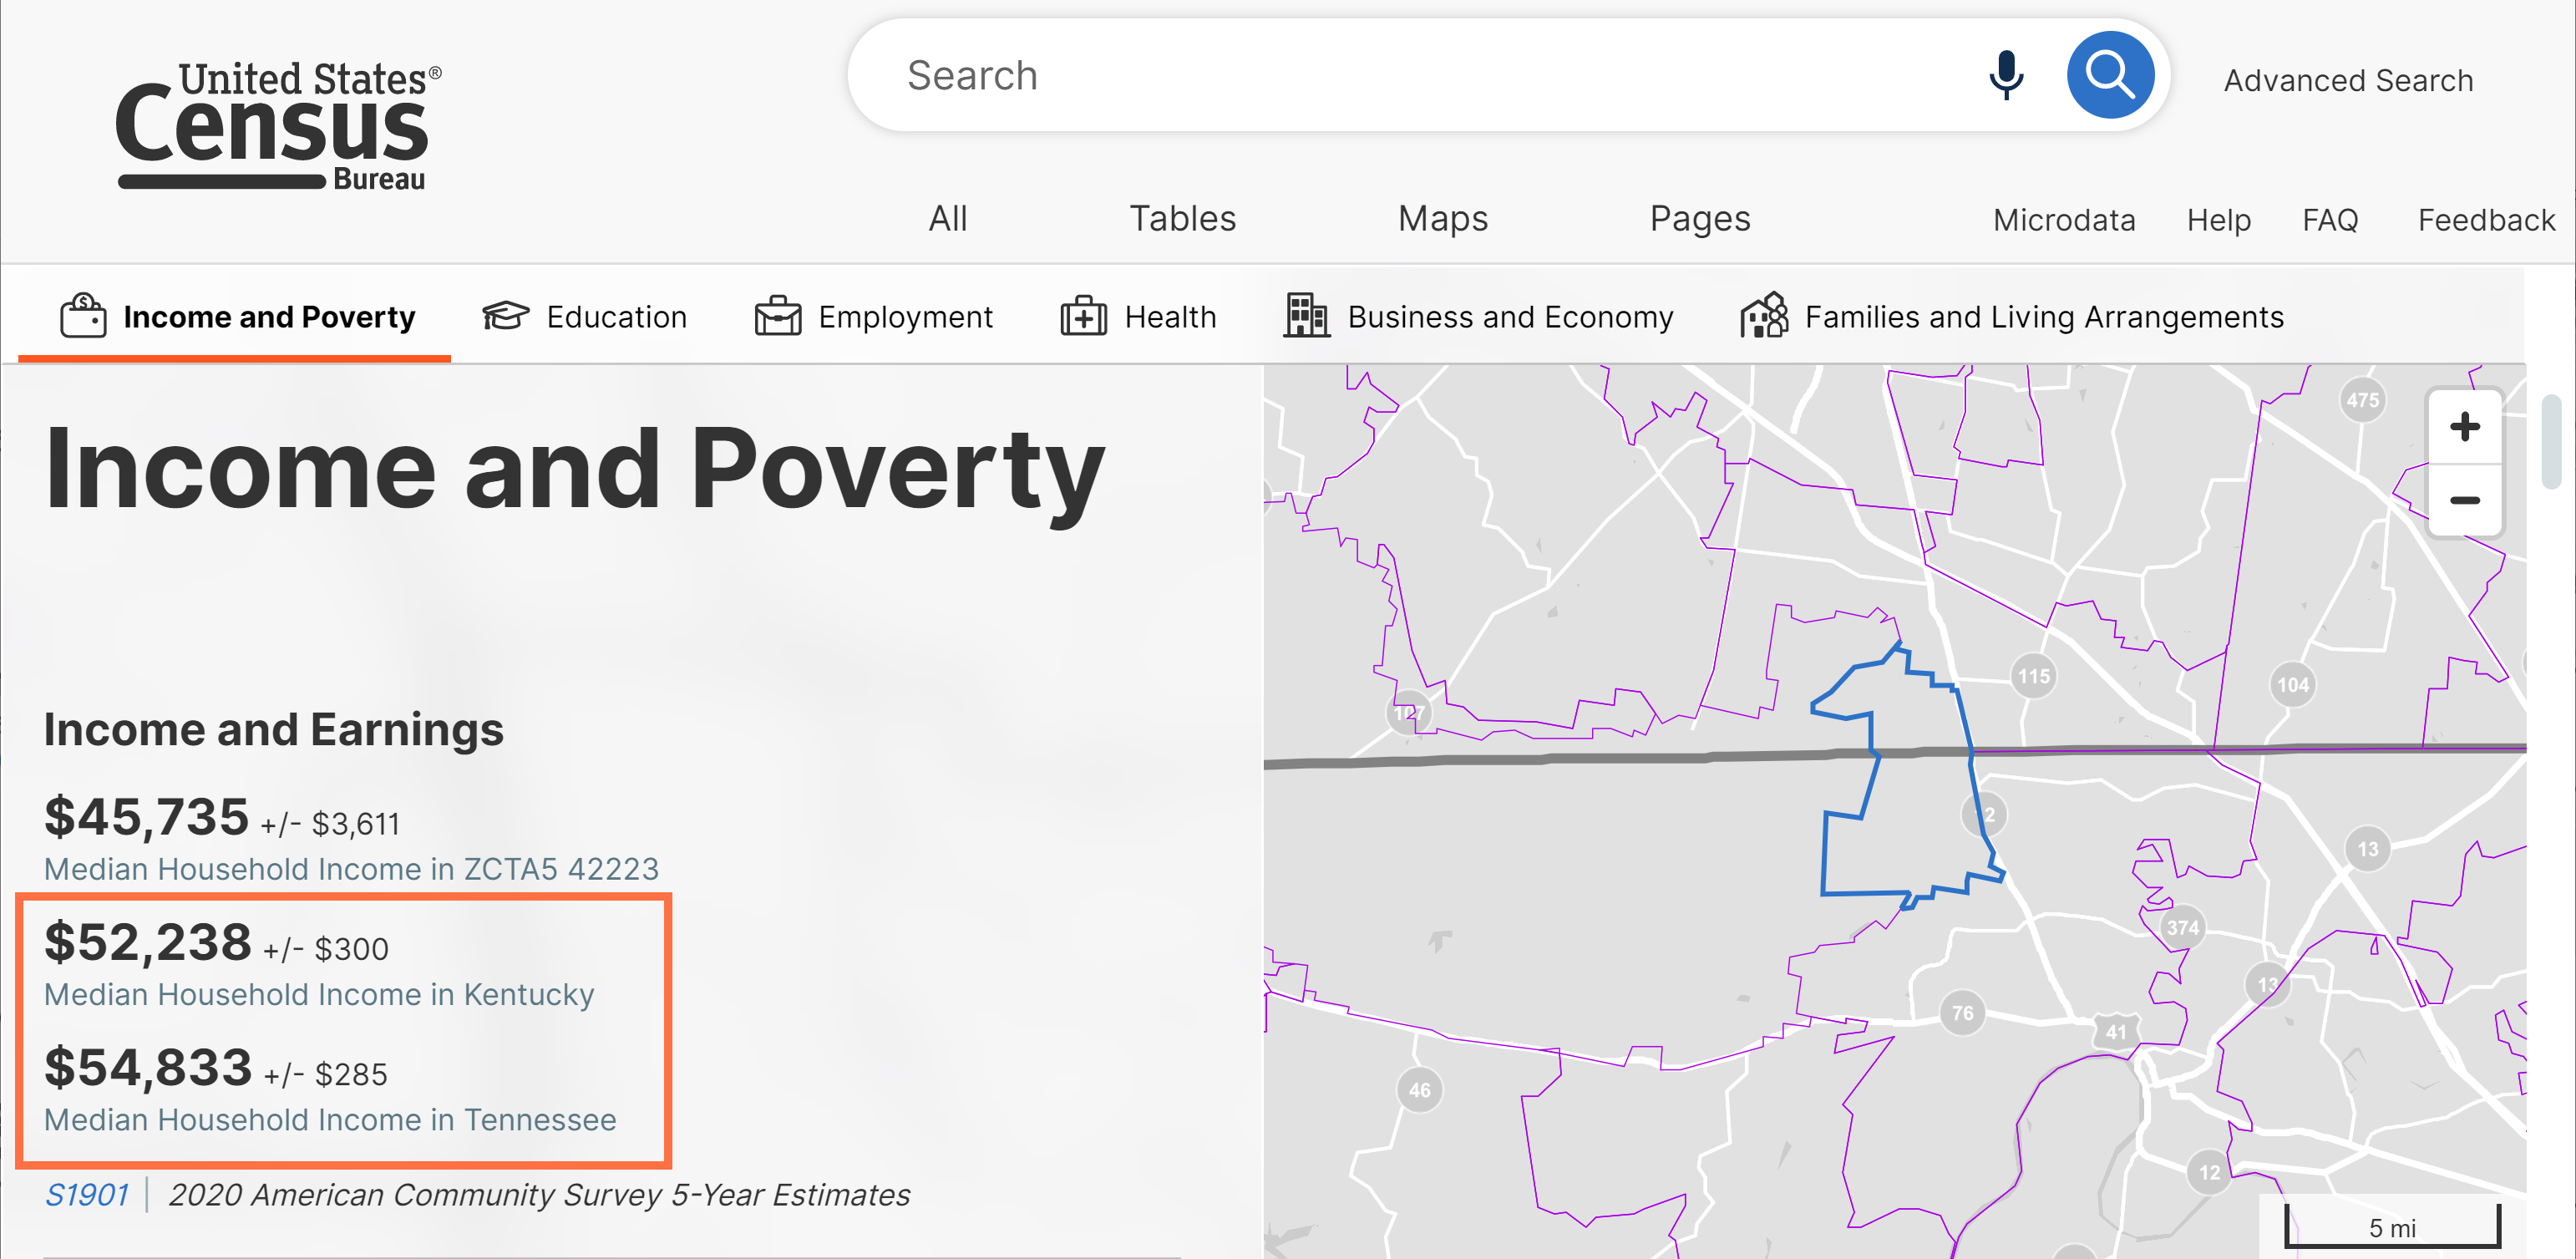
- New Geography Profile feature that shows comparisons across more than one geography. This improvement allows you to see these comparisons in instances where the primary geography crosses boundaries of the comparison geographic level.
For example, ZIP Code Tabulation Area (ZCTA) 42223 crosses state boundaries. Part of the area is in Kentucky and the other part is in Tennessee. You will now see this in the Profiles.
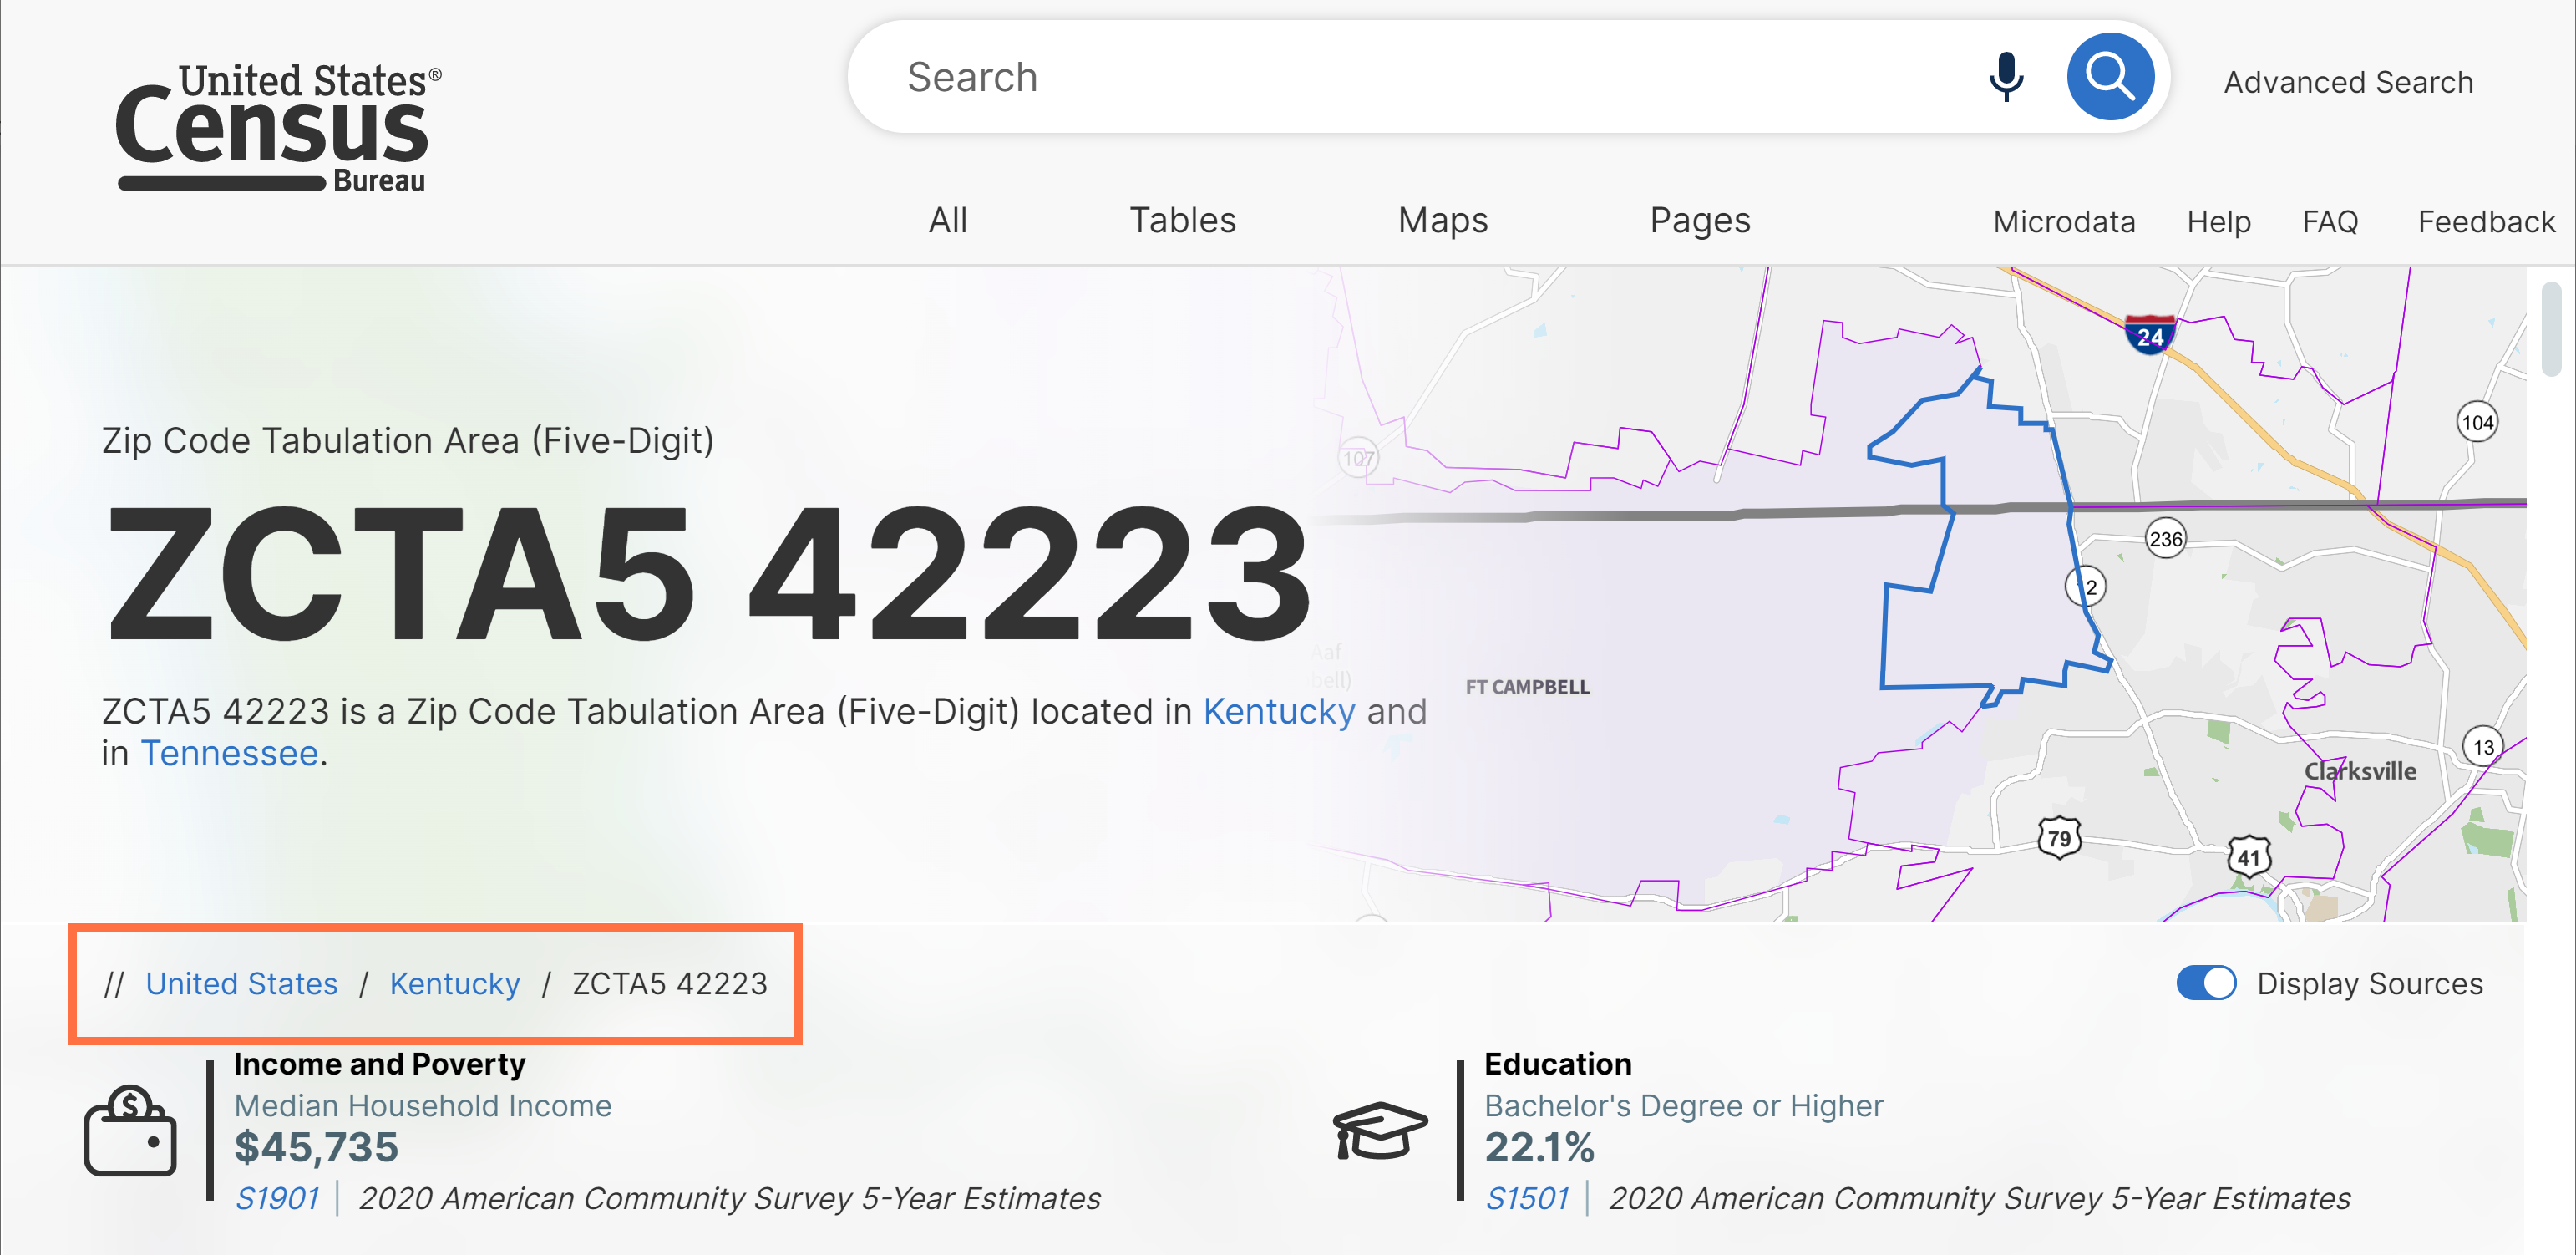
- Behind-the-scenes work to continue to support breadcrumb display in the Geography Profiles. We needed to perform this technical work to maintain the functionality previously provided by these breadcrumbs, due to the above feature.
In situations where the geography has multiple pathways, we will show you the first pathway returned by the API.
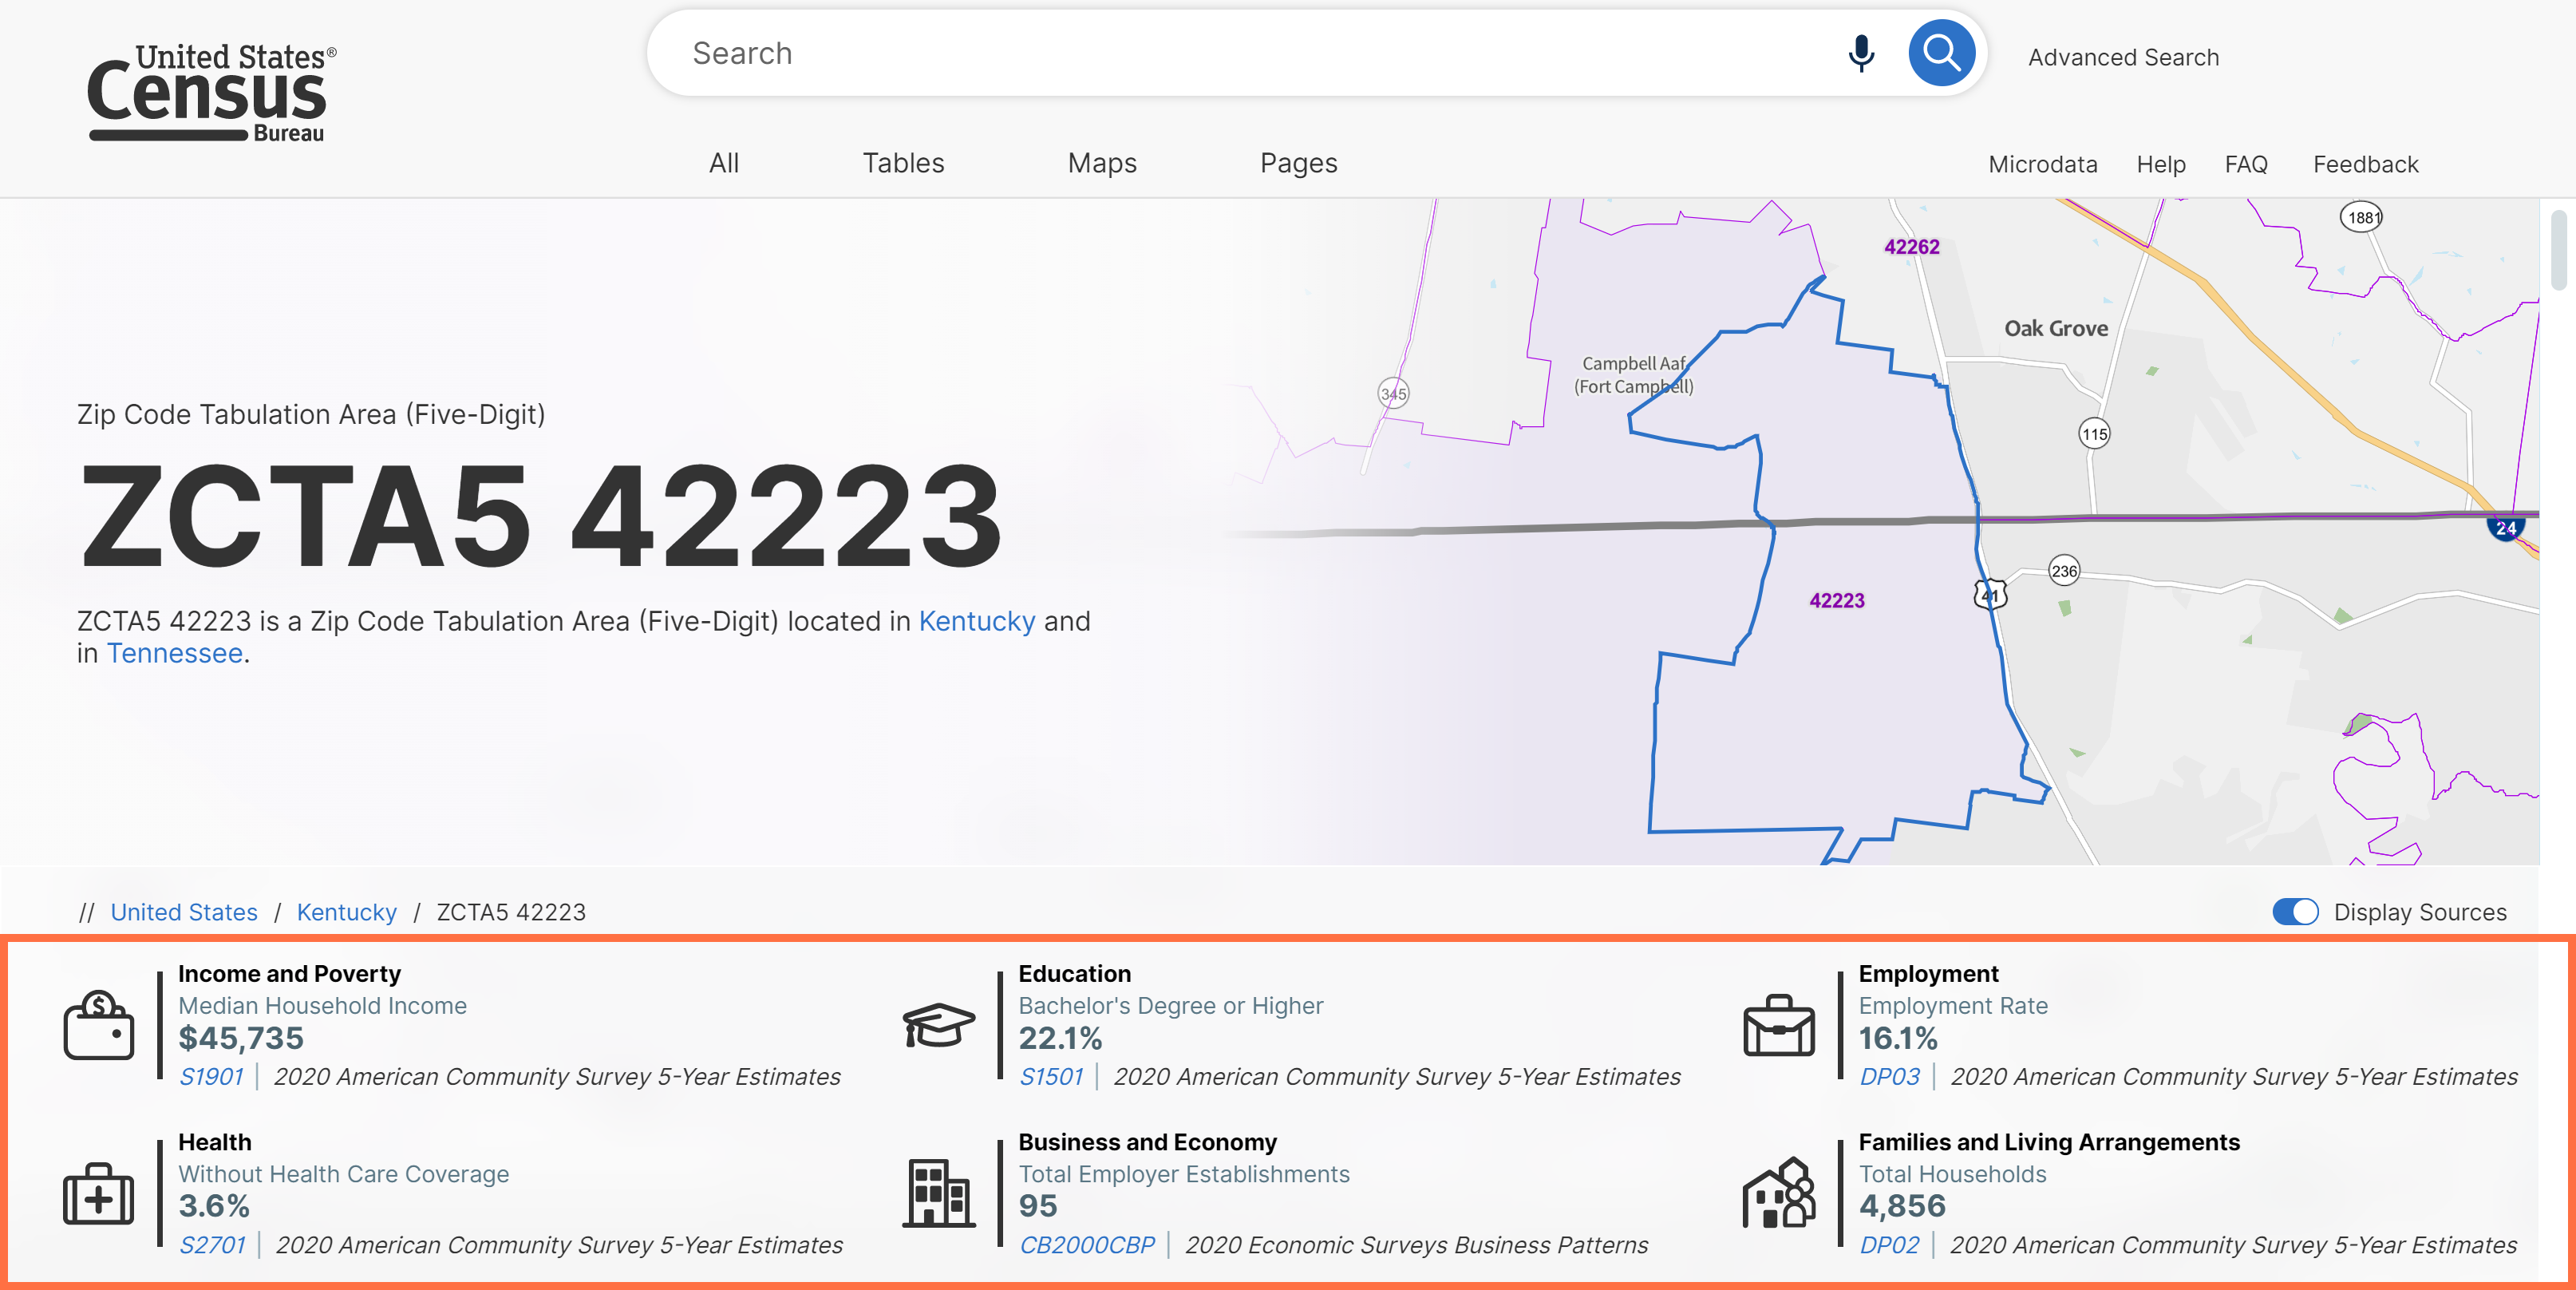
- Faster performance of featured statistics at the top of the Profile pages. With this update, load times for these highlighted data have been greatly improved.
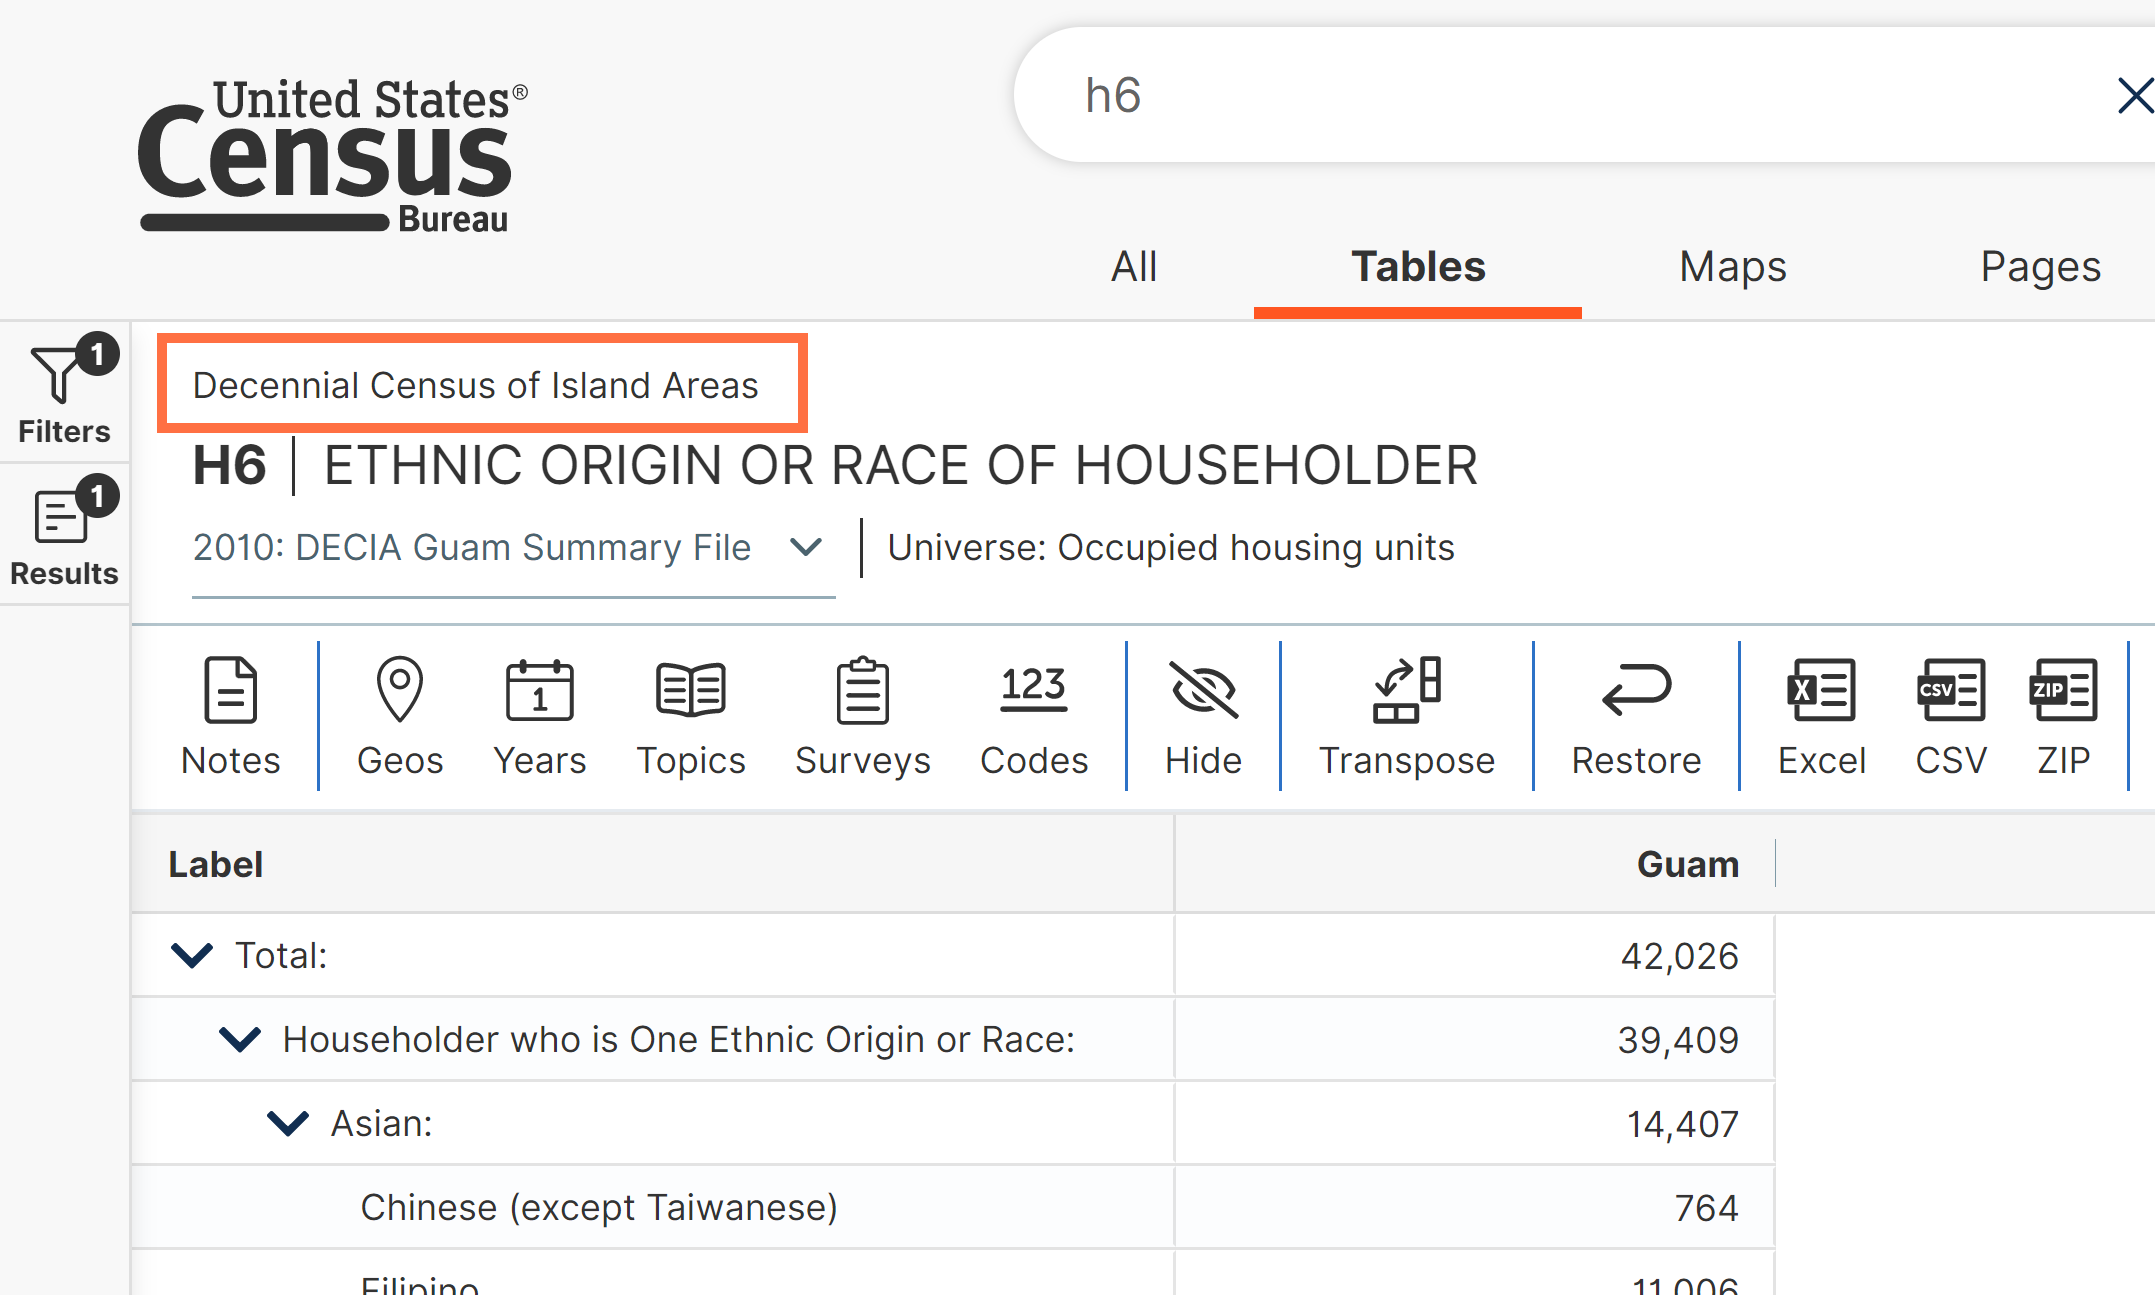
- Improved display of program titles at the top of each table and map. With this update, you will see the full survey or program title.
- More technical updates to improve the ability for external search engines to link and describe content from the Profile pages.
- Fixes to 12 defects, including fixes that allow you to:
- View the compatible list of tables when searching a population group and geography
- See the full label of each typeahead search suggestion
- View links that no longer overlap each other depending on your display size and settings
- View the correct set of table results when searching a ZIP Code Tabulation Areas (ZCTA)
On November 17, we released the following updates to the site:
- Simplified URLs. We removed “/cedsci” from all URLs to make them easier to read. Please note that previously saved URLs with the /cedsci naming convention will continue to work.
- New accessibility features:
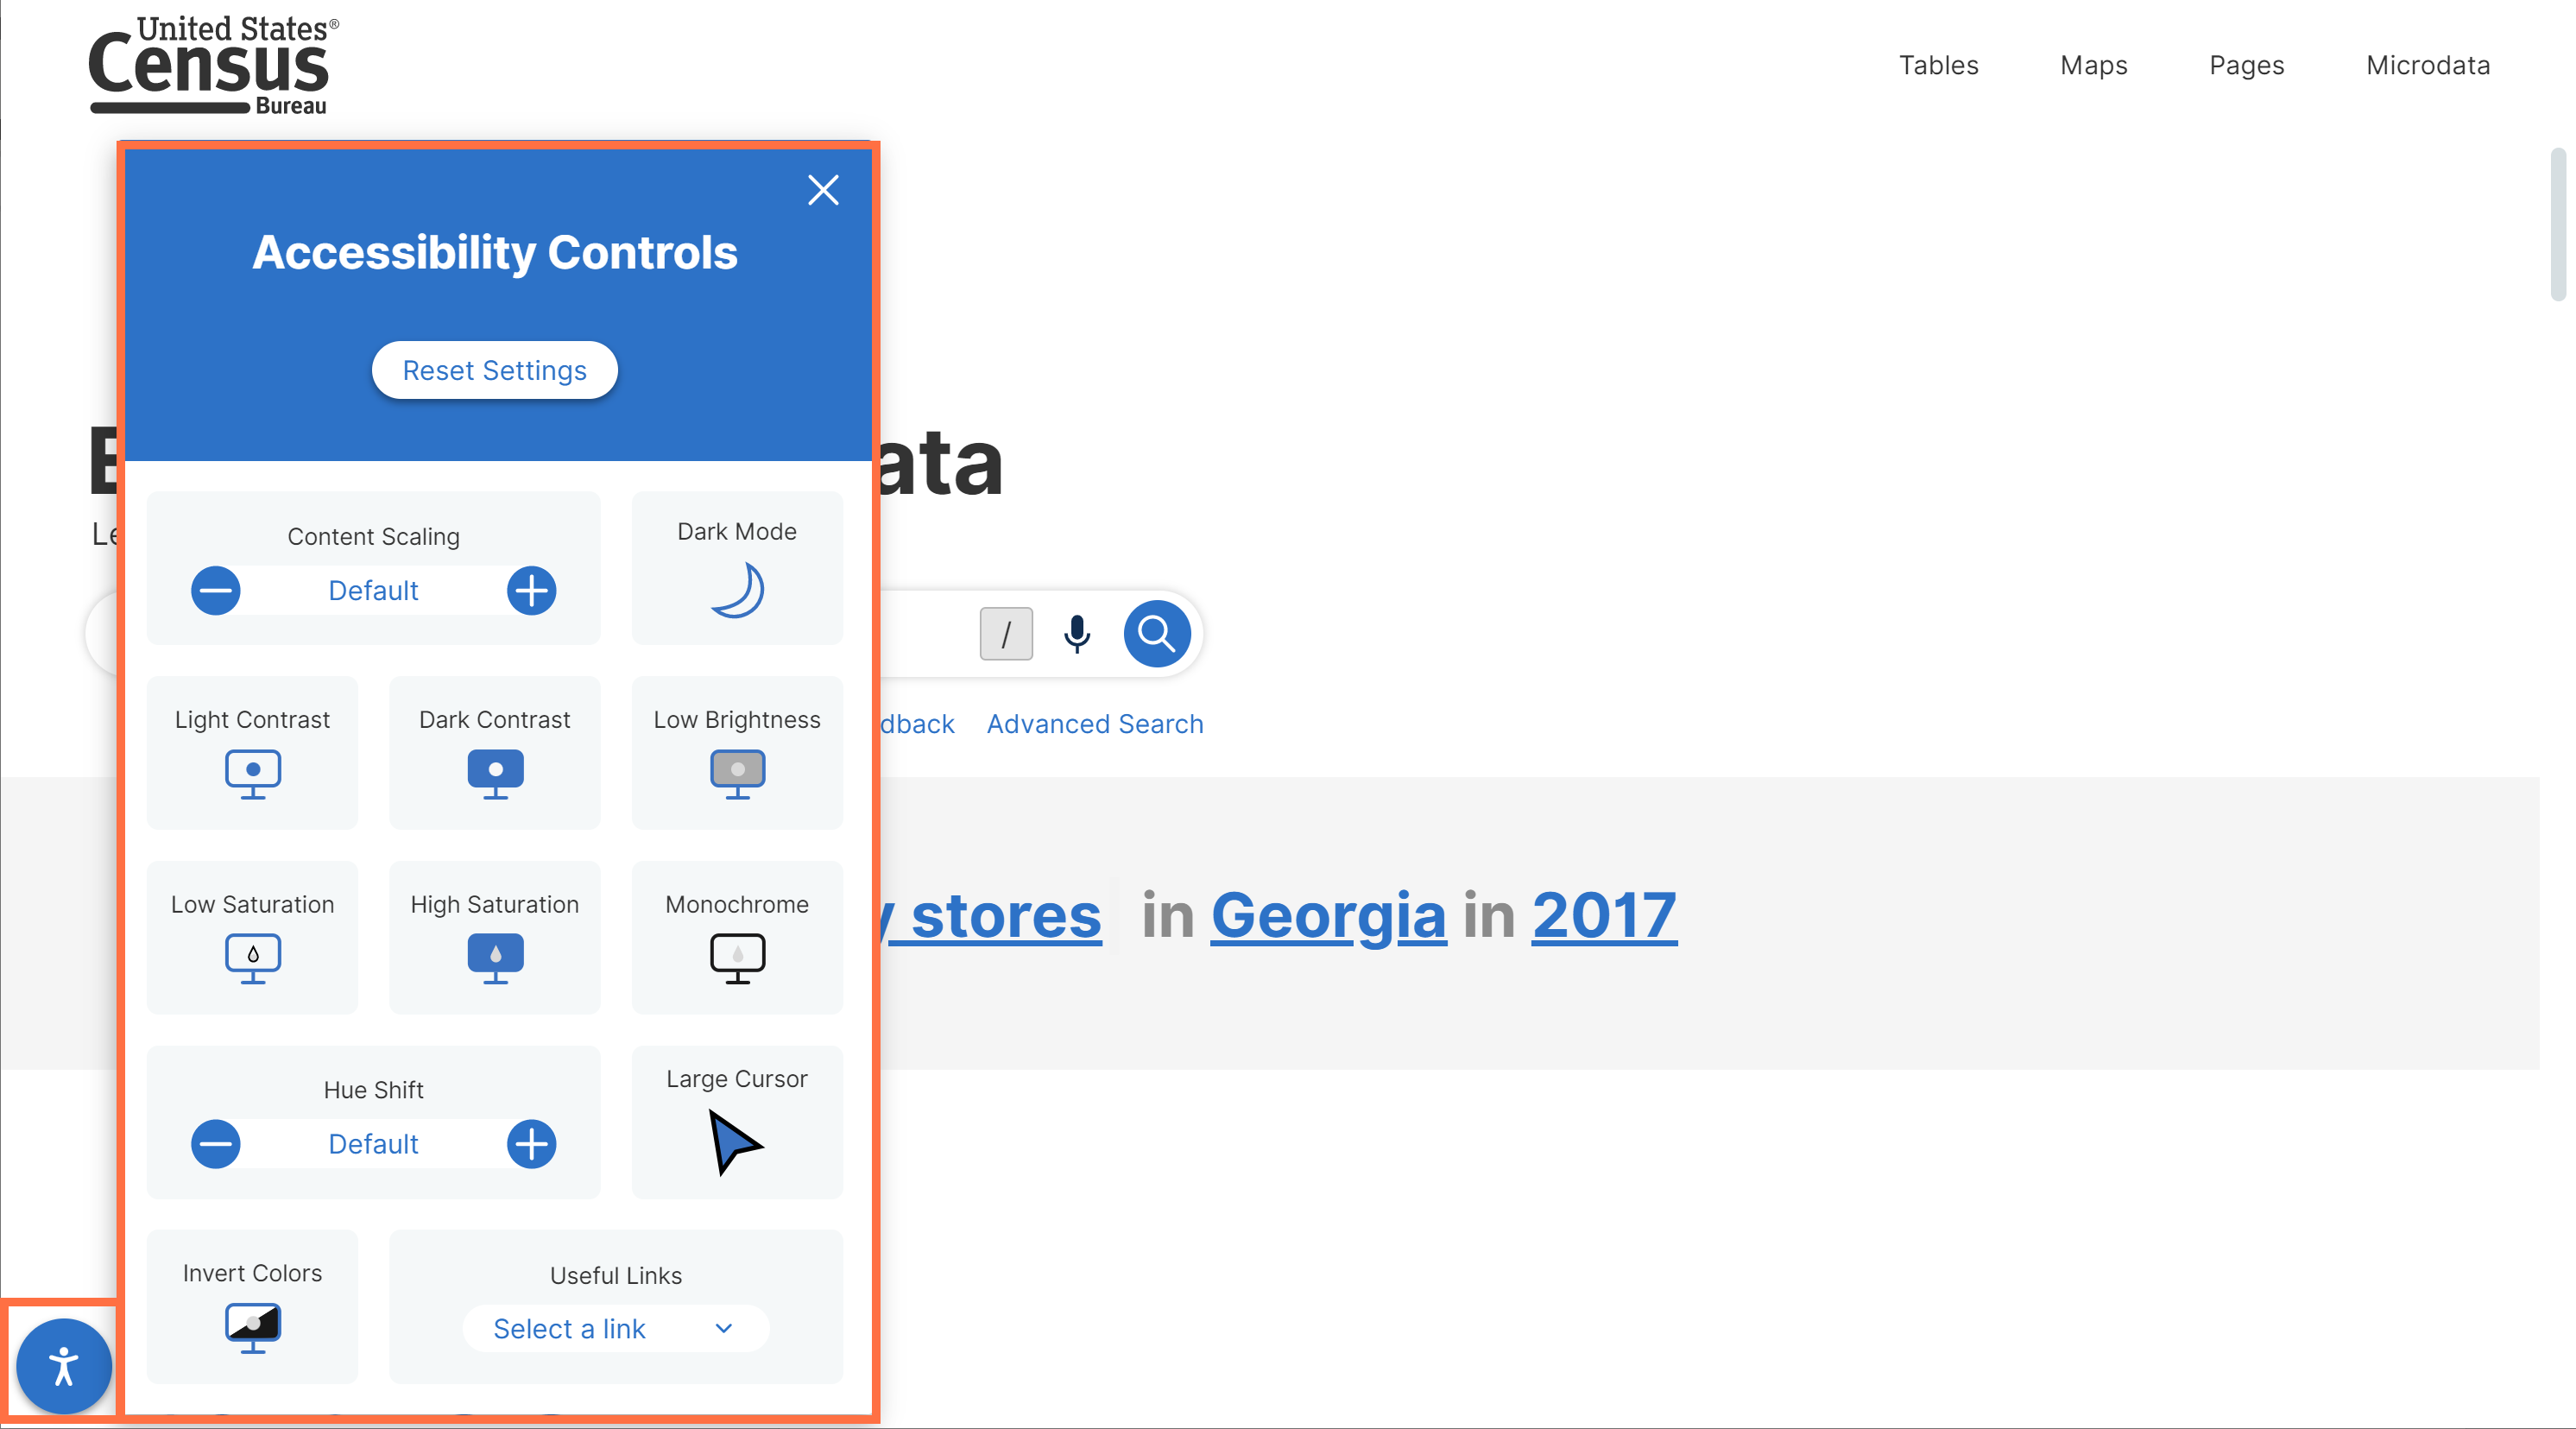
- Accessibility control panel that allows you to customize a variety of display settings:
- Content scaling: Adjust the zoom level of the site
- Dark mode: Apply a dark background with light fonts
- Light contrast: Make differences between light colors more noticeable
- Dark contrast: Make differences between dark colors more noticeable
- Low brightness: Decrease overall brightness
- Low saturation: Colors appear less vivid and closer to a pure gray color
- High saturation: Colors appear more vivid and intense
- Monochrome: View the site in grayscale
- Hue Shift: Apply different colors from the color wheel
- Large Cursor: Change the cursor to a large, blue pointer
- Invert Color: Change colors to the opposite hue on the color wheel
- Useful Links: Provides a short cut to all the useful links on the website
- Reset Settings: Go back to the default settings
- To access the new accessibility control panel, click the person icon in the lower left corner of the screen.
- Accessibility control panel that allows you to customize a variety of display settings:
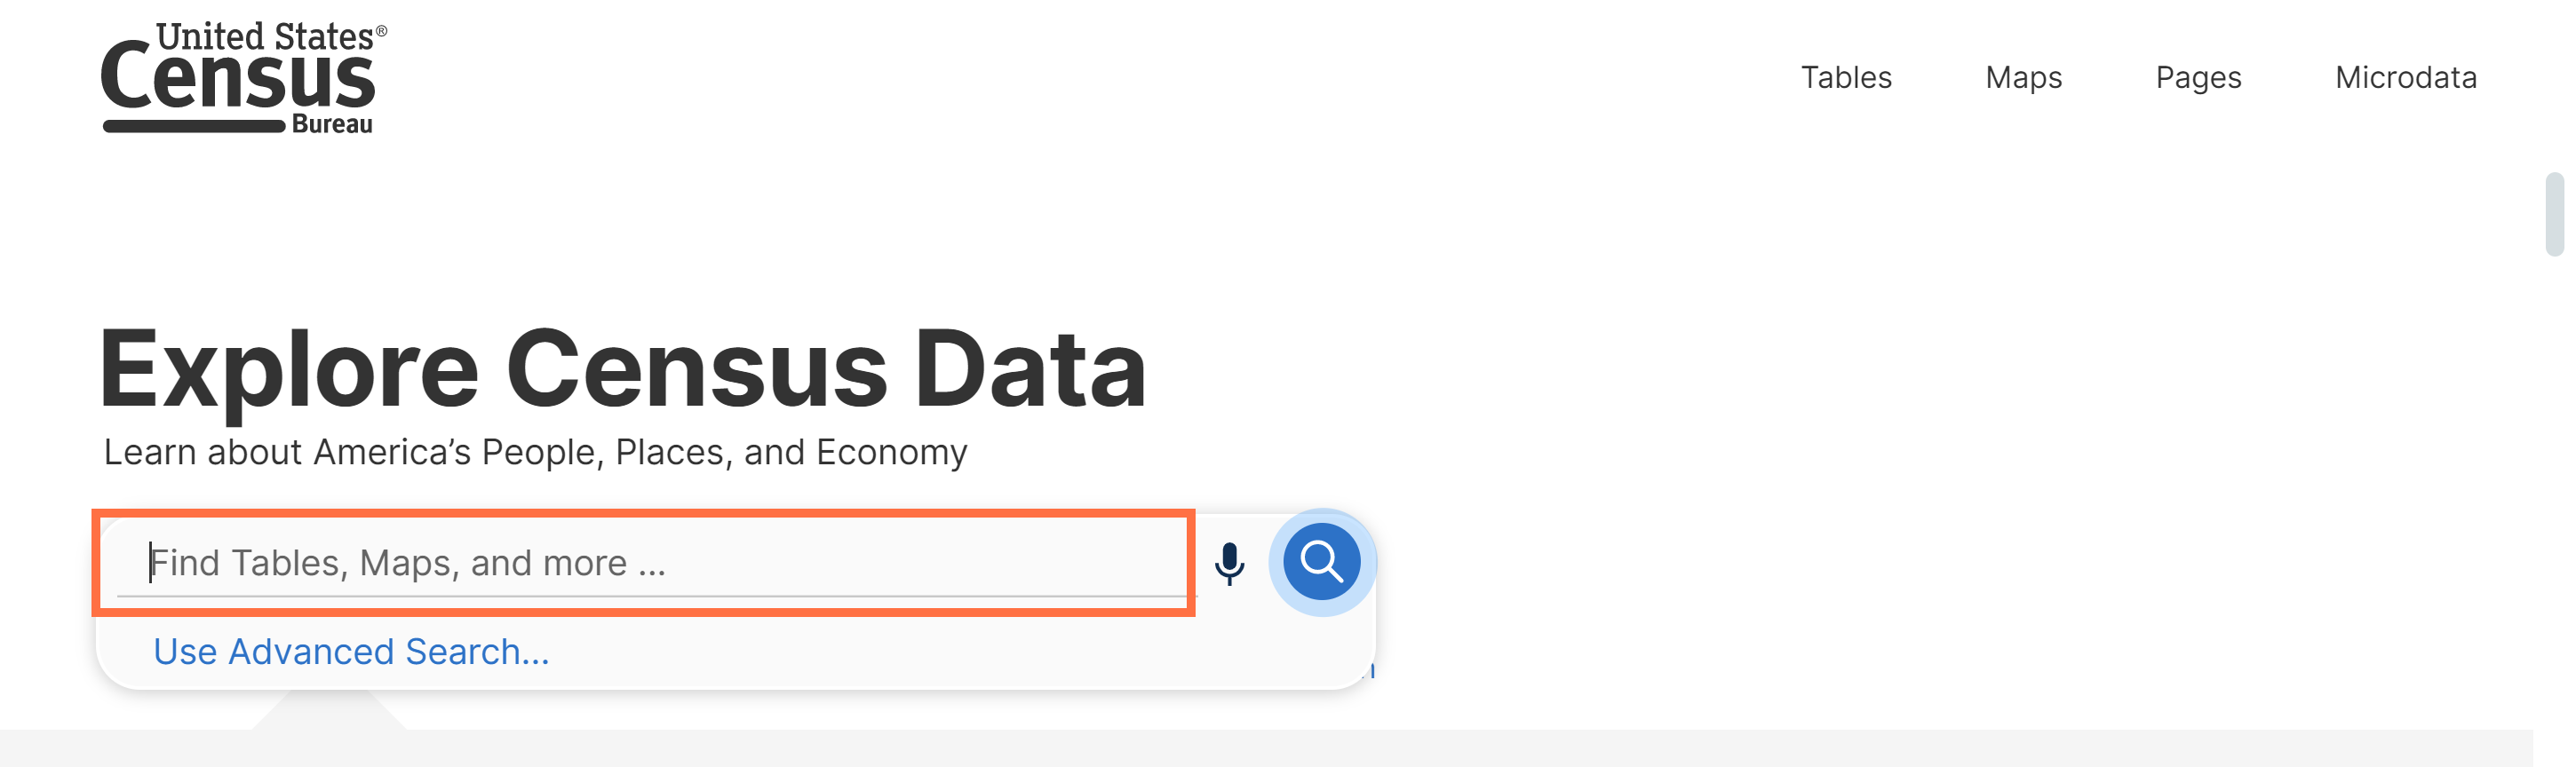
- Hotkey access to the single search bar. When you press the / key, your cursor becomes active in the single search bar. This allows you to type or edit search criteria without using a mouse.
- Technical updates to improve screen scaling. These updates will provide an automatic adjustment of application scaling to best use the size of the user’s display, ensuring the content fits correctly and is readable.
- Behind-the-scenes updates to the display and mapping software to make sure they are up-to-date and able to support the functionality needs of the site.
- Fixes to 31 defects, including fixes that allow you to:
- Search common geographies that share similar wording to population groups
- View data for all economic places in the U.S.
- Properly recode variables and download tables in the Microdata Access Tool (MDAT) due to technical fixes applied to the URL encoding
- View detailed population groups in alphabetical order in the filter panel
- View Annual Survey of Manufactures tables filtered by NAICS
On December 29, we released the following updates to the site:
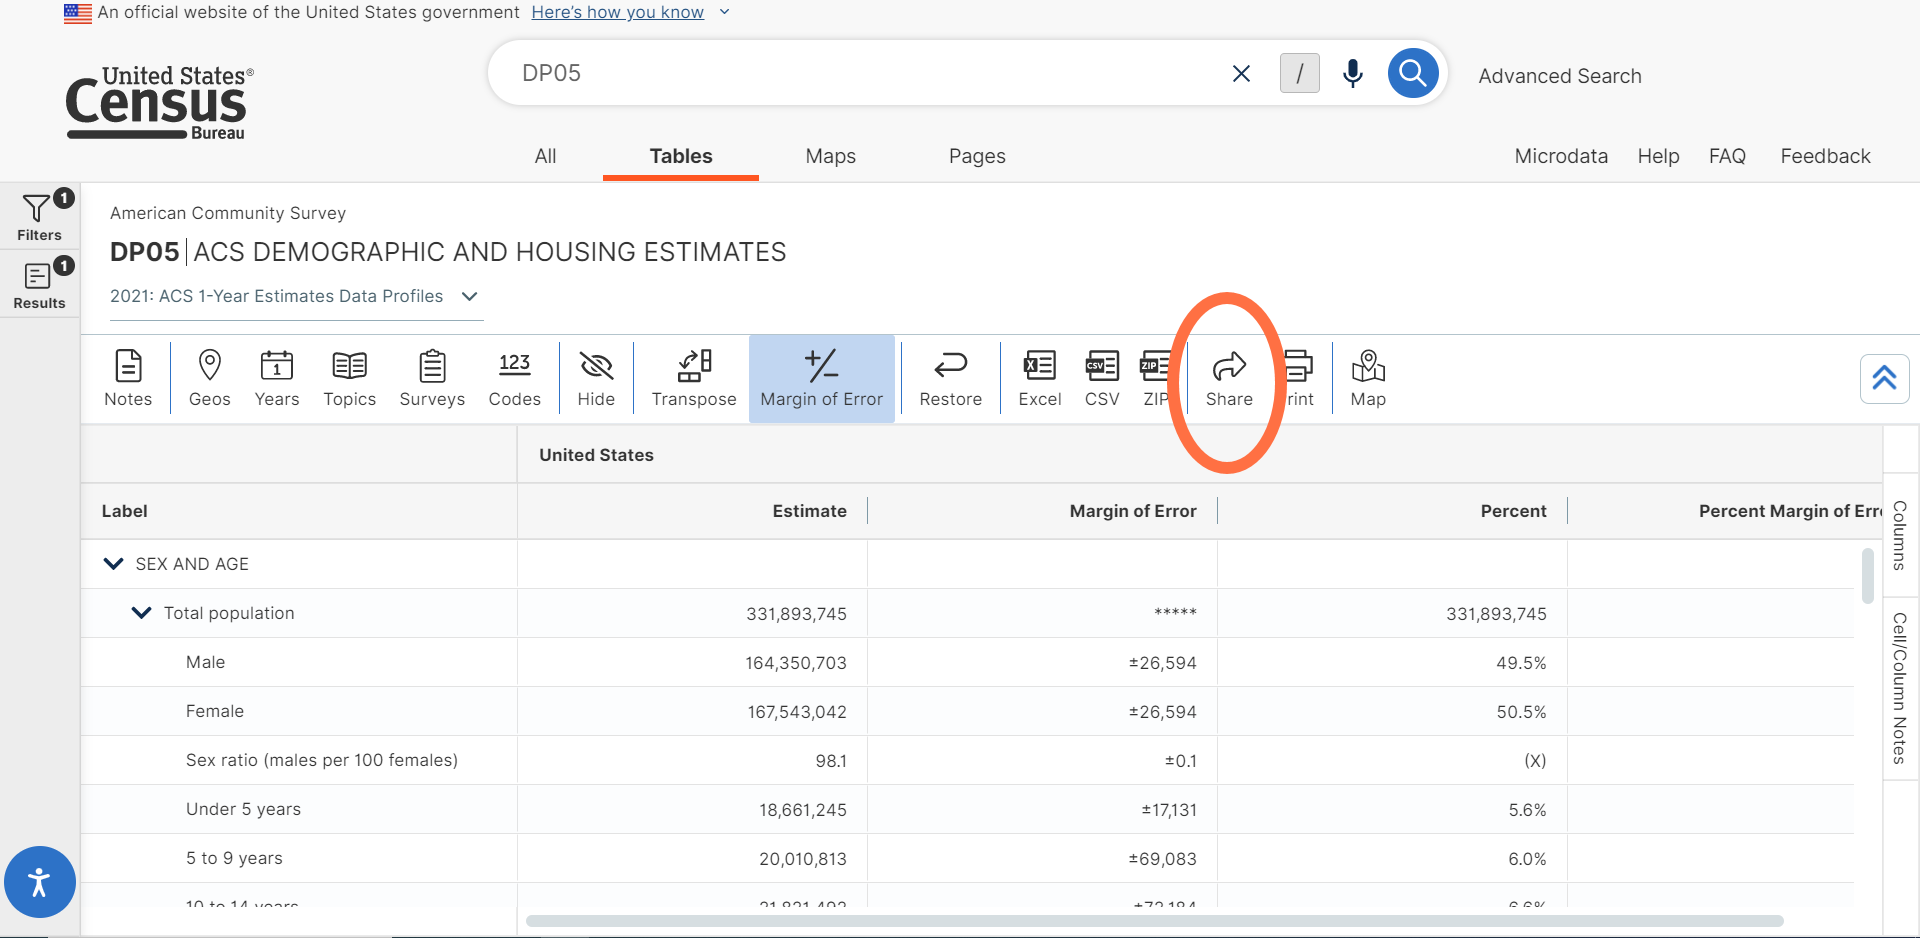
- A share button on the table tool bar. This adds a share button to the toolbar in the table view. Located between the downloads and print. This allows users to copy the URL to their clipboard to share the page.
- Fixes to 10 defects, including fixes that allow you to:
- Search “Spanish American” without getting “something went wrong” message.
- View collections of geographies at the top of the table list in the filter panel.
- Unselect all the vintages when downloading the tables.
On December 15, we released the following updates to the site:
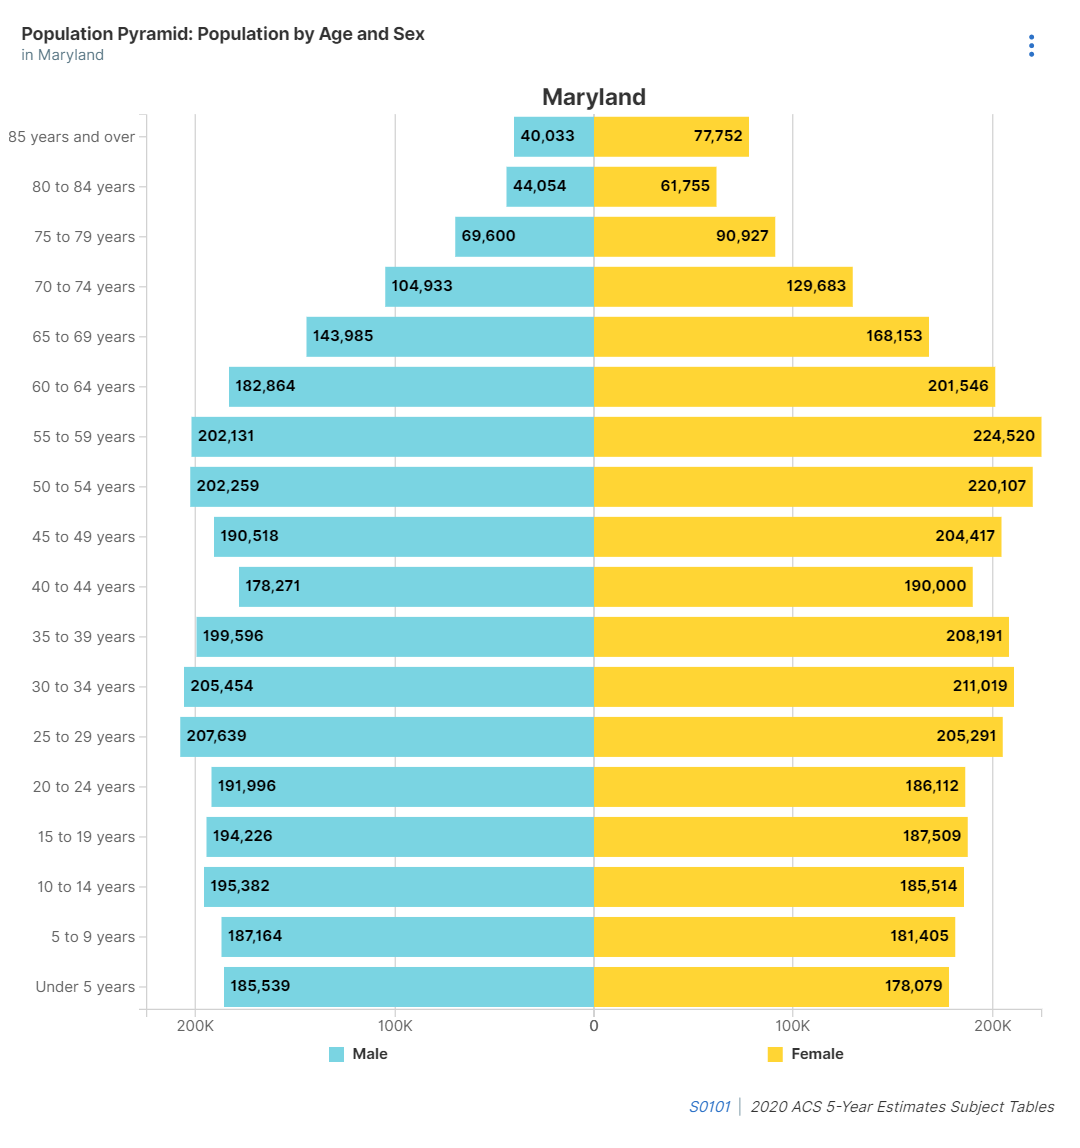
New population pyramids. When you access a profile that contains a section for “Age and Sex,” you will see population pyramids. This includes Geography Profiles for the nation, states, counties, cities/towns, congressional districts, school districts, American Indian Areas, Alaska Native Areas, and Hawaiian Homelands.
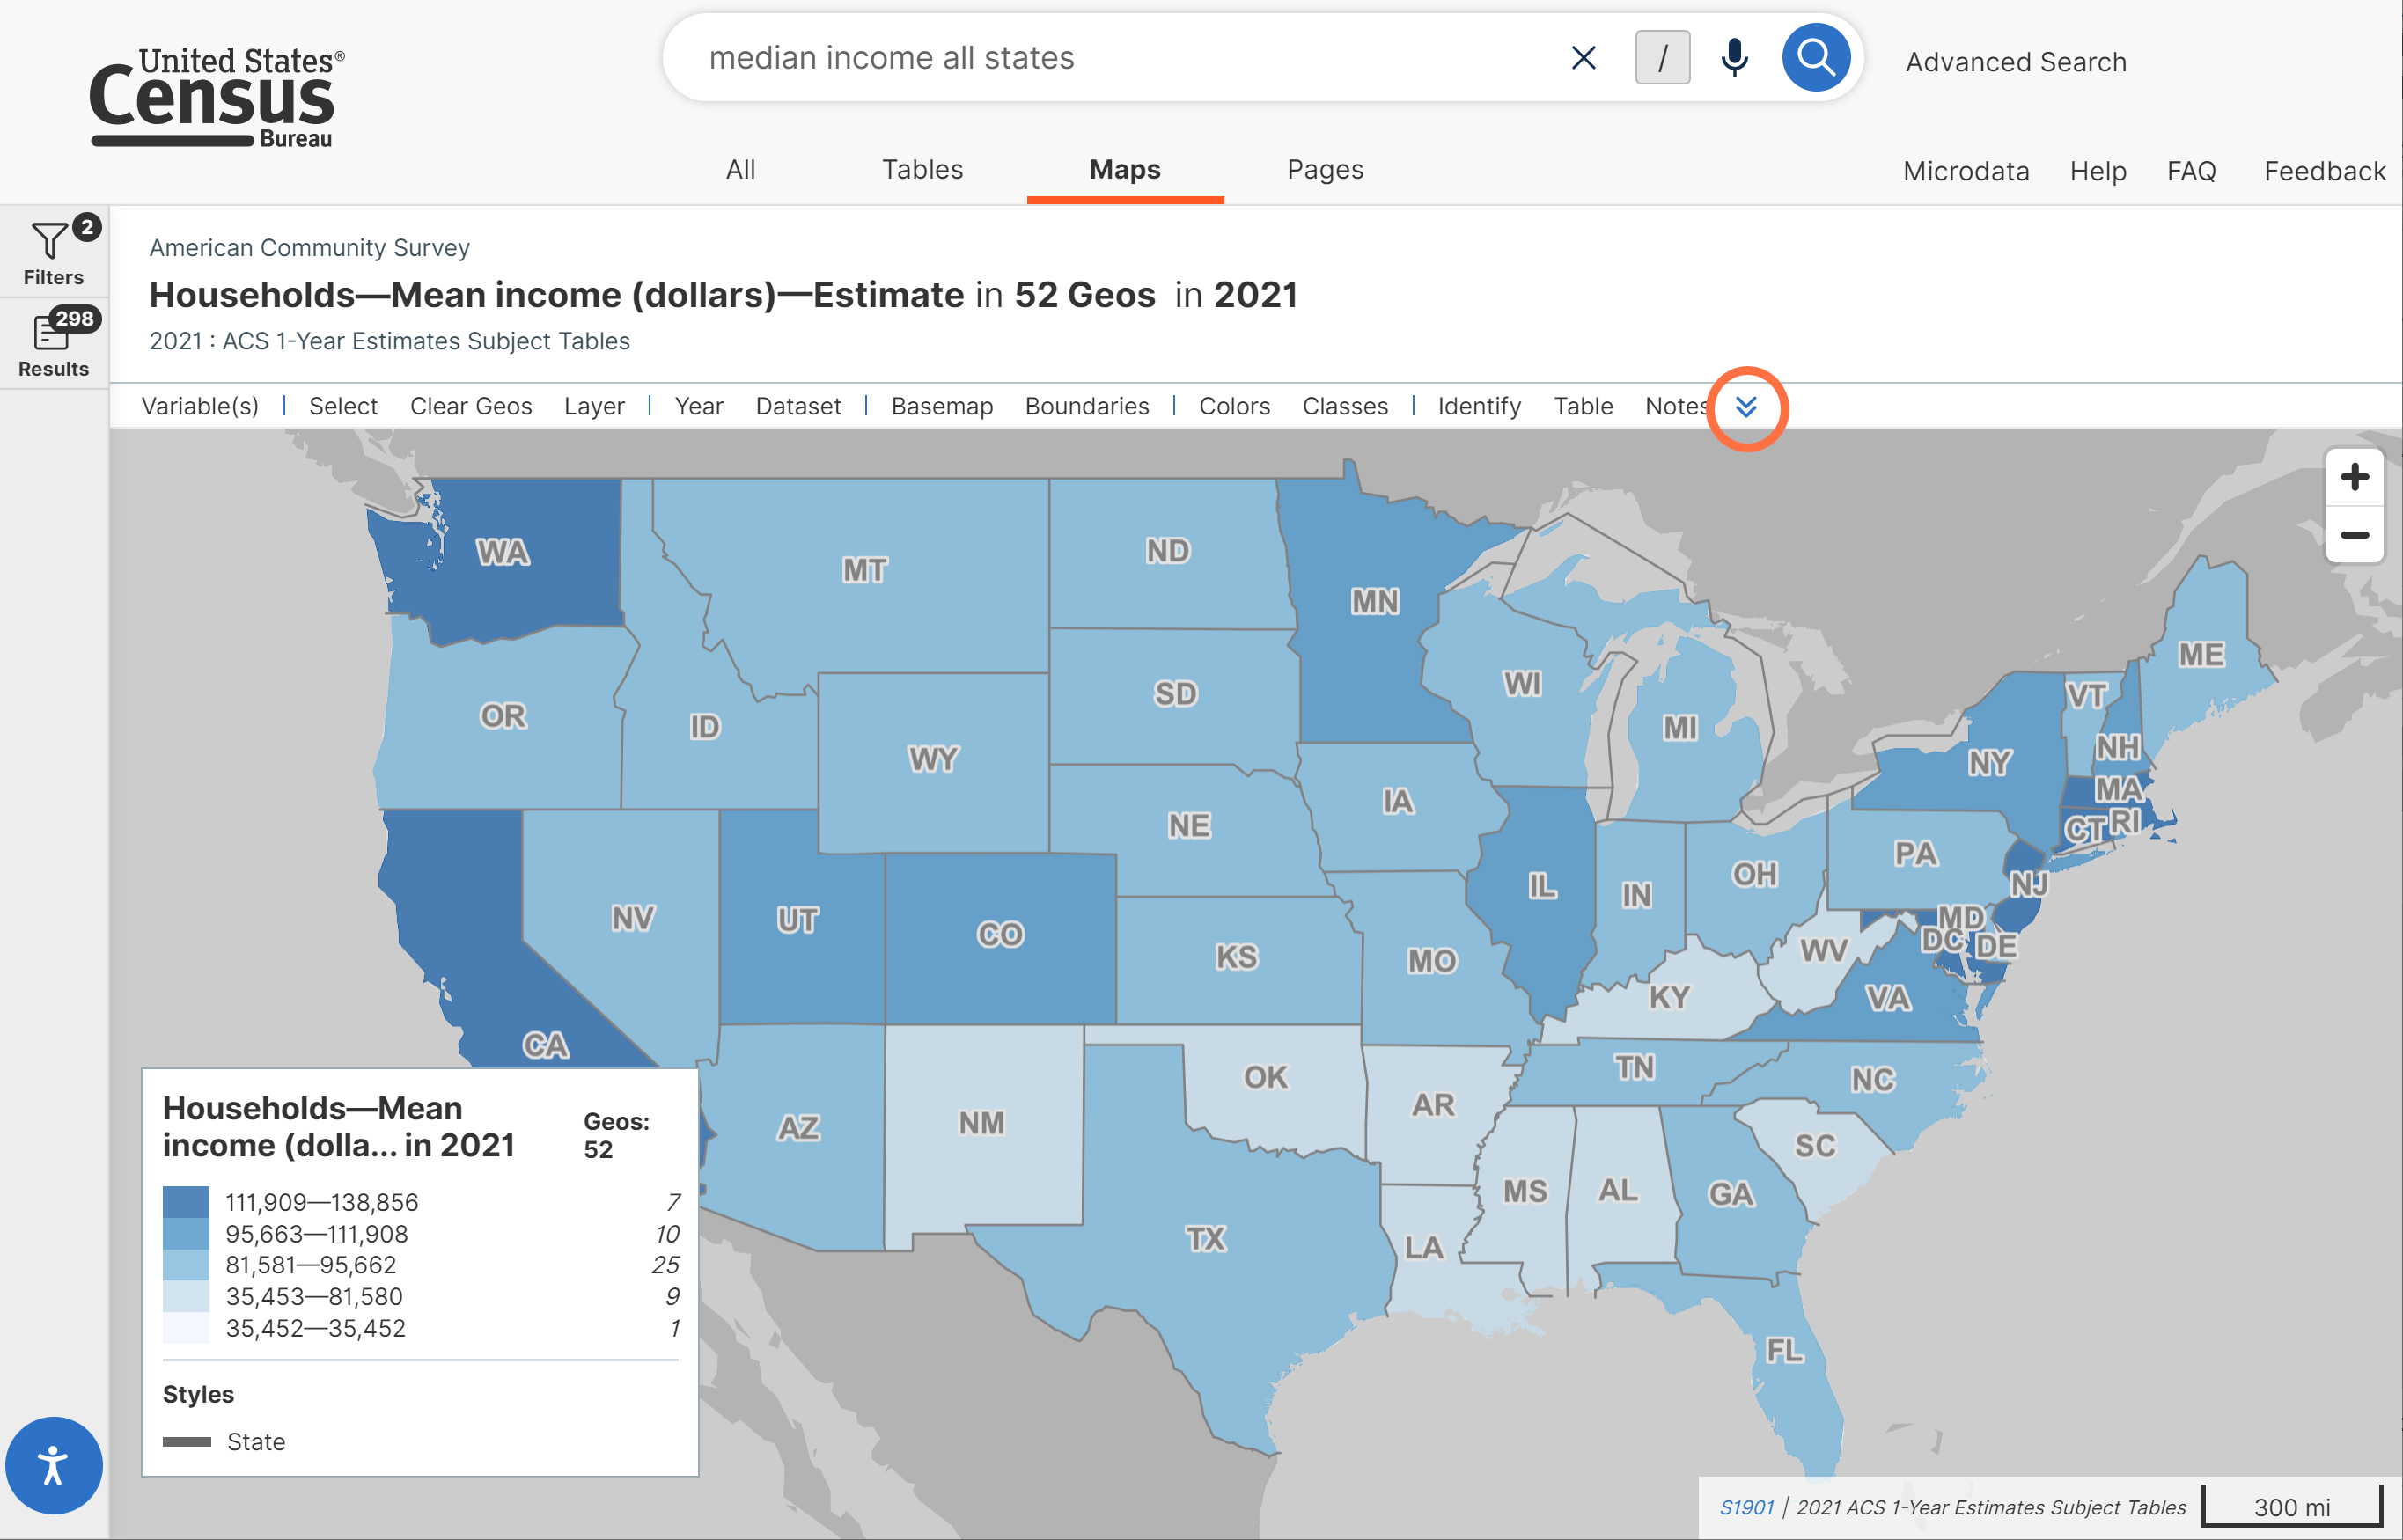
- Ability to collapse the table or map toolbar. This allows you to devote more space on your screen to the table or map you are viewing. You can expand or collapse the toolbar by clicking the chevron at the top.
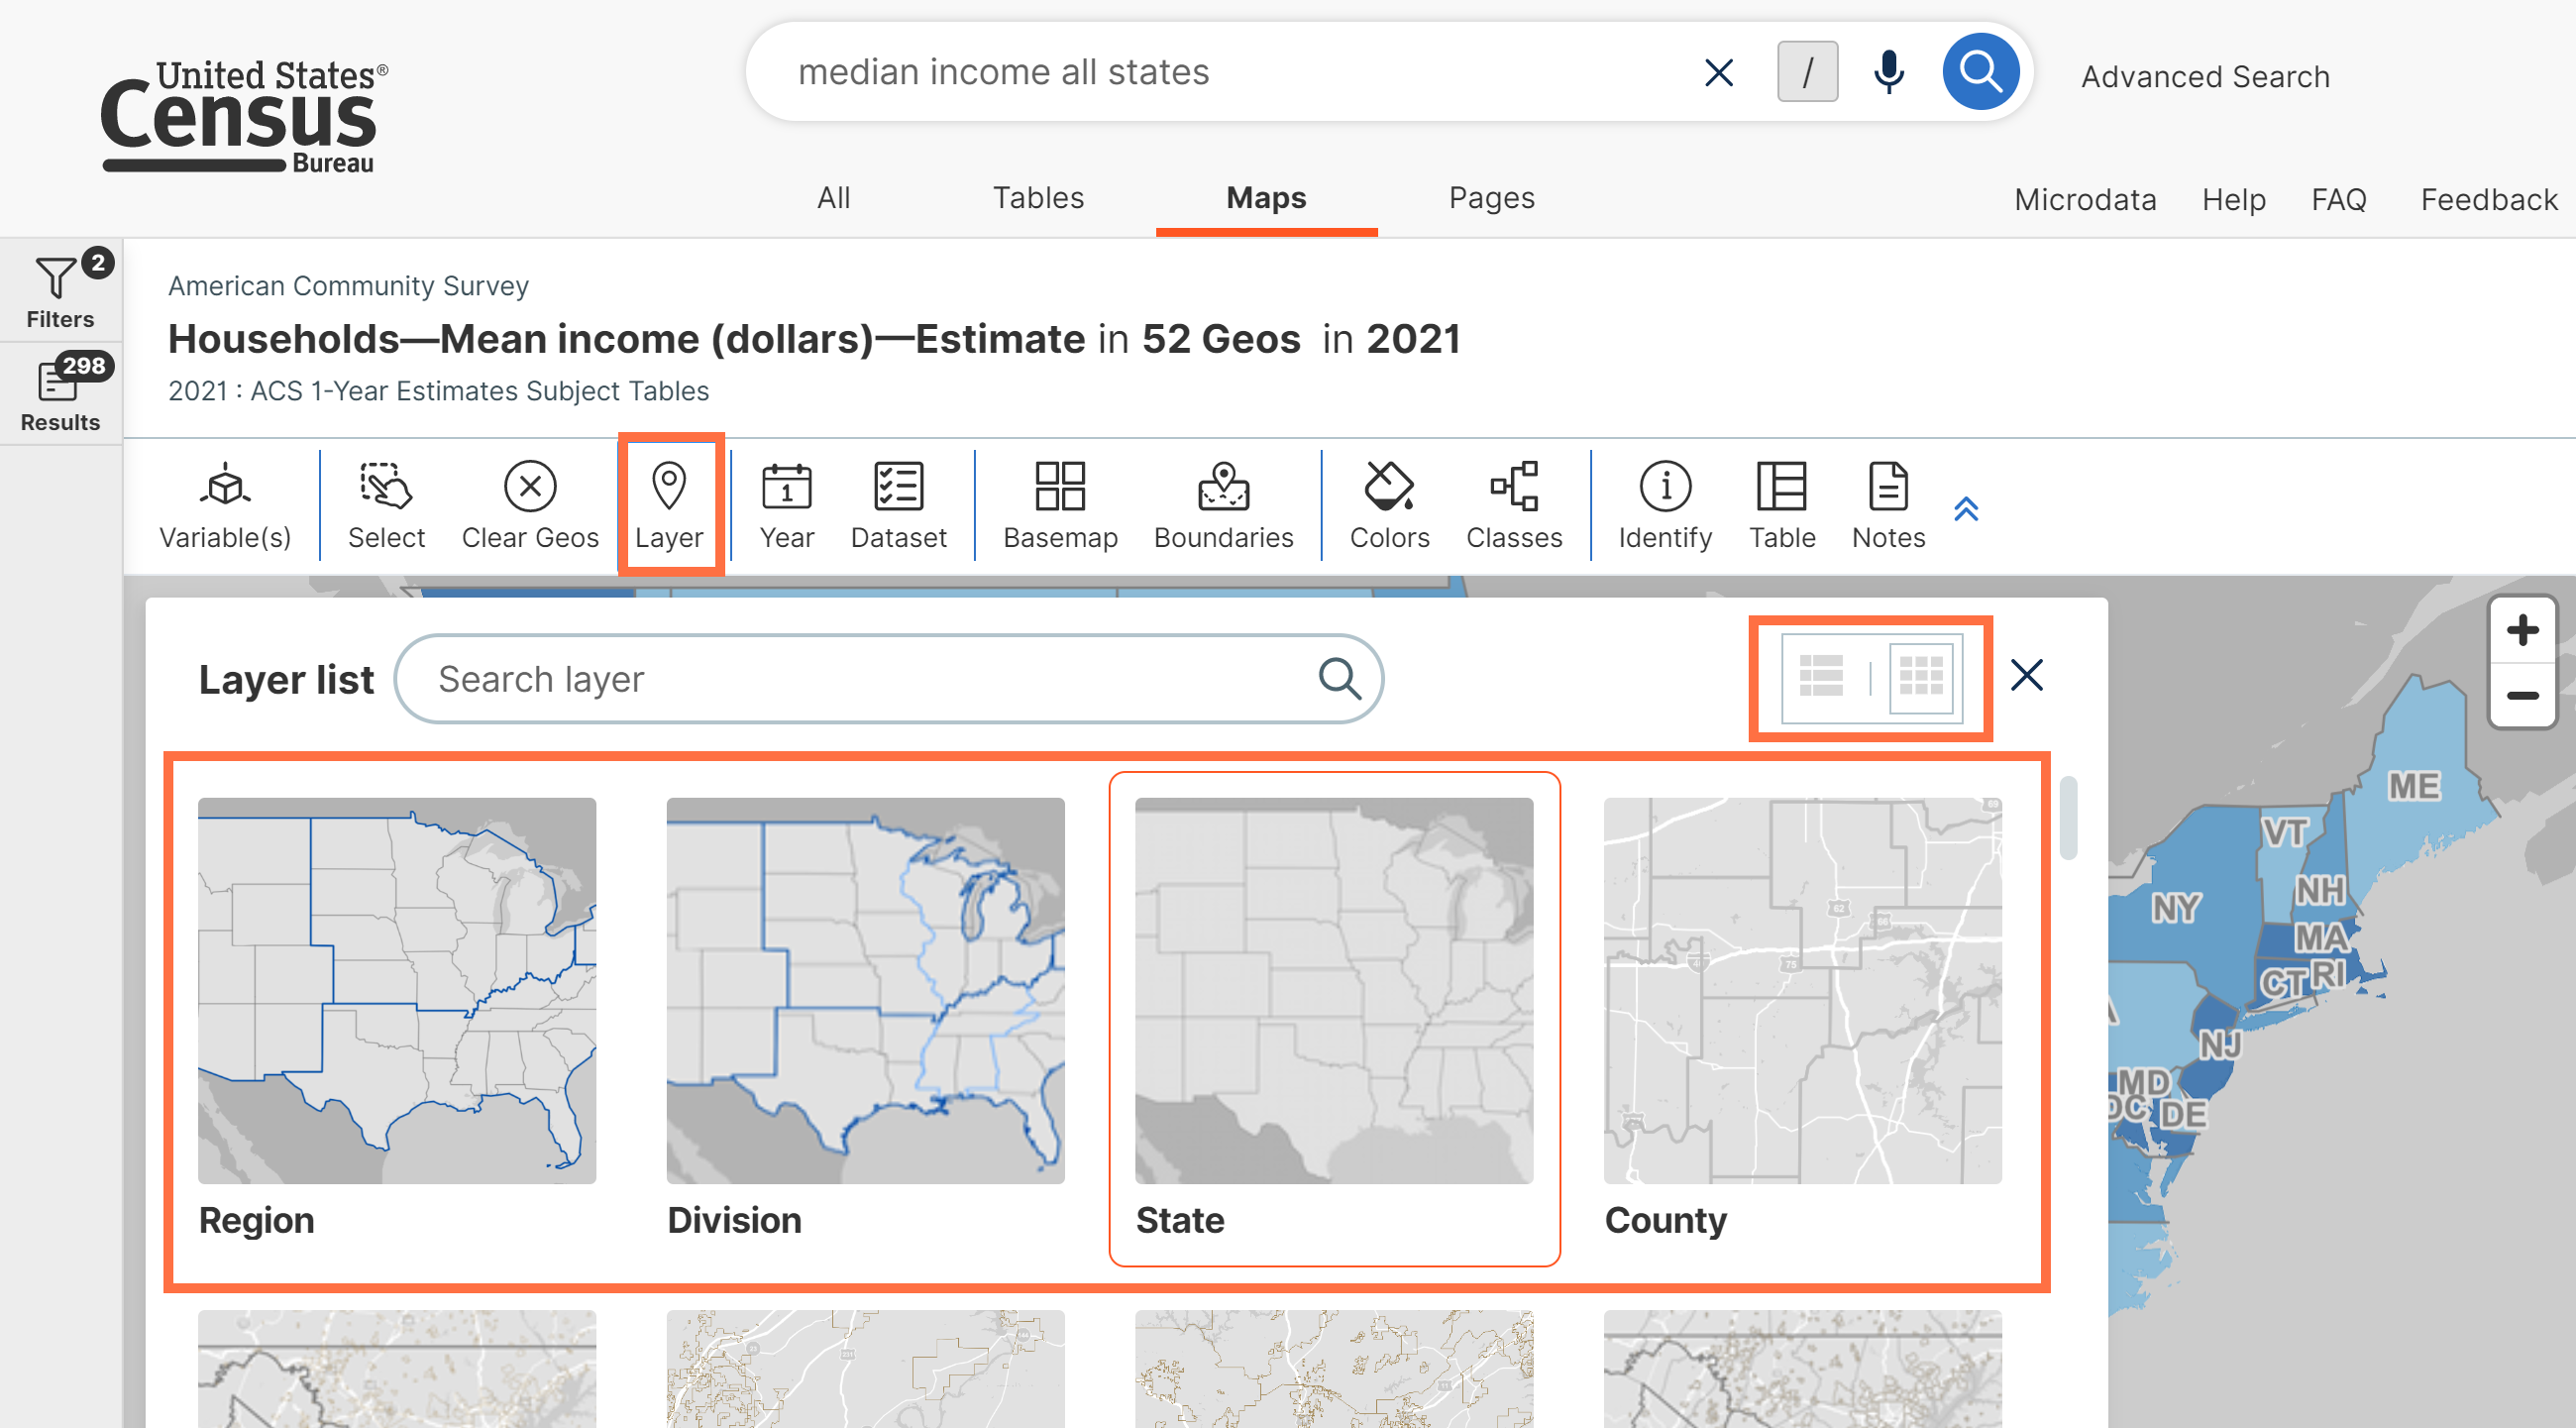
- Improved selection of map layer. When you click the “Layer” button, you will now see a grid view with an image showing the boundary for each option. This new feature is now the default view. You may click the list and grid icons in the upper right of the pop-up window to switch between this new grid view or a list view.
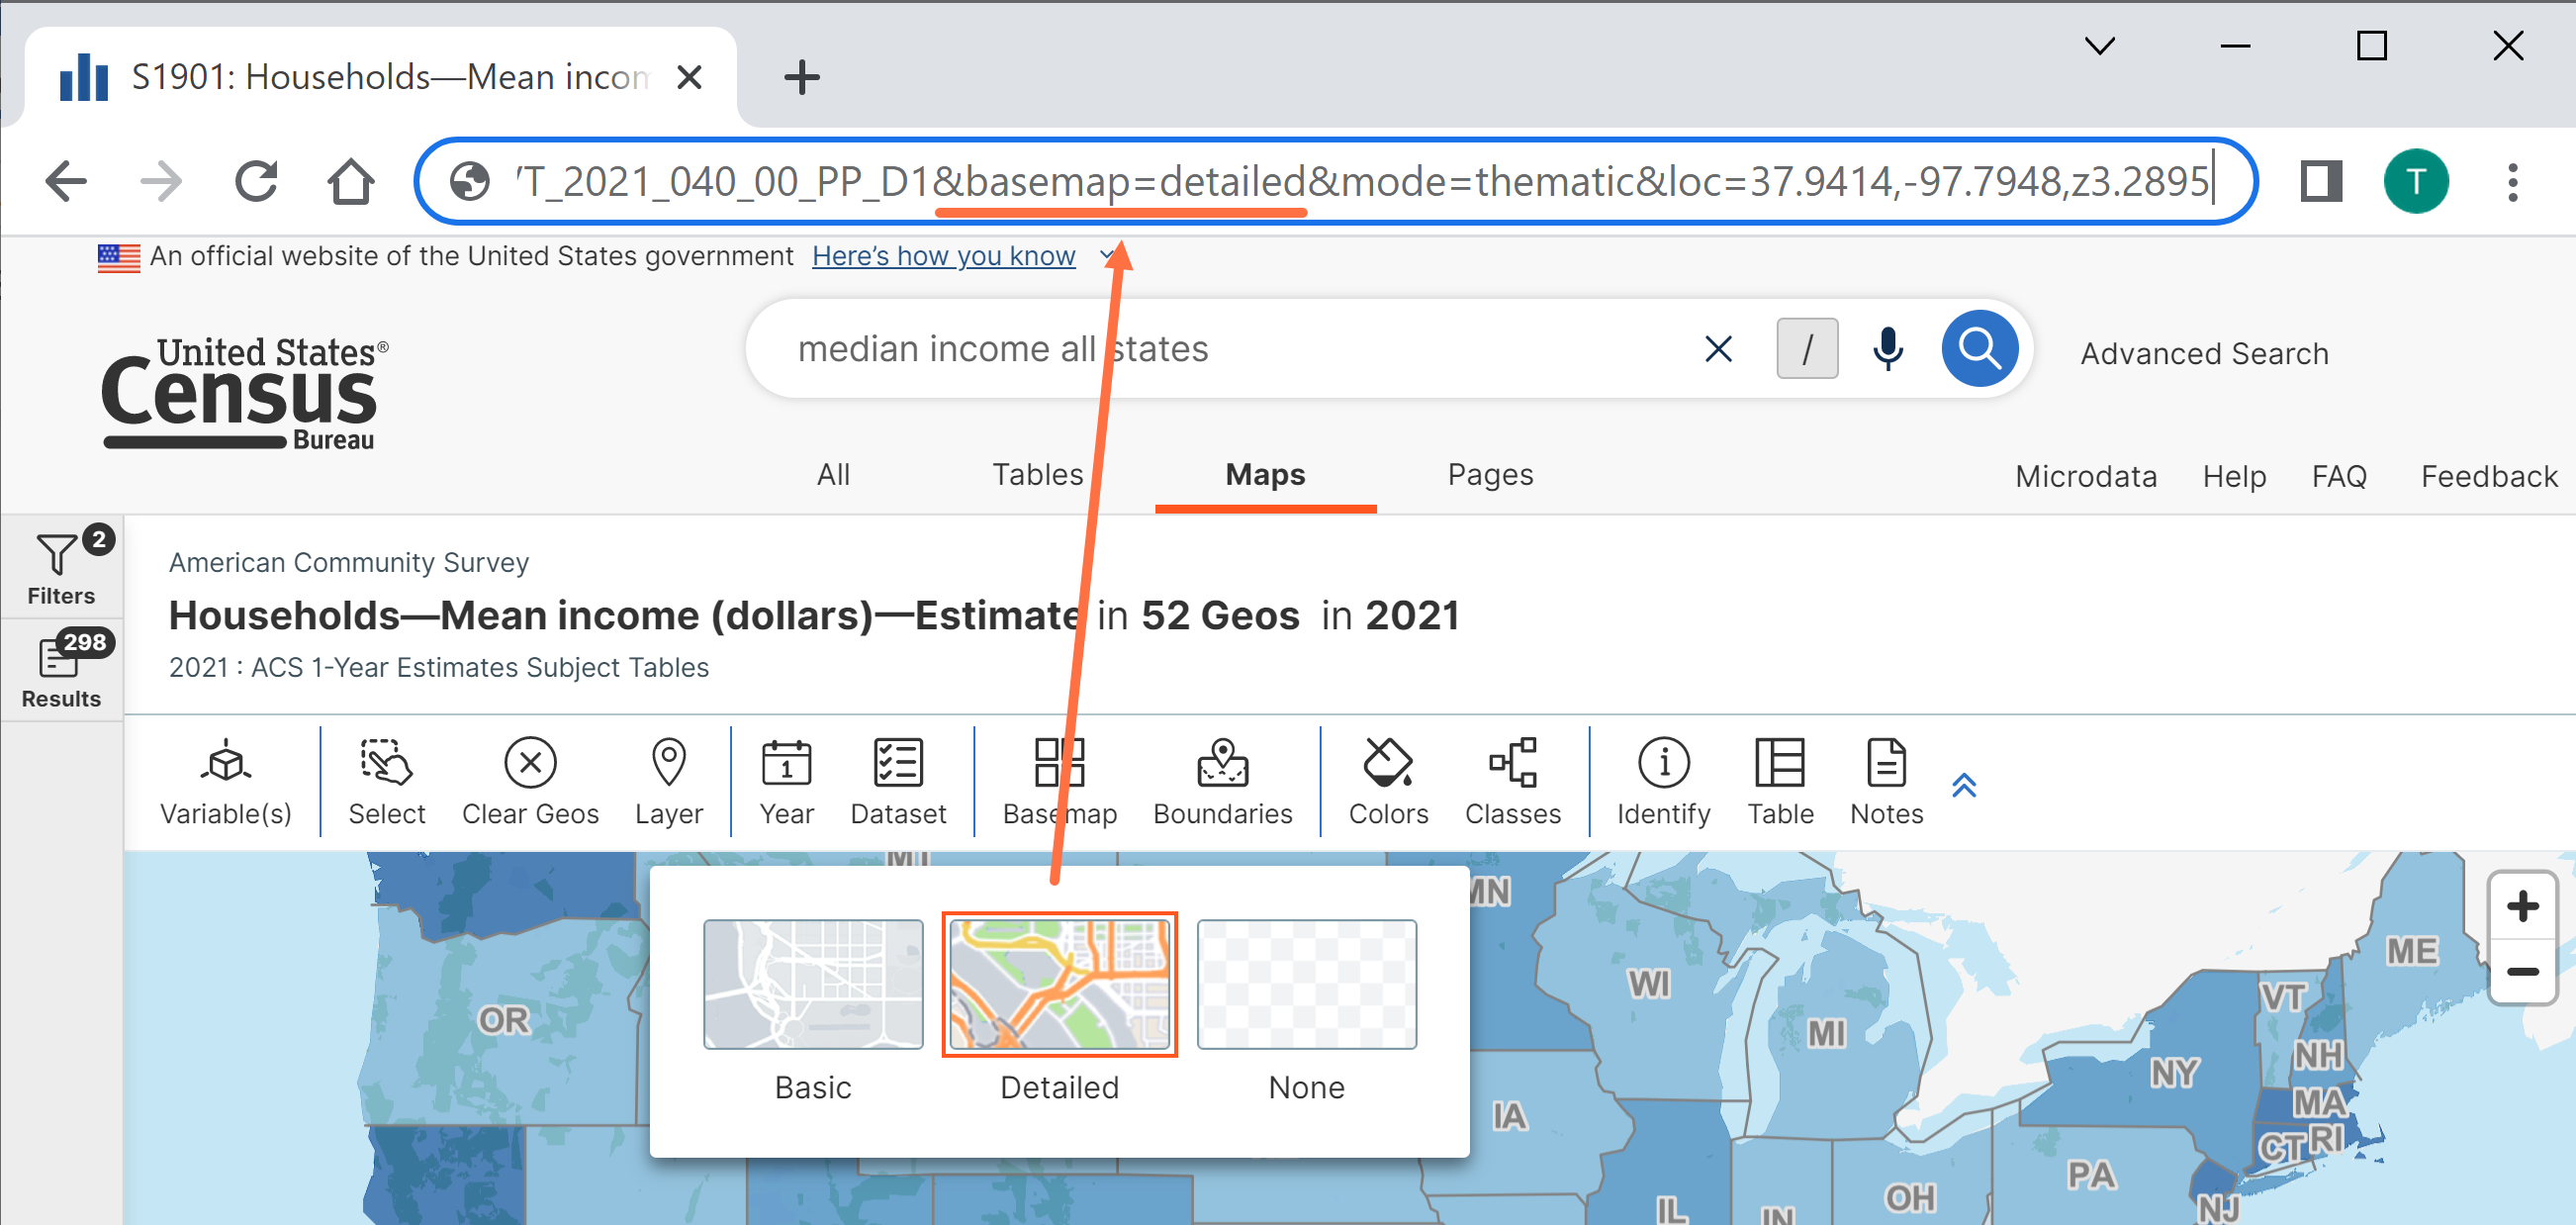
- Improved URLs to capture your basemap selection. This means that when you choose a basemap that is different than the default selection, these details will be added to your URL. If you decide to share this link or visit it later, your basemap selection will be saved.
These details are reflected in the parameter that begins with &basemap=
For example, the below URL saves the selection for the detailed basemap: data.census.gov/map?q=median+income+all+states&tid=ACSST1Y2021.S1901&cid=S1901_C01_013E&layer=VT_2021_040_00_PP_D1&basemap=detailed&mode=thematic&loc=37.9414,-97.7948,z3.2895
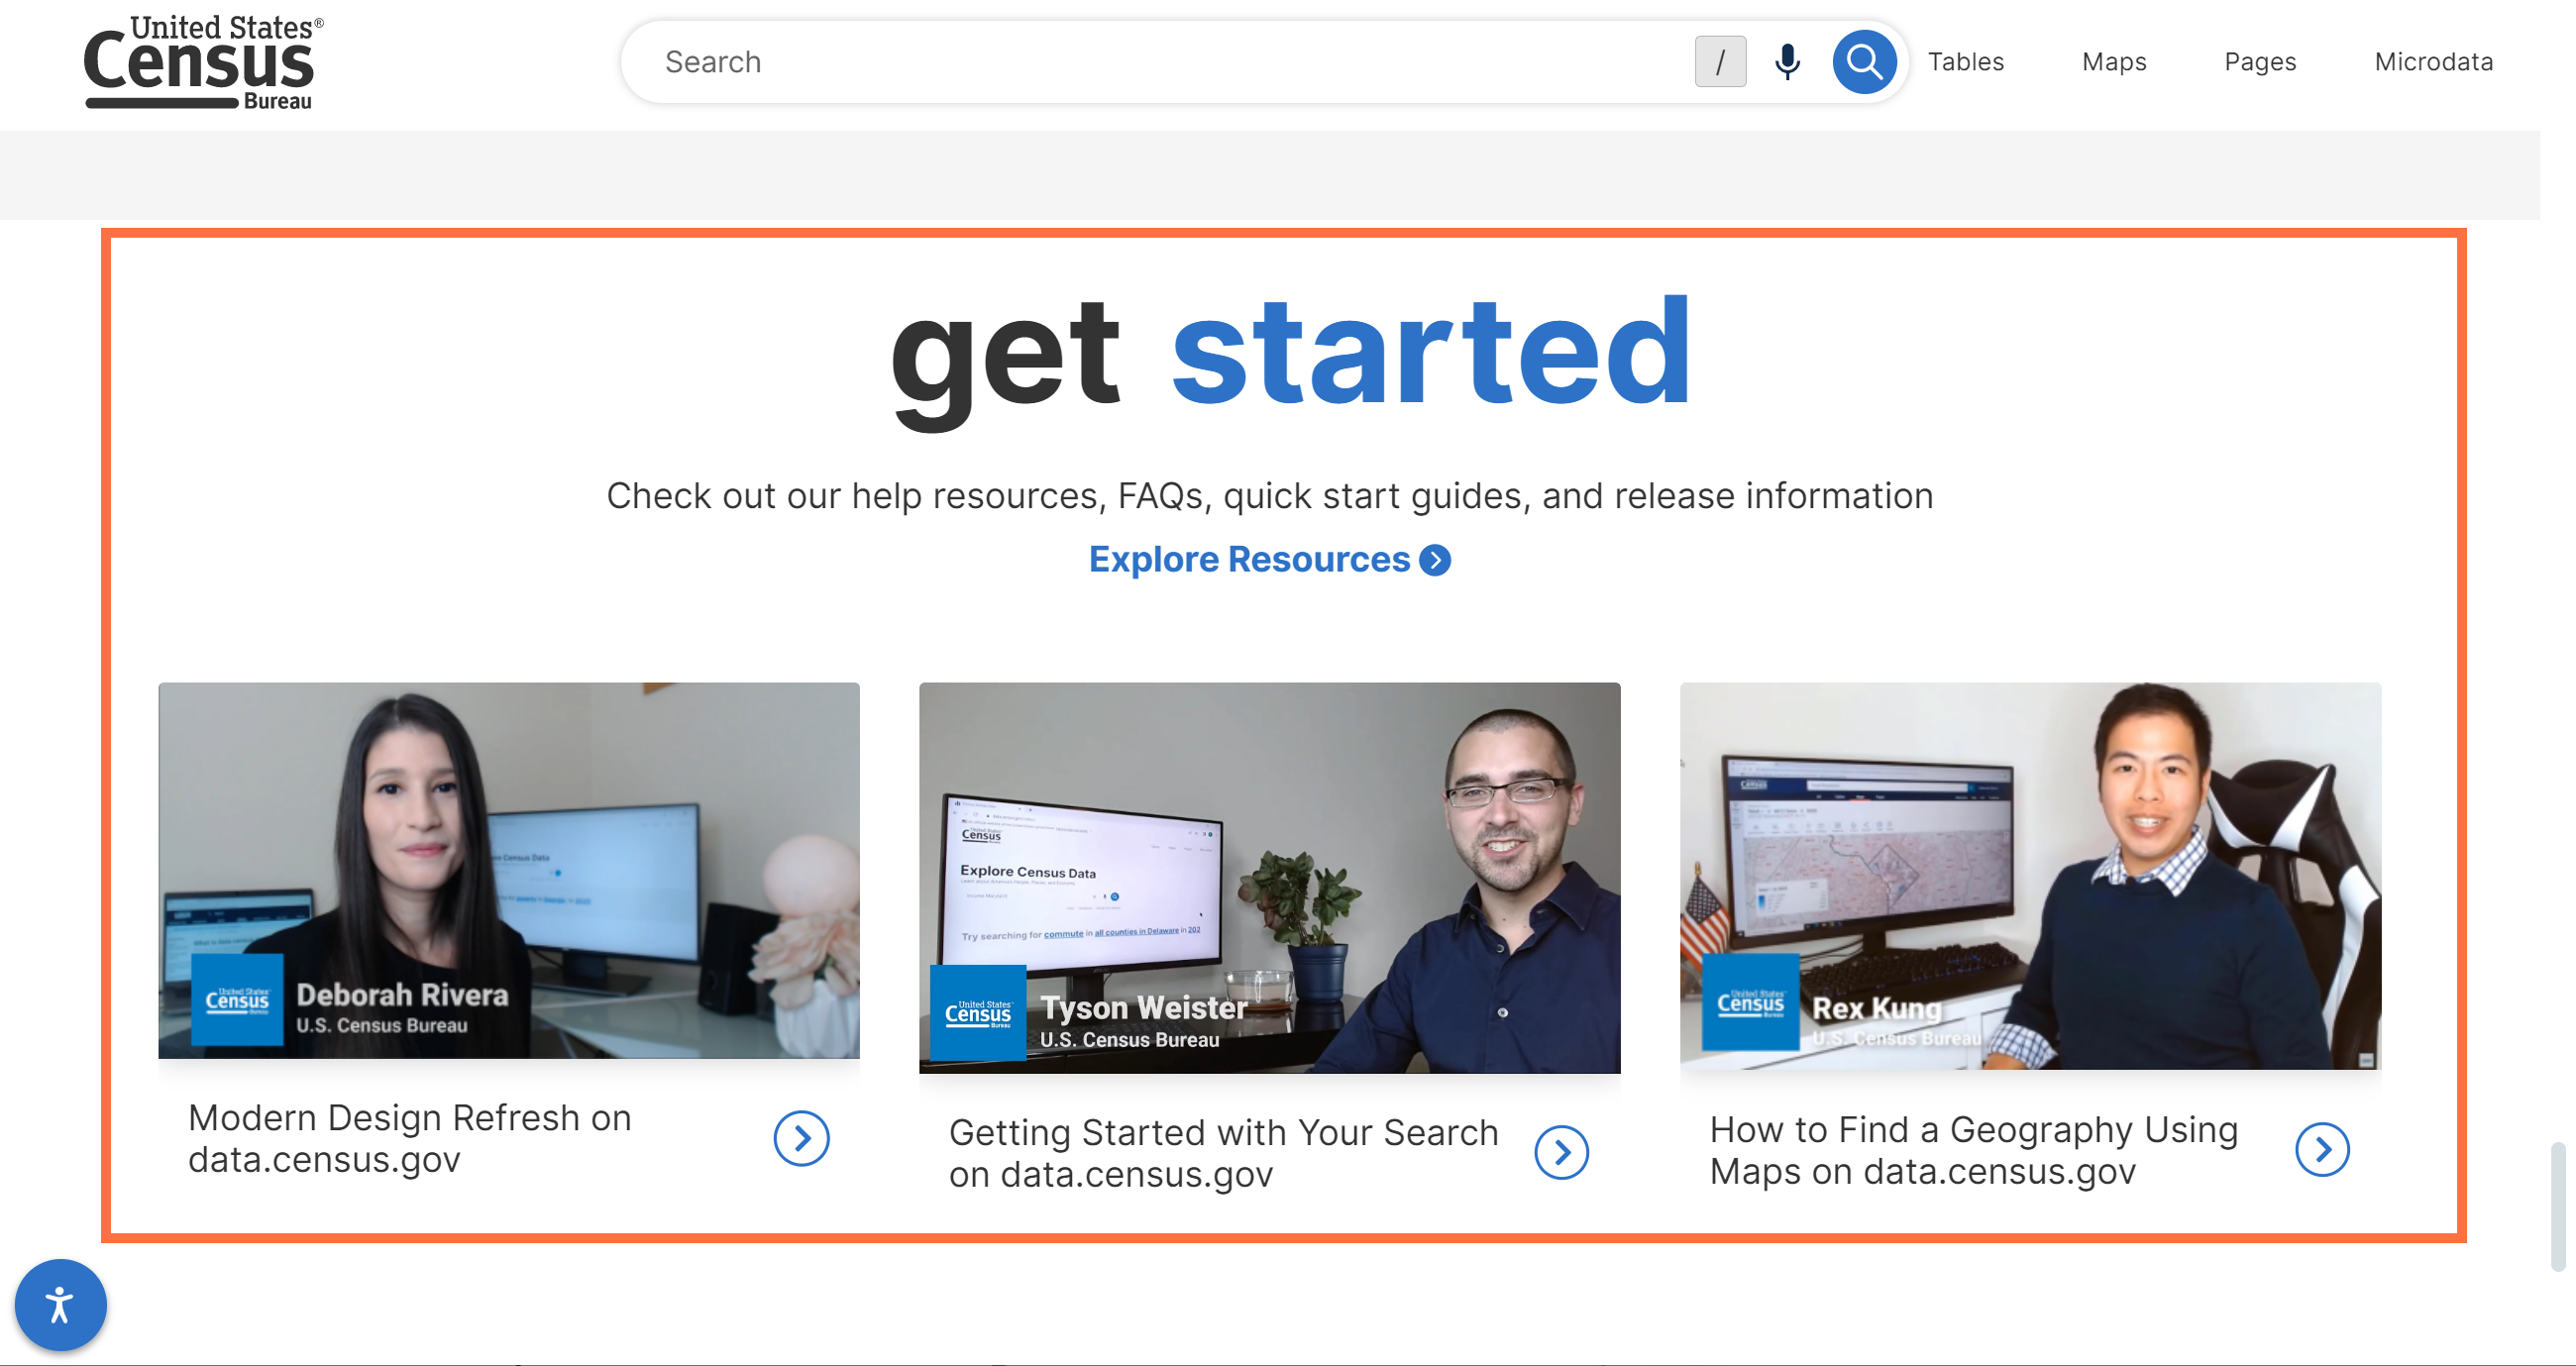
- Improved landing page. With this update, you will be able to access more educational materials on the landing page of data.census.gov, including short videos and links to helpful resources.
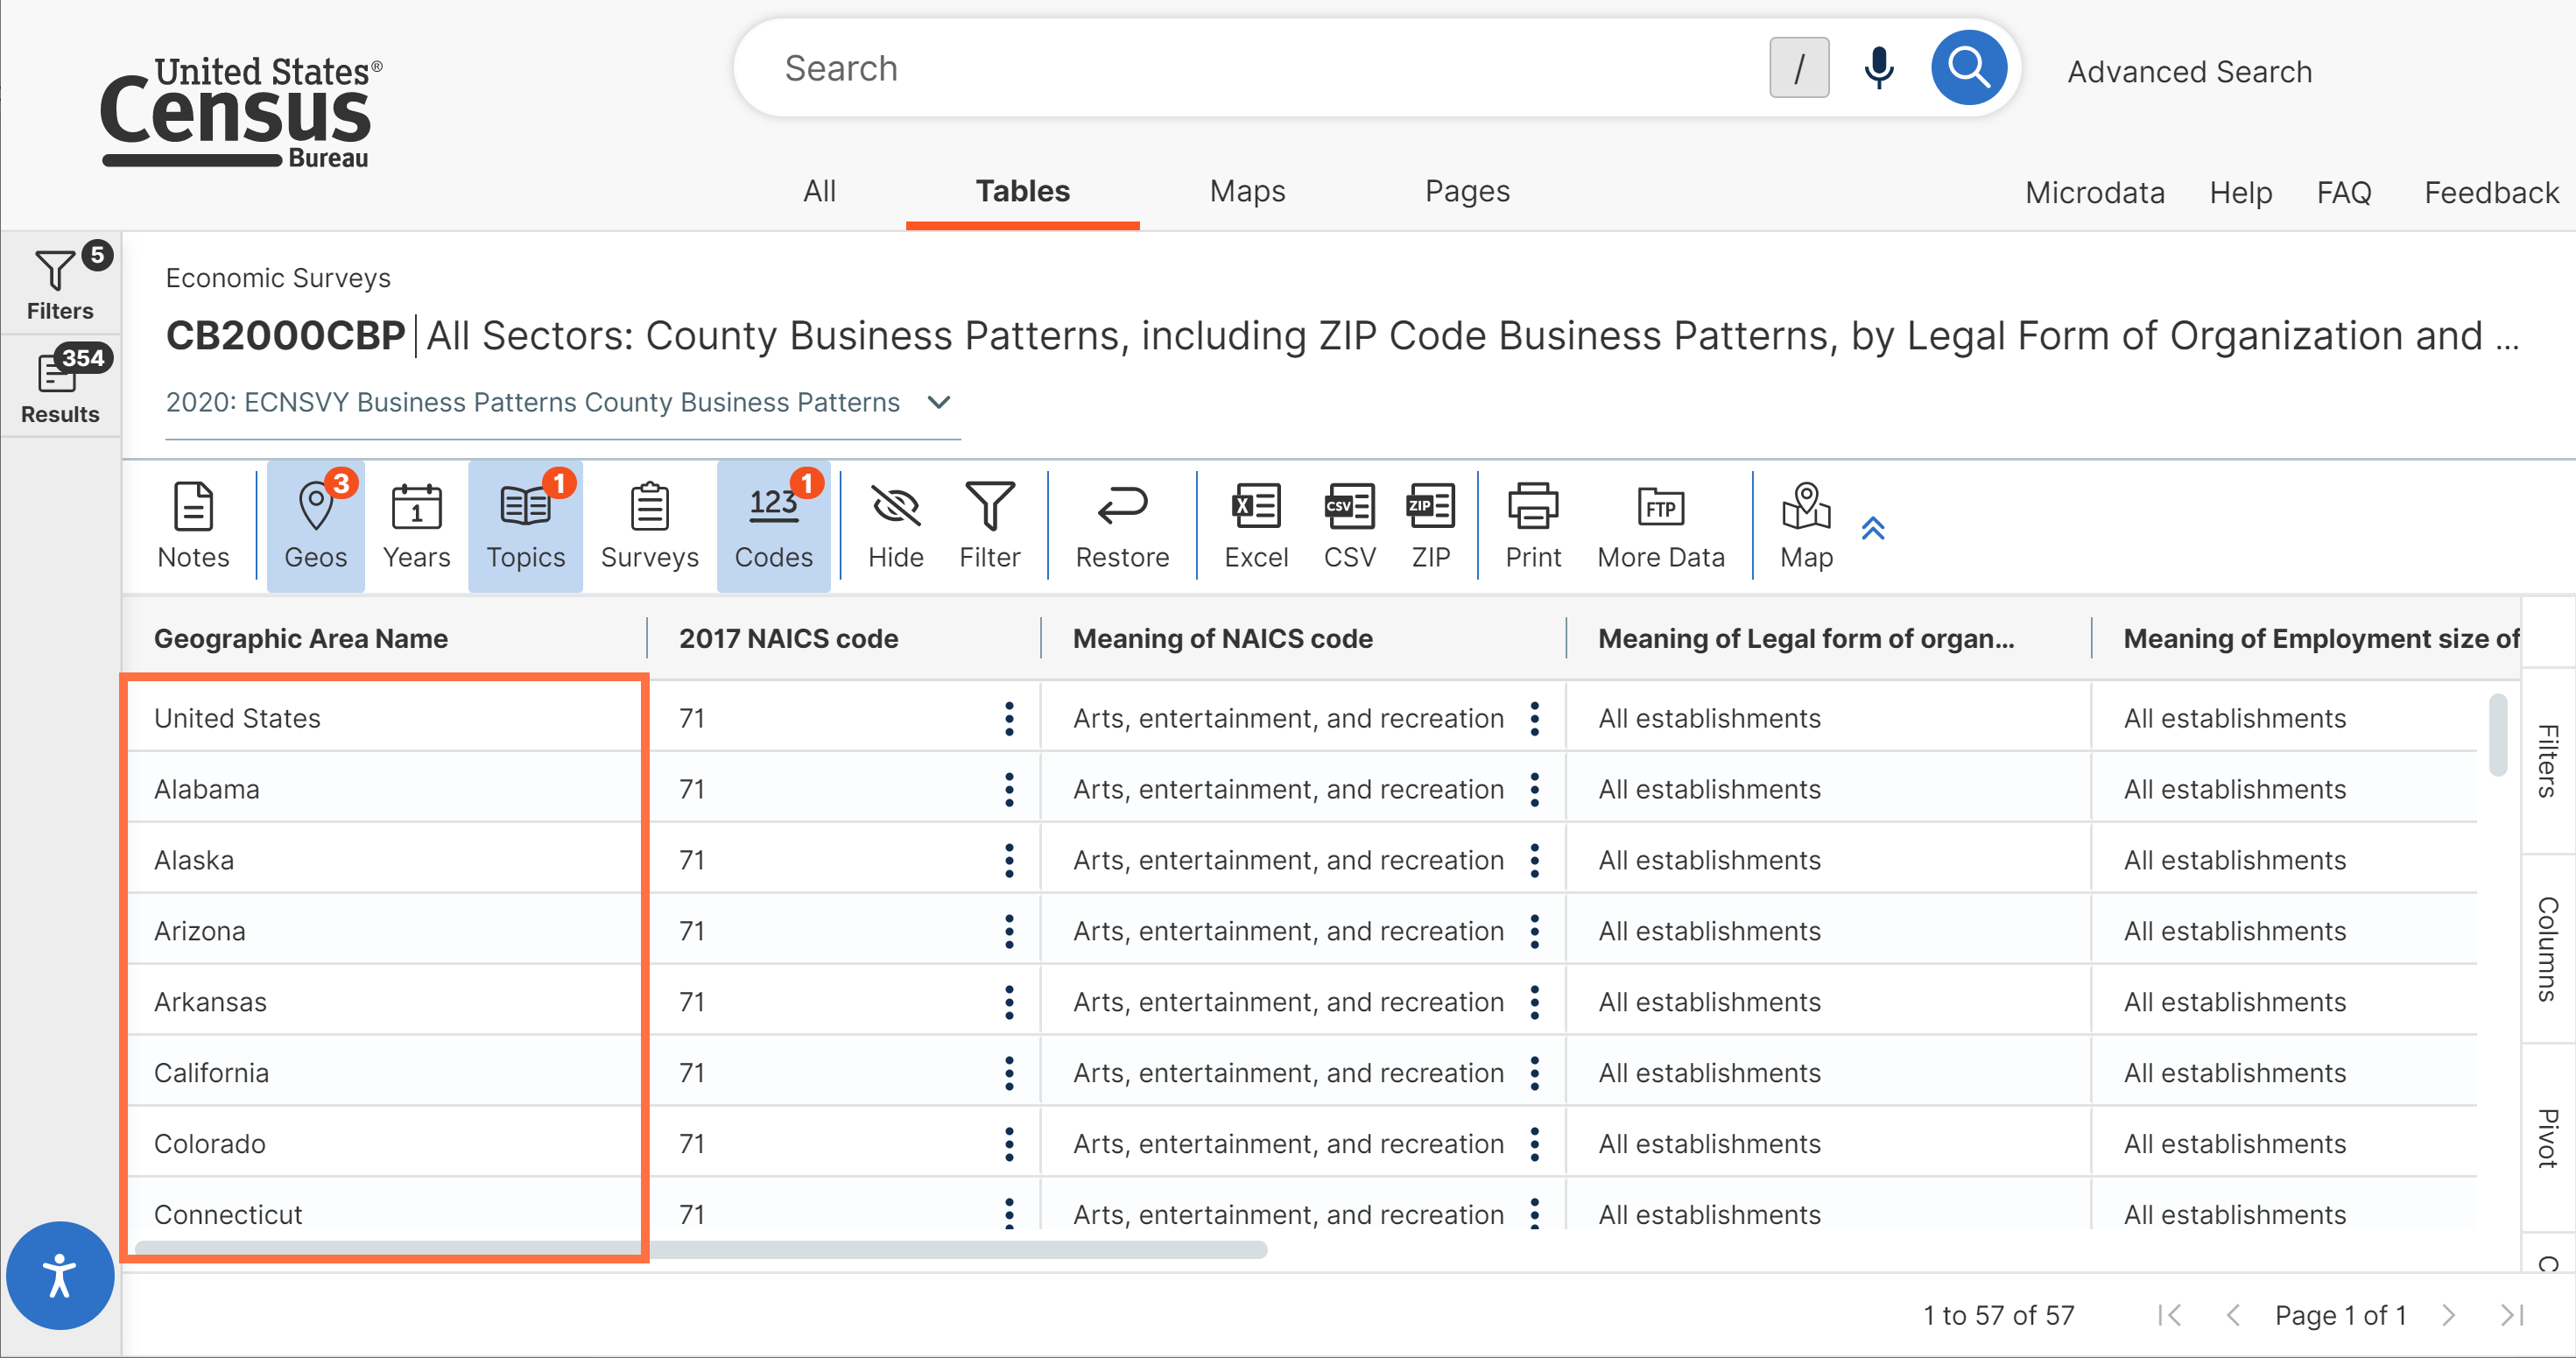
- Improved sorting of geographies in economic data tables. With this update, you will see data for higher-level geographies such as the United States at the top of your table and data for lower-level geographies towards the bottom of the table. This applies to the table display on data.census.gov and the downloaded output.
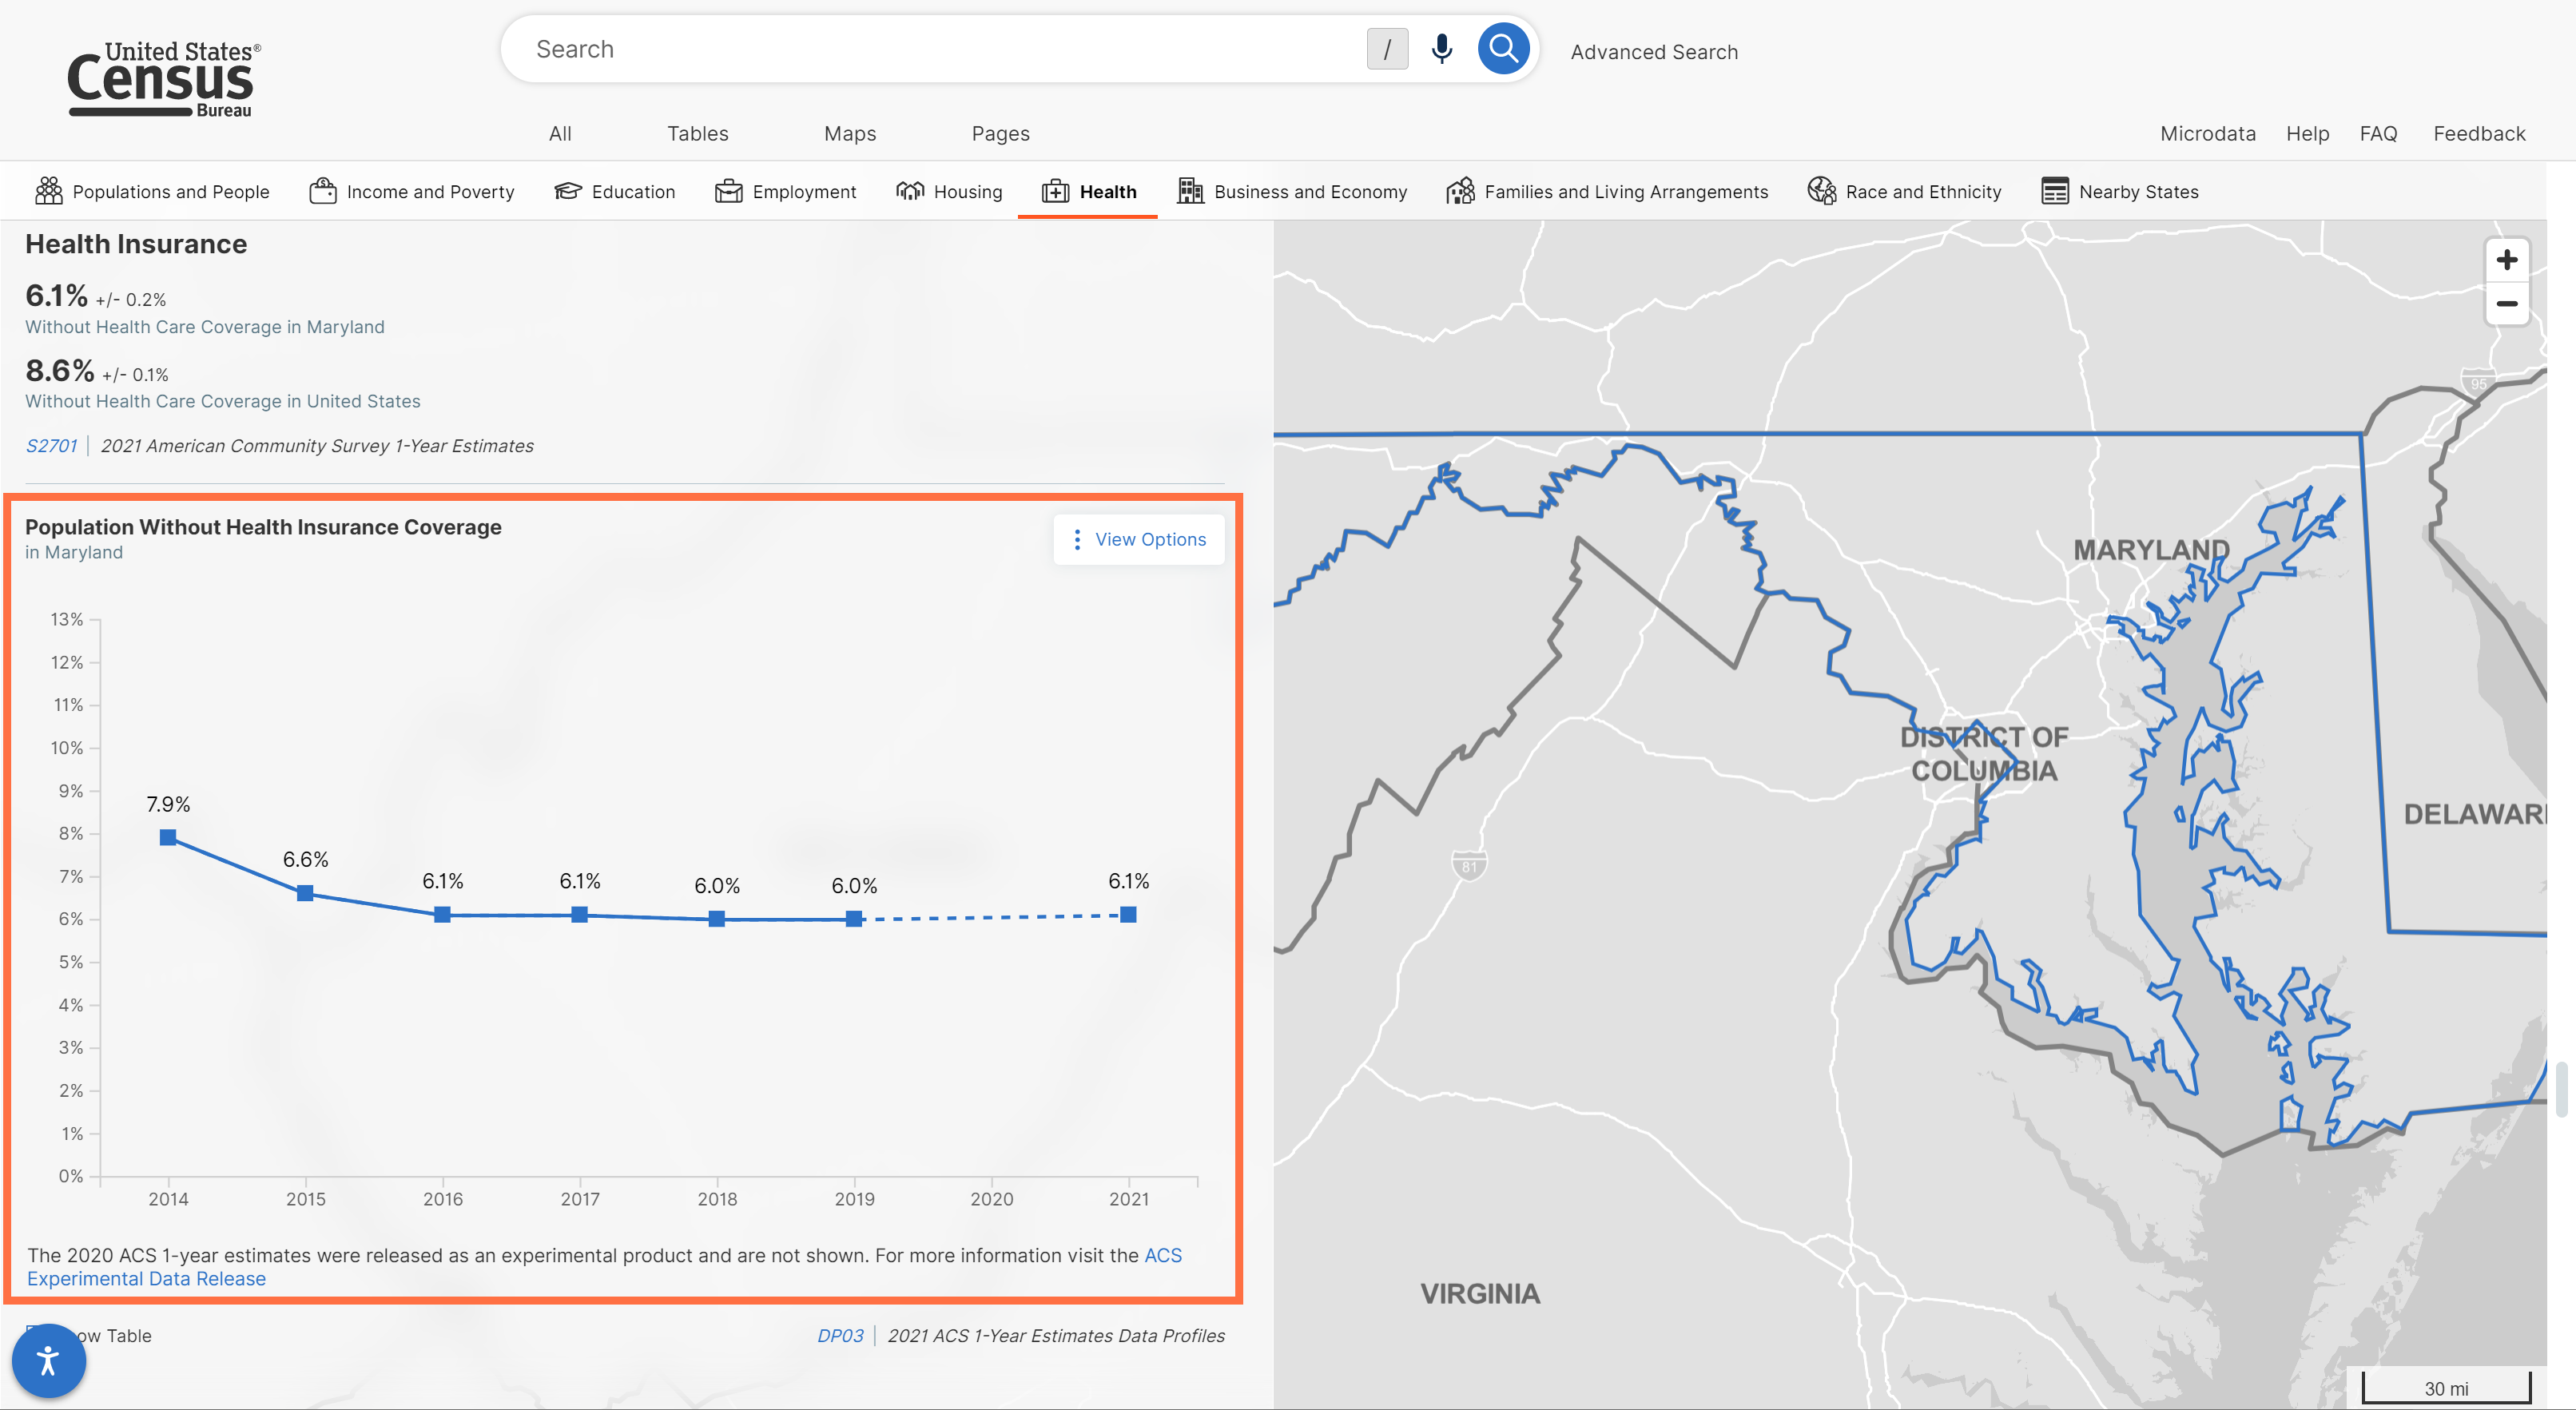
- Enhanced line charts in the profiles. This update was applied to account for data from the 2020 American Community Survey (ACS) 1-year estimates not being shown due to the estimates being released as an experimental product. You will now see a dotted line and brief messaging at the bottom of the line chart to explain this.
- Fixes to 22 defects, including fixes that allow you to:
- Zoom to your selected geography automatically on the maps
- Click check boxes in the Microdata Access Tool (MDAT) that are responsive to your selections
- View data by NAICS codes in Annual Survey of Manufactures data tables
- Select topics using the “Find a Filter” search box in the advanced search