2021
2021
In January, we fixed two Microdata Access defects:
- MDAT - ACS 1-Year and 5-Year Estimates - variables not displaying when filtering by topic (all years prior to 2018).
- Showing the duplicate column value if having two different geographic levels in same table.
In February, we released the following updates to the site:
- New styling for exported tables. The output now includes the Census Bureau logo and universe statement. To make it easier to print the table from Excel, the table data and notes have been separated into two different worksheets.
- Enhanced search in the “pages” section of data.census.gov. You will now see improved relevancy and descriptions of search results.
- 30 defect resolutions, including a fix where links to saved searches show the first table result automatically without requiring you to click on the table. Fixes also help you more accurately specify desired geographies using the geography filters and single search bar.
In April, we released the following updates to the site:
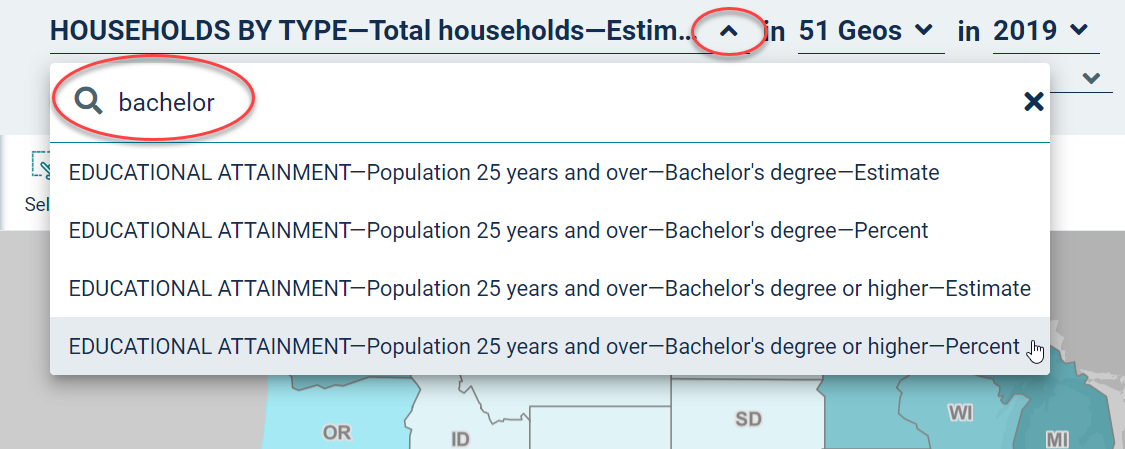
- New mapping functionality allows you to search within the data variable drop-down menu as an alternative to scrolling through a long list of complex variable labels.
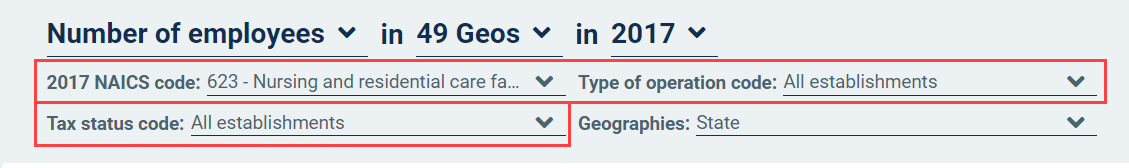
- Maps of economic data – For the first time, data.census.gov now supports the ability to map data from economic surveys and programs. This is made possible by the addition of new drop-down menus at the top of the maps that allow you to fully specify the desired data value. These new drop-down menus are for non-key dimensions such as NAICS or tax status code.
- Ability to generate links to filtered views of economic tables when applying custom filters to selected columns in the table display. Previously, users could only link to filtered views of these tables by adding non-key dimensions manually in the URL. Learn more about how non-key dimensions appear in the URL in the FAQ: How do I save my results or search?
- Removed misleading data year labels at the top of Business Dynamics Statistics tables. This update helps clarify that these tables are from a timeseries dataset that provides data for all available years in one table view.
- 126 defect resolutions, including fixes that allow you to:
- View data for your selected “in-combination” race groups
- Deselect geographies by clicking on them in the selection map
- Export tables to Excel that reflect the customizations you made in the table display
- Download tables in the correct file format in Firefox
- Download the correct decennial census table in instances where different datasets share the same table ID
- Navigate to “Search,” “Close,” and “Clear Geographies” buttons even after selecting a large number of geographies
- See notifications in the Microdata Access when geography vintages have changed over time and may not be comparable between data years
- Switch seamlessly between tables and maps in a single click without encountering a non-responsive navigation bug
- Encounter fewer issues when using the browser’s back button within data.census.gov (please use the navigation options within data.census.gov for best performance)
- Experience a more accessible site as we continue work towards compliance with Section 508 standards
In May, we released the following updates to the site:
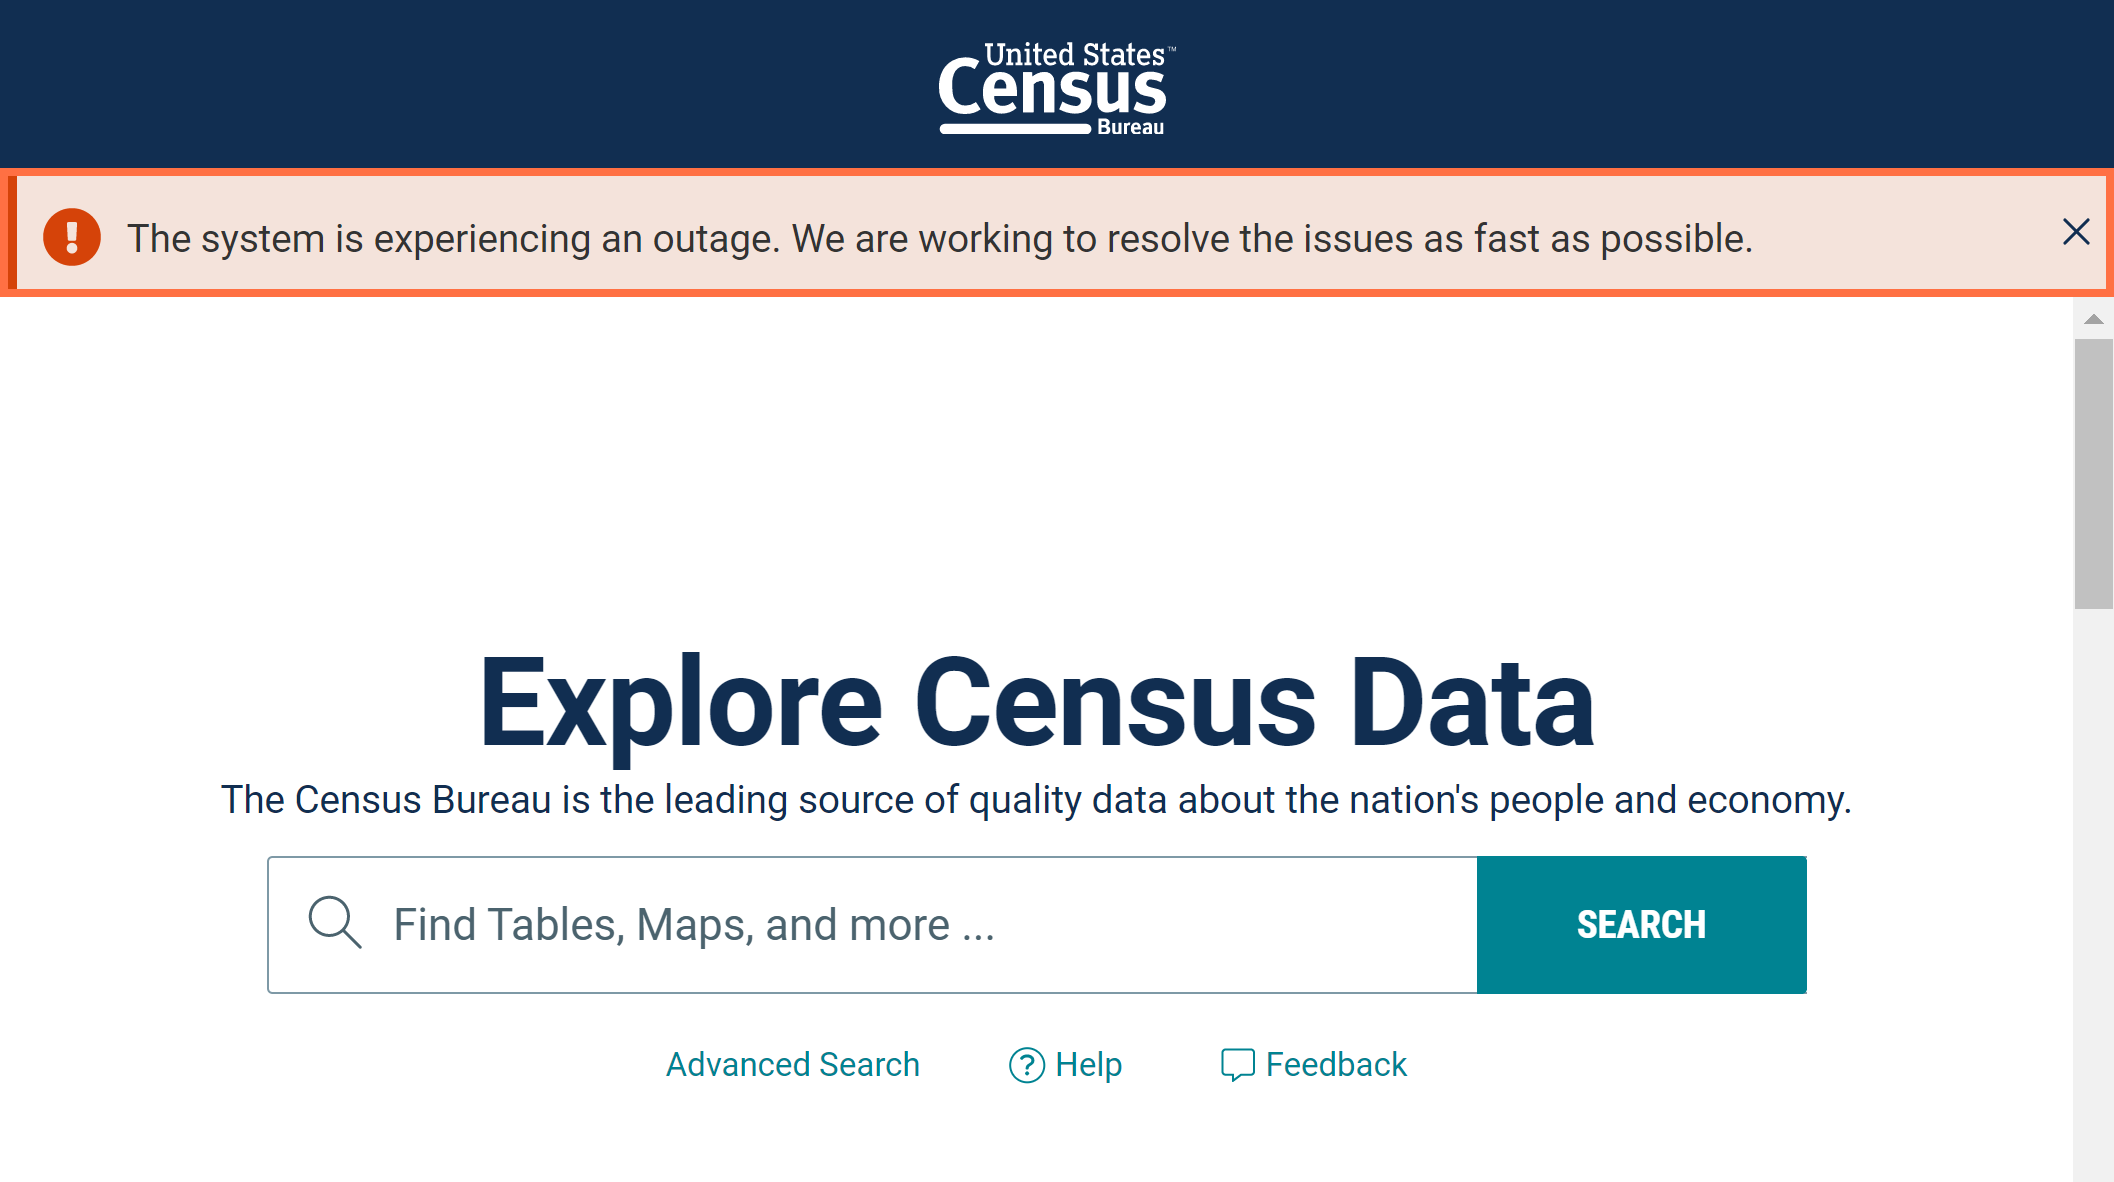
- New functionality allows banners to appear at the top of the page when we need to alert you about key updates or major notifications.
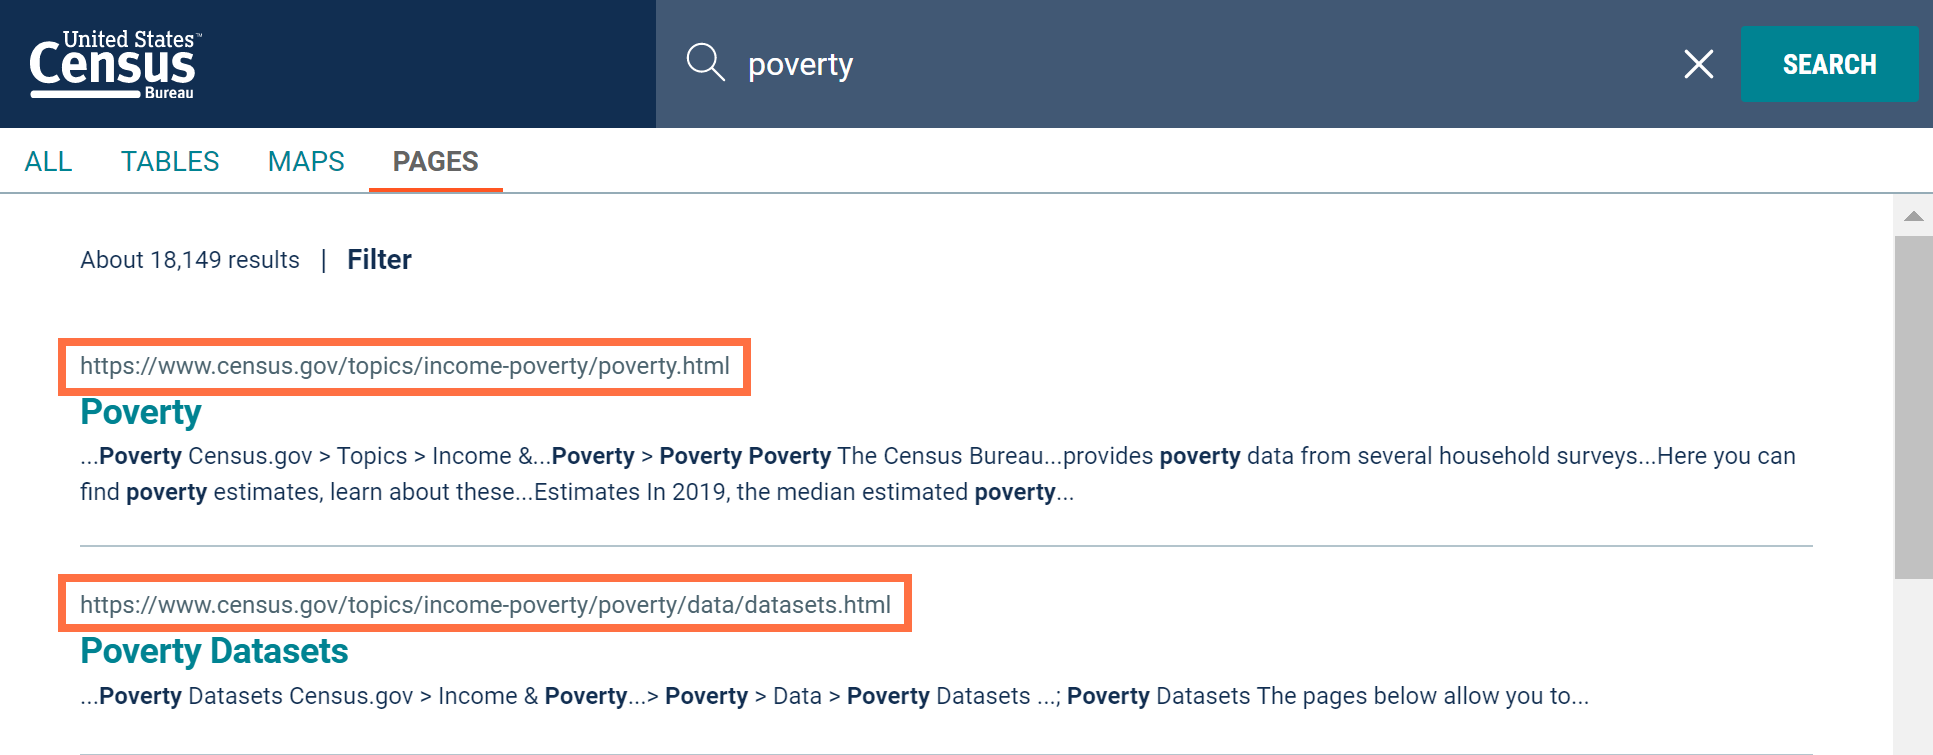
- Improved details after running searches in the “Pages” tab of data.census.gov. You will now see the URL for each search result to provide more information that will help you determine if you want to click on that search result.
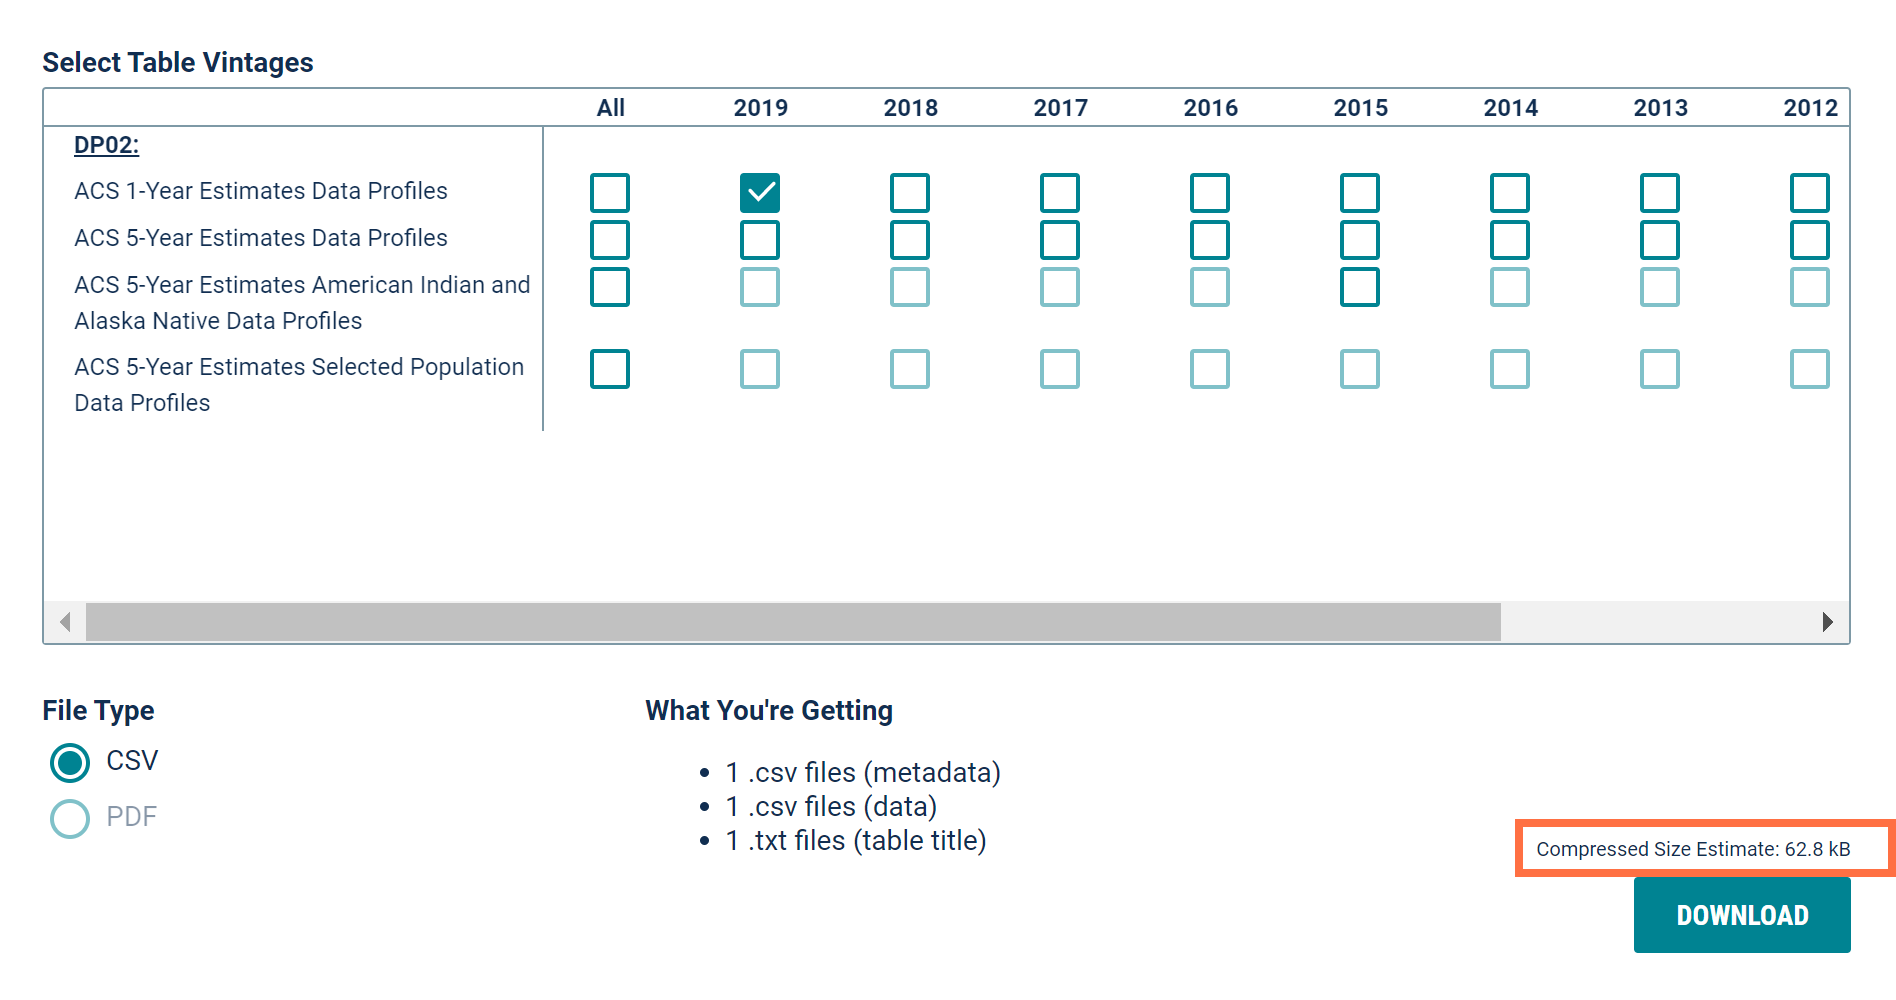
- Improved details for download size. The site now displays the approximate compressed file size before you download your desired tables.
- Enhancements to the Geography Profiles including:
- New featured estimates at the top of the page
- Improved labeling for percentages, dollar values, and data sources
- Complete loading of the profile from the beginning, allowing you to scroll through it and view results more quickly
- Updated links to widgets for each chart and map
- 30 defect resolutions including fixes that allow you to:
- View filters on the appropriate screens without them being covered up by an oversized search bar
- Remove filters by clicking the “X” next to them
- Use special characters when searching within geography panels
- Transpose tables correctly
- Run decennial census API queries that have more than a few variables
- Experience a more accessible site as we continue work towards compliance with Section 508 standards
In June, we released the following updates to the site:
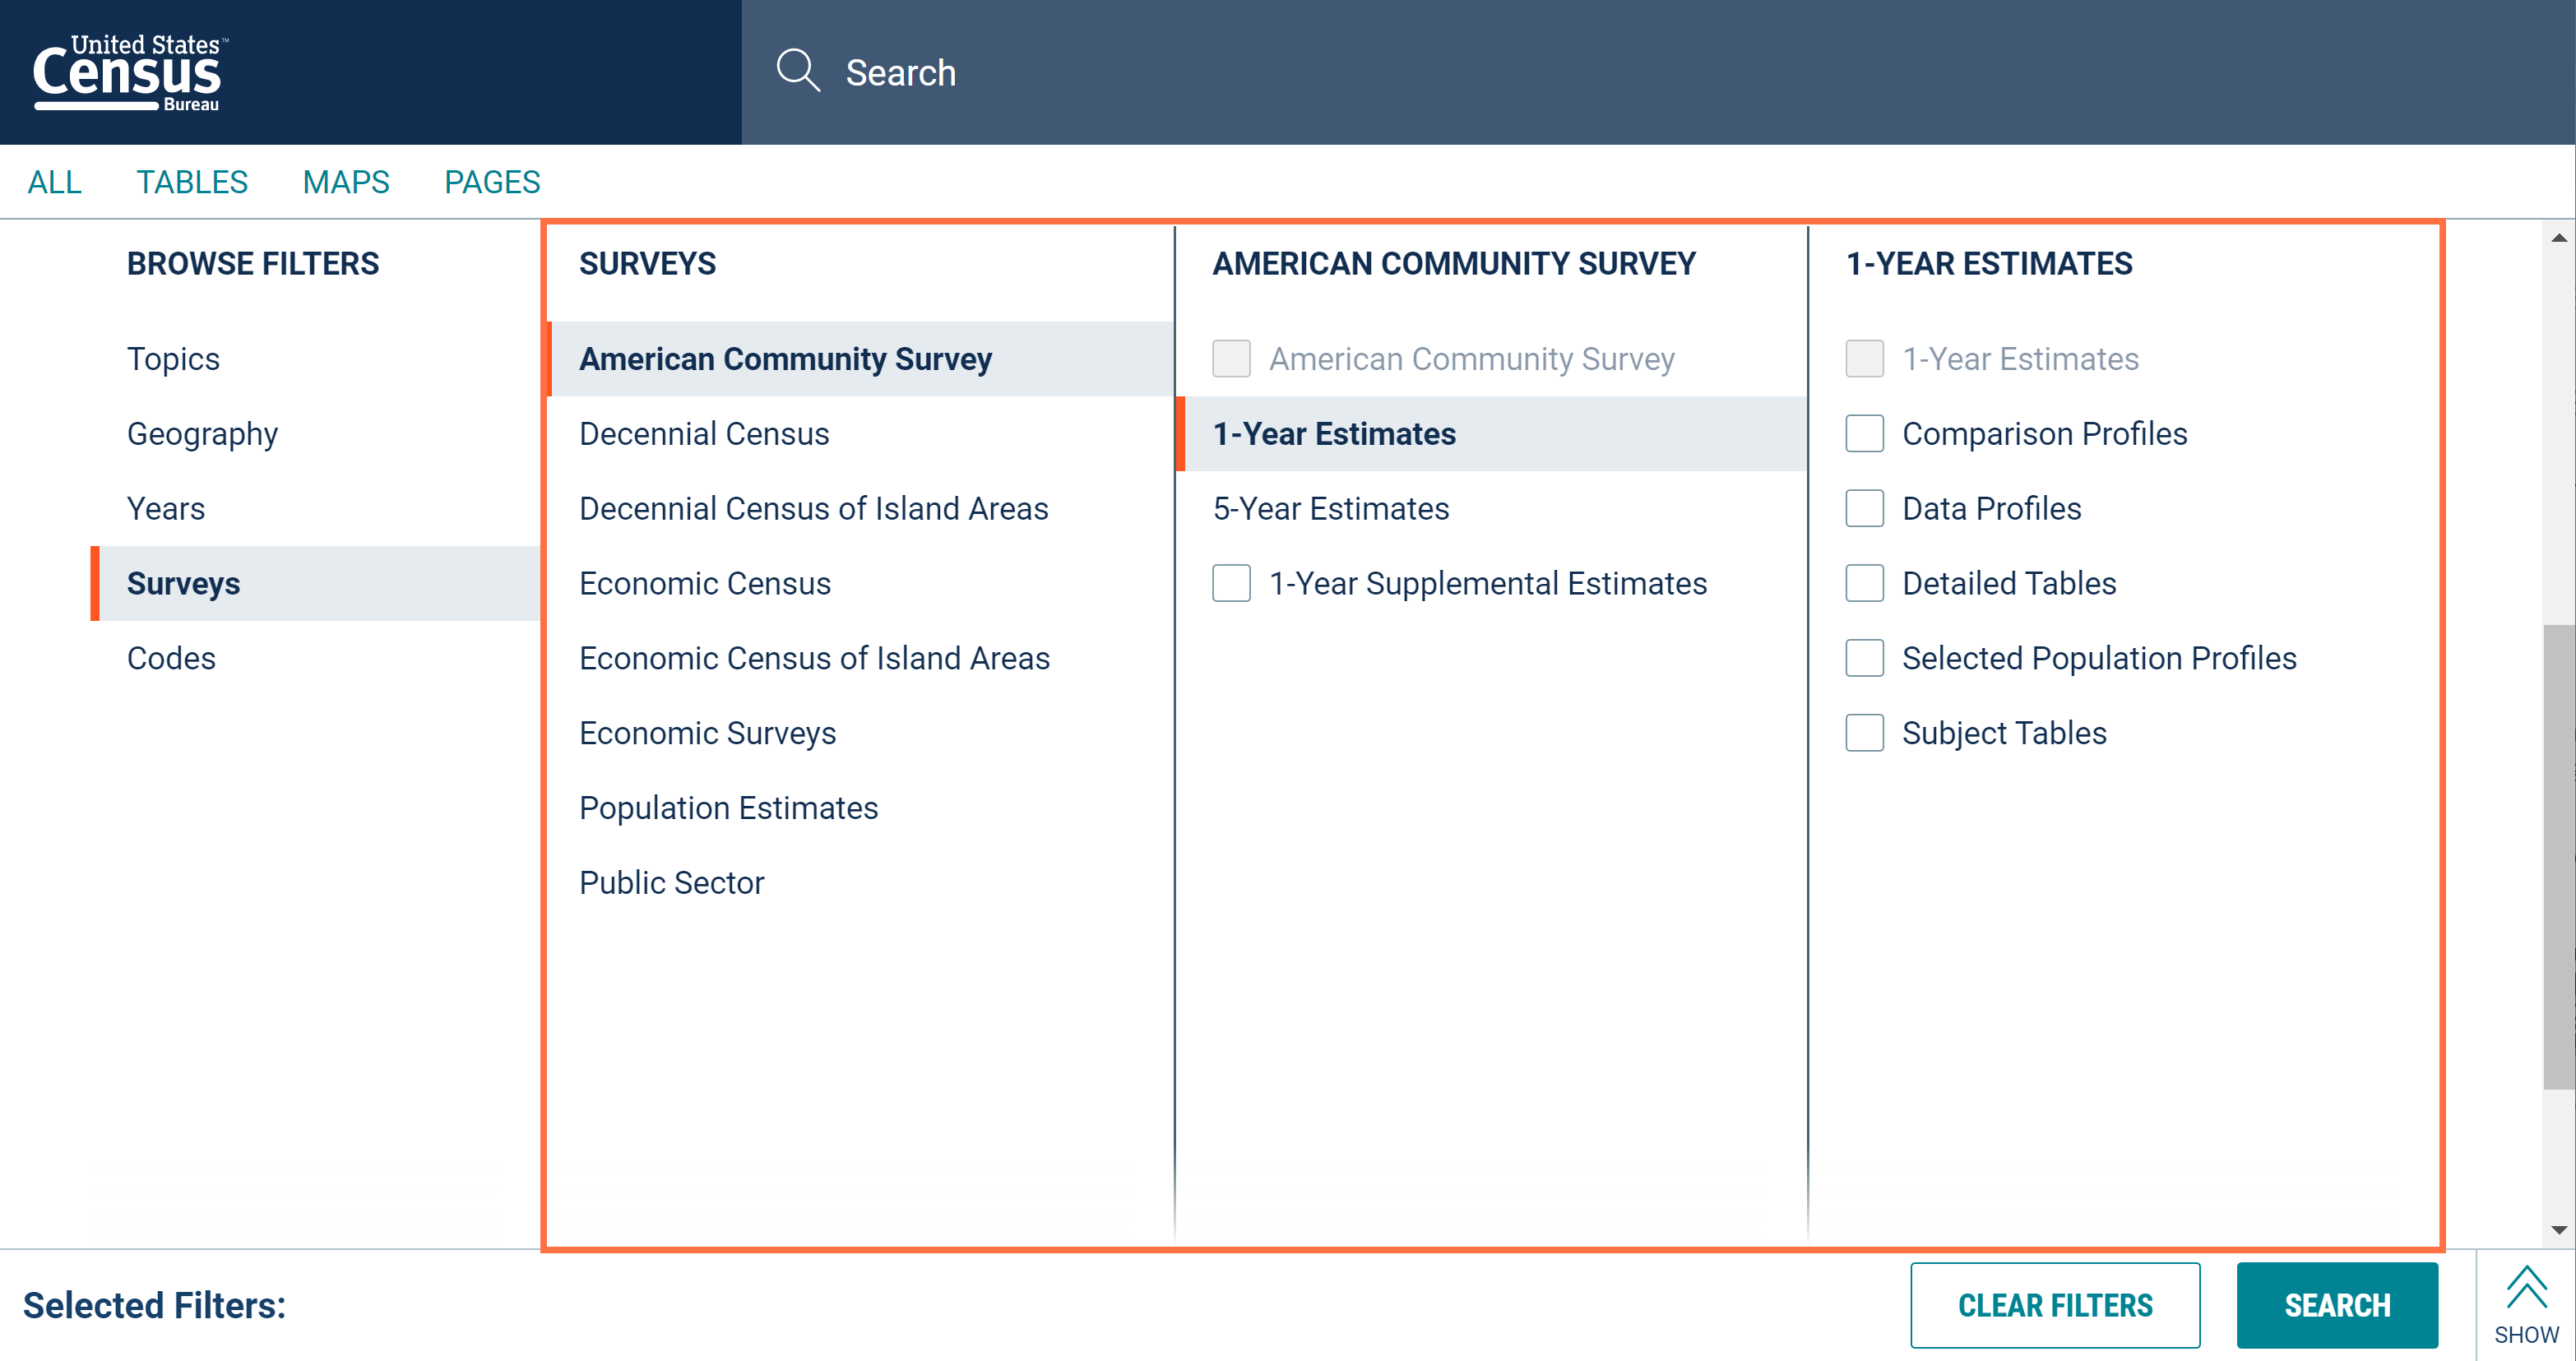
- New redesign of the “Surveys” filter panel to make it easier to select a survey or program. You will now find the pre-existing detailed survey options organized within new survey categories. These high-level categories are easy to recognize and navigate through when selecting a survey, and no longer require you to scroll through a long list containing all 170 options in one view.
NOTE: With this redesign of the “Surveys” filter panel, links to some surveys have changed. This means that data.census.gov links created before 6/10/21 will no longer provide table or map results for the following surveys if those links included a dataset parameter, the part of the URL that begins with &d=
o Economic surveys and programs – All datasets
o American Community Survey (ACS) 1-Year Supplemental Estimates
o Decennial Census of Island Areas – All Island Areas datasets
Please update any previously saved links to the new URL naming convention for these surveys.
- 32 defect resolutions, including fixes that allow you to:
- Maintain your table selection after adding a geography in the “Customize Table” view
- View data for your selected geographies when loading links to saved tables
- Access all available data tables when searching for ZIP Code Tabulation Areas (ZCTAs) using the single search bar
- Browse the full list of table results by clicking the “Load More” button without experiencing intermittent non-responsiveness
- View results that better match your search terms
In July, we released the following updates to the site:
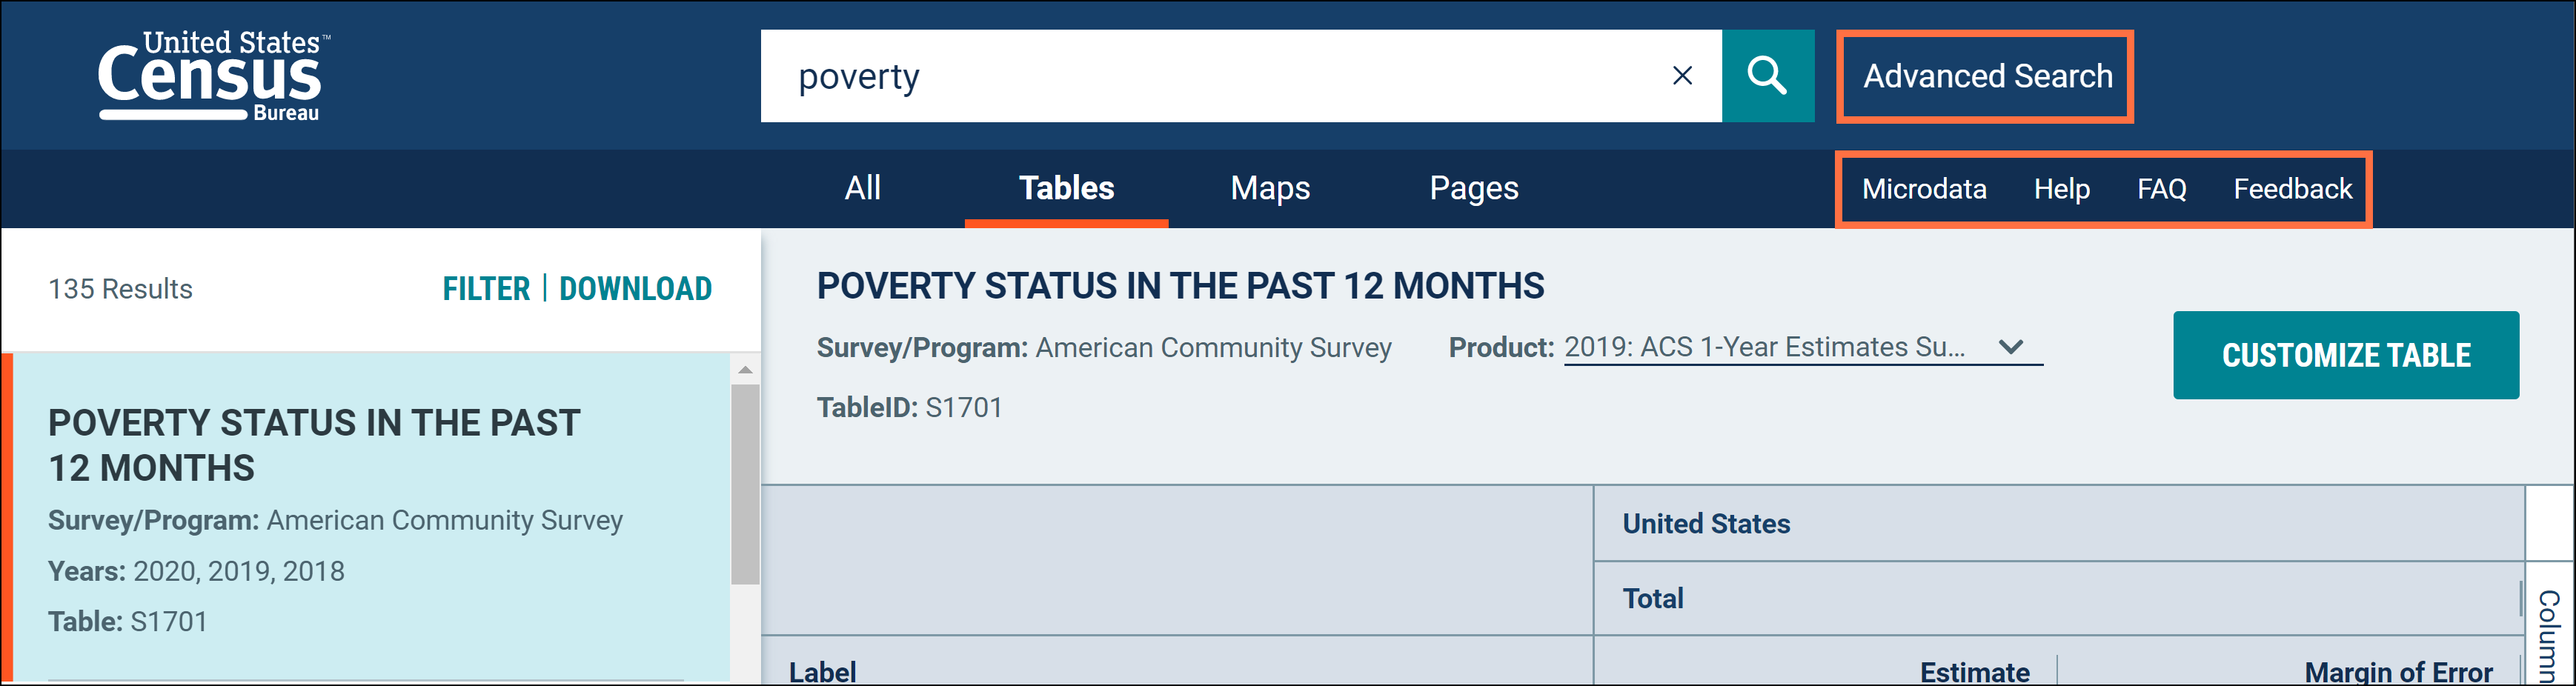
- Improved header, including new links to Advanced Search, Microdata, Help, FAQ, and Feedback. These links make it easier for you to navigate the site and access educational resources at the click of a button. The header is also optimized for mobile view and now contains links that allow you to drill into tables, maps, or webpages directly from the landing page.
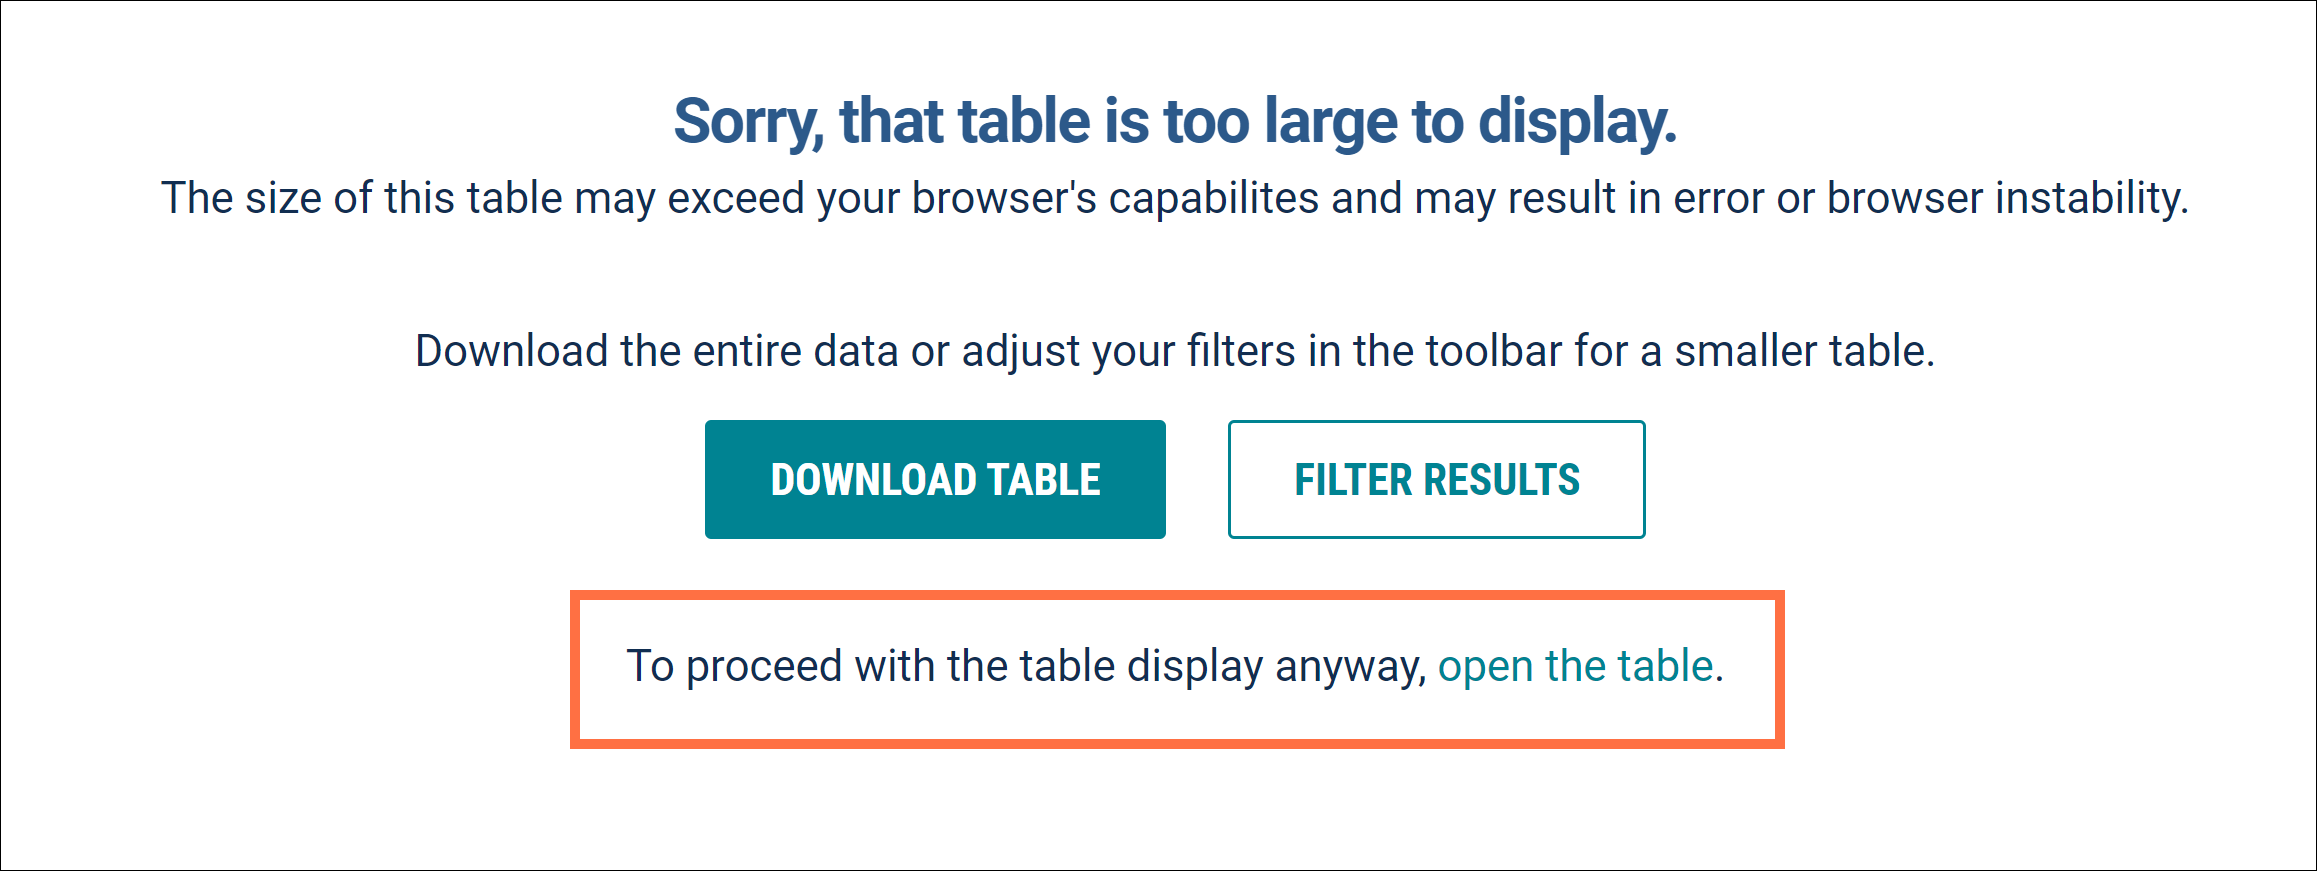
- A new option allows you to try to load tables were previously too large to display on screen. Specifically, this includes any table that has more than 1,000 columns, 2.5 million cells, or tables that have an uncompressed download file size of at least 4mb, such as B01003 for all counties.
With this release you will notice new messaging, including a link that gives you the option to try to open these large tables at the risk of experiencing long load times or browser instability.
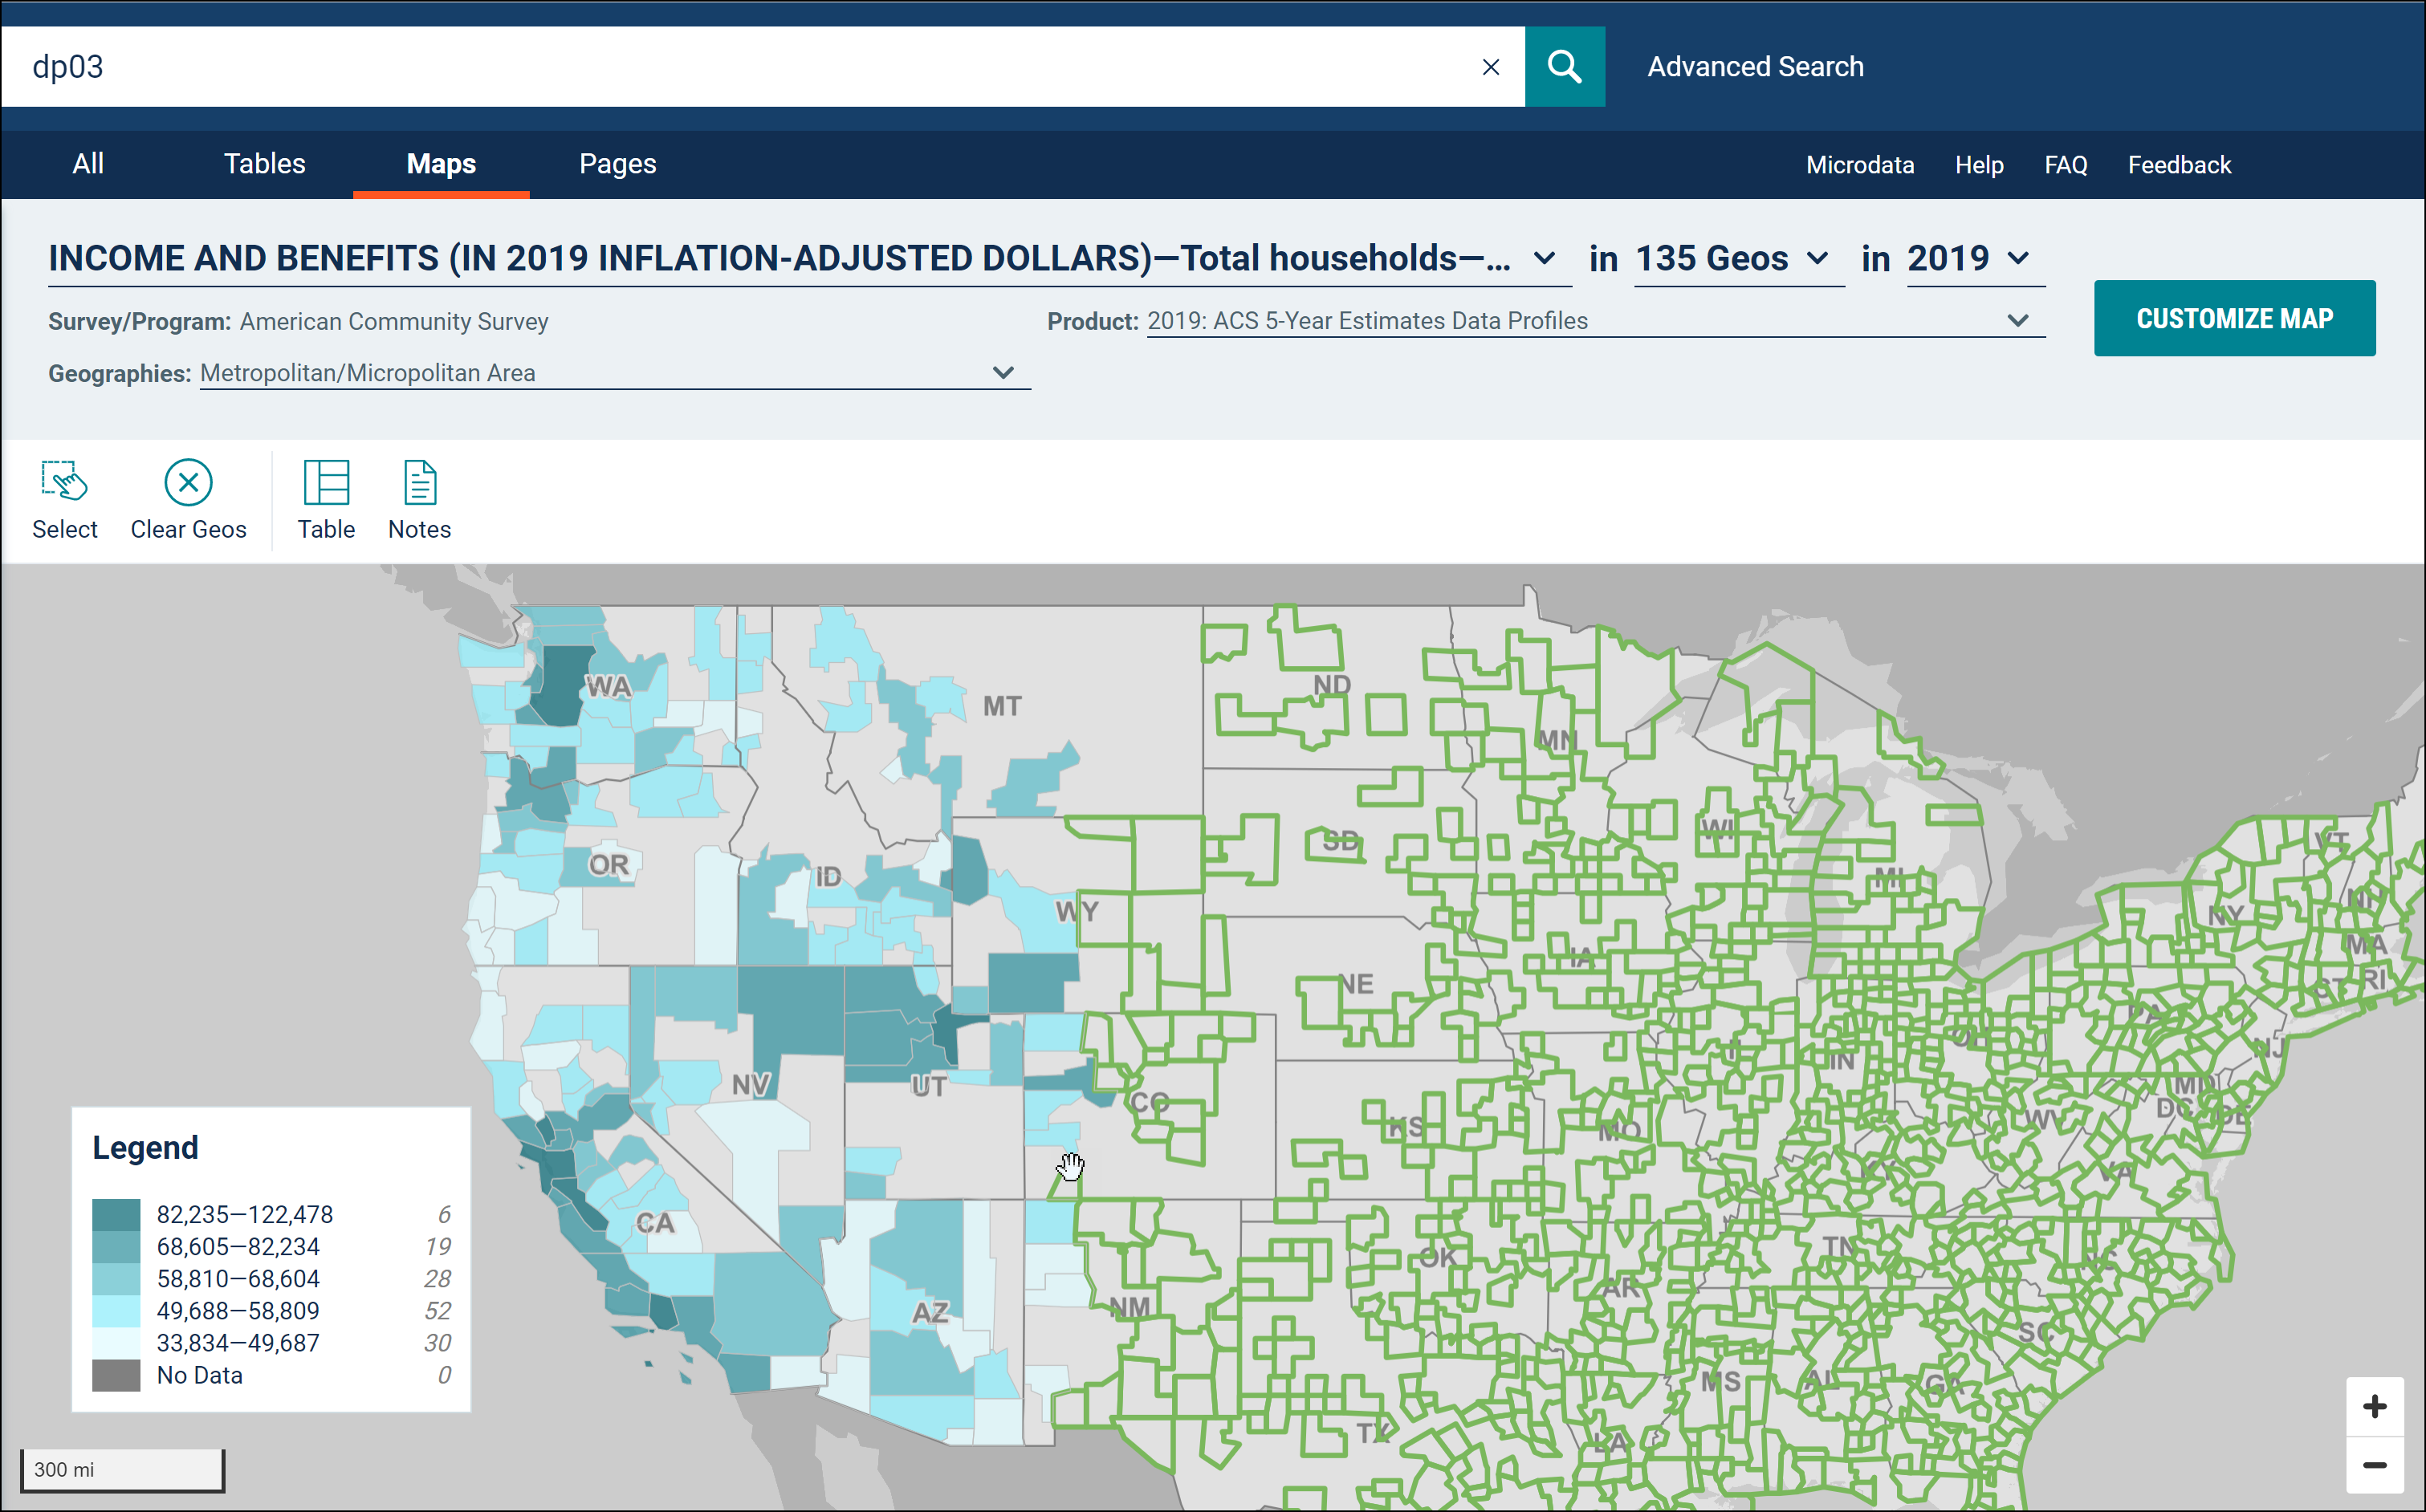
- Thinner lines are now used for many types of geographies when you select them and create a thematic map. This update makes it easier to visualize data and see differences in values between geographies after you have created a map.
For example, consider the map below which shows median household income for certain metropolitan and micropolitan statistical areas in the Western United States. As you can see in the map, the selected metropolitan areas on the left are distinguished by thin gray lines rather than by the thick green lines that are provided by default. This helps you more easily see the differences in median household income between each metropolitan area.
- Ability to access the microdata application programming interface (API) through the API Discovery Tool, and a new Microdata API User Guide to help you learn how to use it.
- 31 defect resolutions, including fixes that allow you to:
- Search numerical values within geography panels for ZIP Codes/ZCTAs or census tracts
- Download the vintage of data you are currently viewing without having to de-select all other available years of the table
- Make selections in the list of table results that properly carry over to download menus
- View boundaries that were previously missing for certain geographic areas in the maps, such as metropolitan statistical areas
- Search within the data variable drop-down menu when creating a map
- Find more table IDs in the typeahead search results
In August, we released the following updates to the site:
- New banner to clarify that the first 2020 Census data release on data.census.gov will be available by the end of September. Some data are now available through the FTP site.

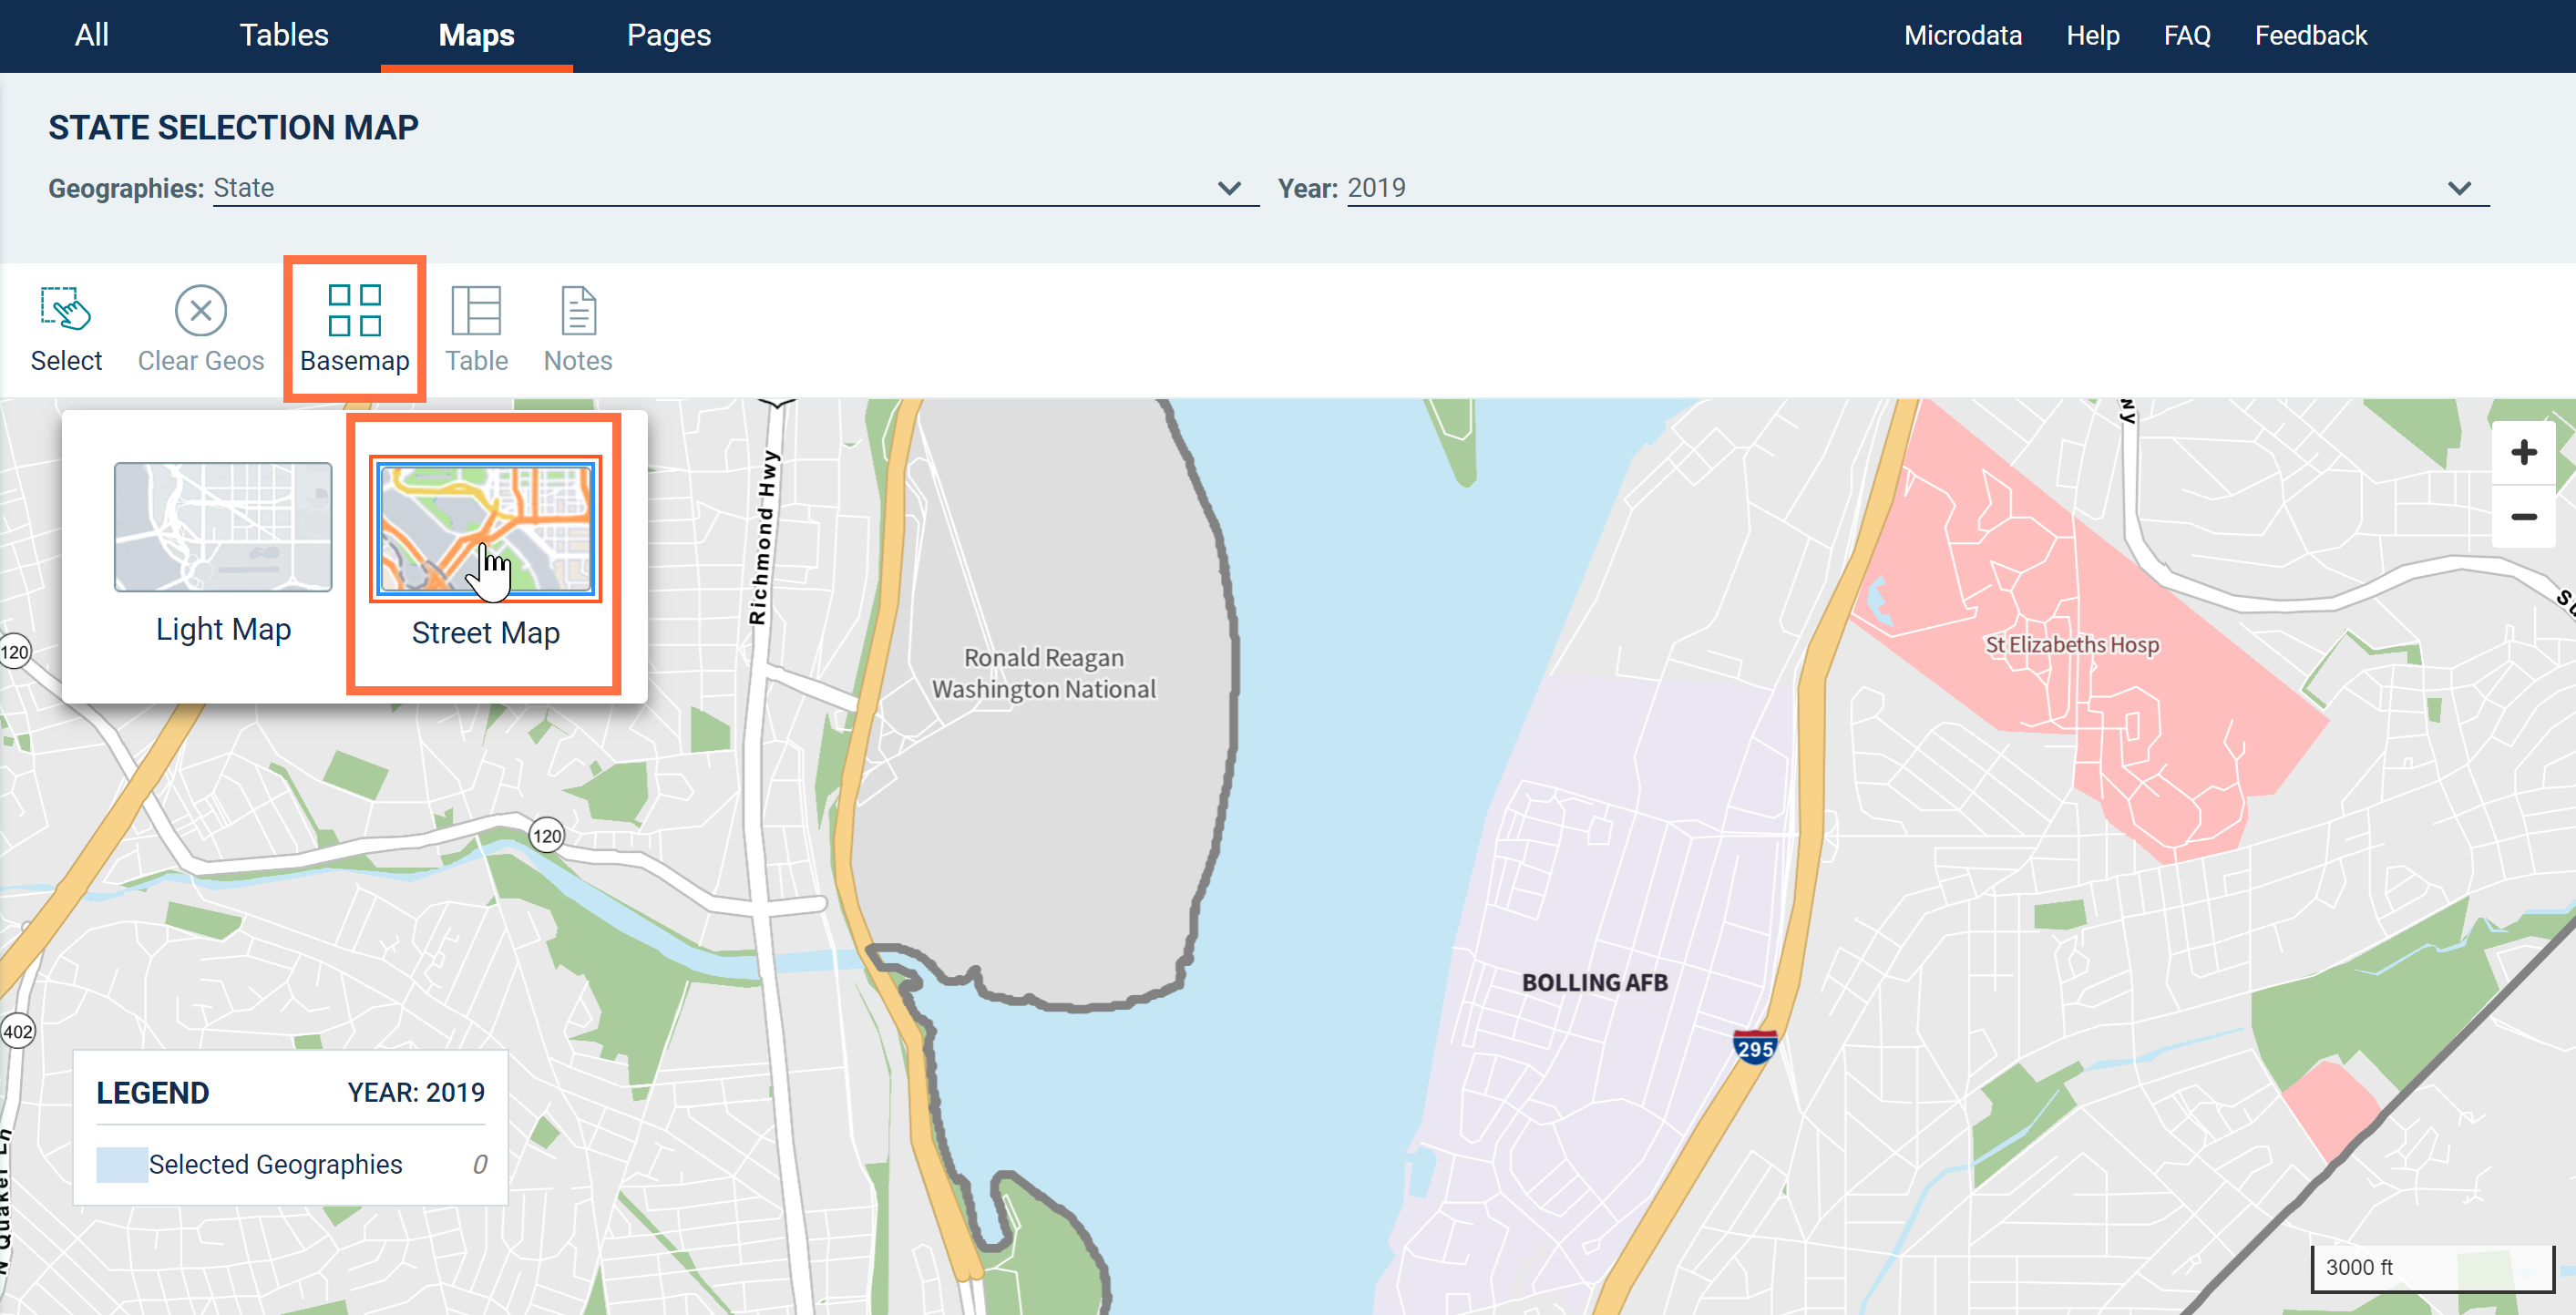
- New option allows you to view the primary base map in color, and see additional features for parks, hospitals, colleges, airports, and military installations.
To check out this new feature in the Selection Map, click the “Basemap” button at the top of the map and choose “Street Map.”
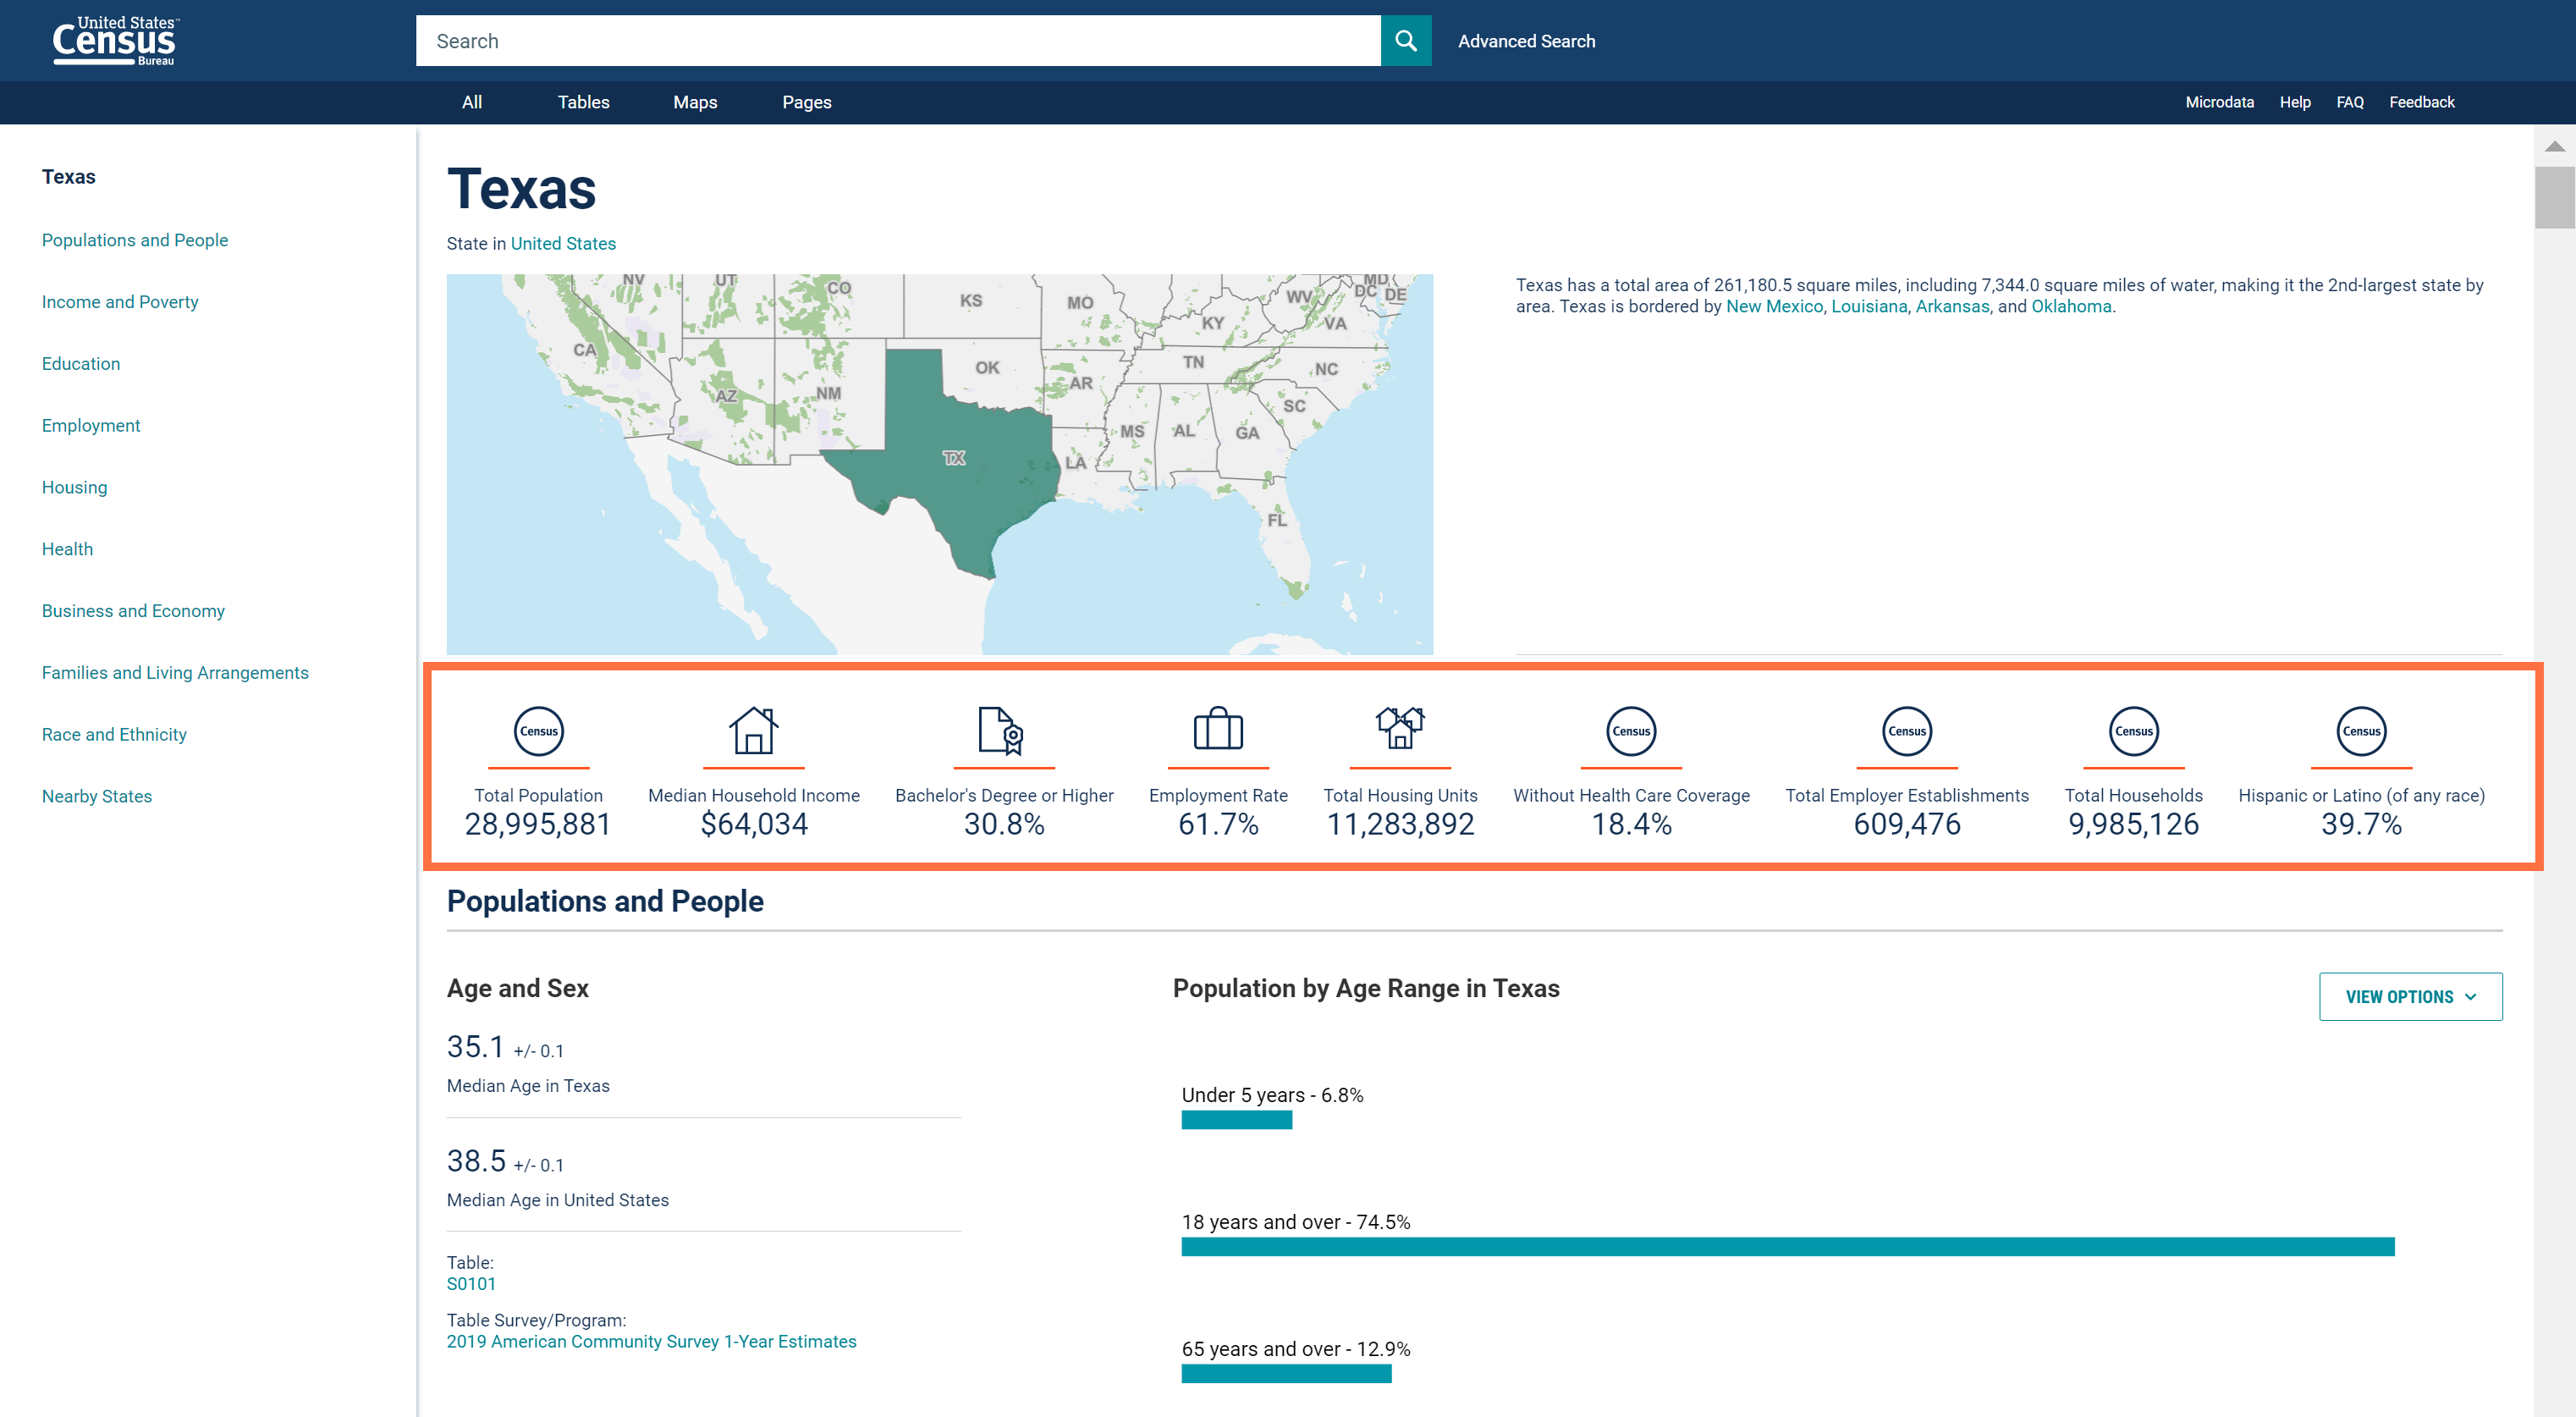
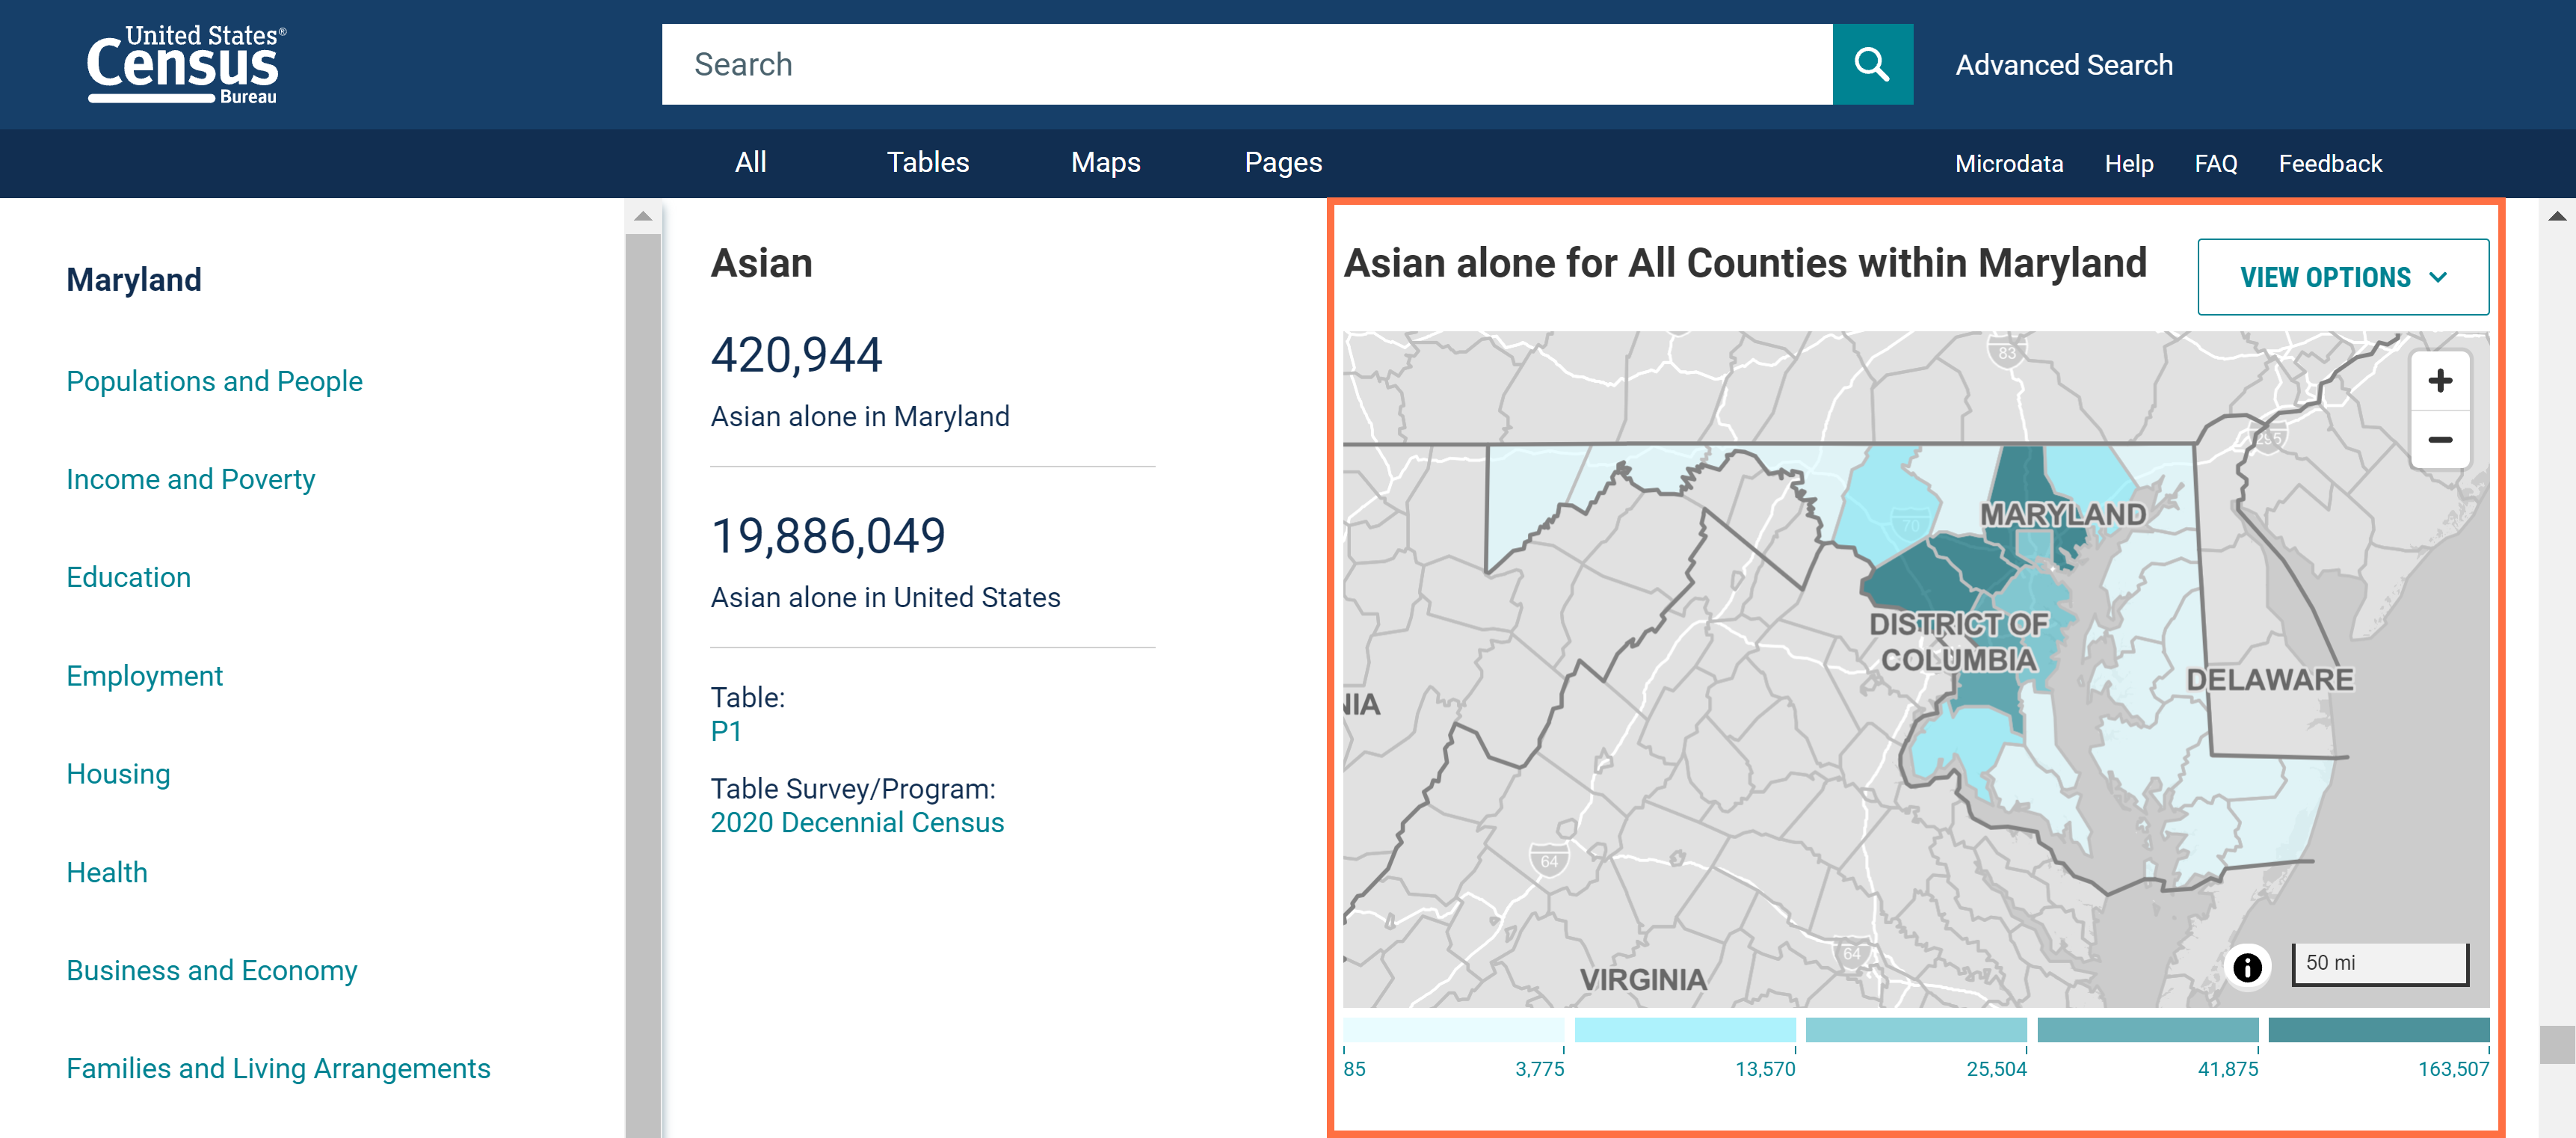
- Expanded Geography Profiles. You will now see about twice as much content in the Geography Profiles, along with categories/subcategories that match the layout in the Topics filter to provide a consistent experience across the site. Behind the scenes, we also integrated the data source of these profiles to align with other search results, which will support faster updates as new data are released.
The screenshot below shows additional data highlights featured at the top of each Geography Profile. You will also see 23 new sections so you can explore more data in one view.
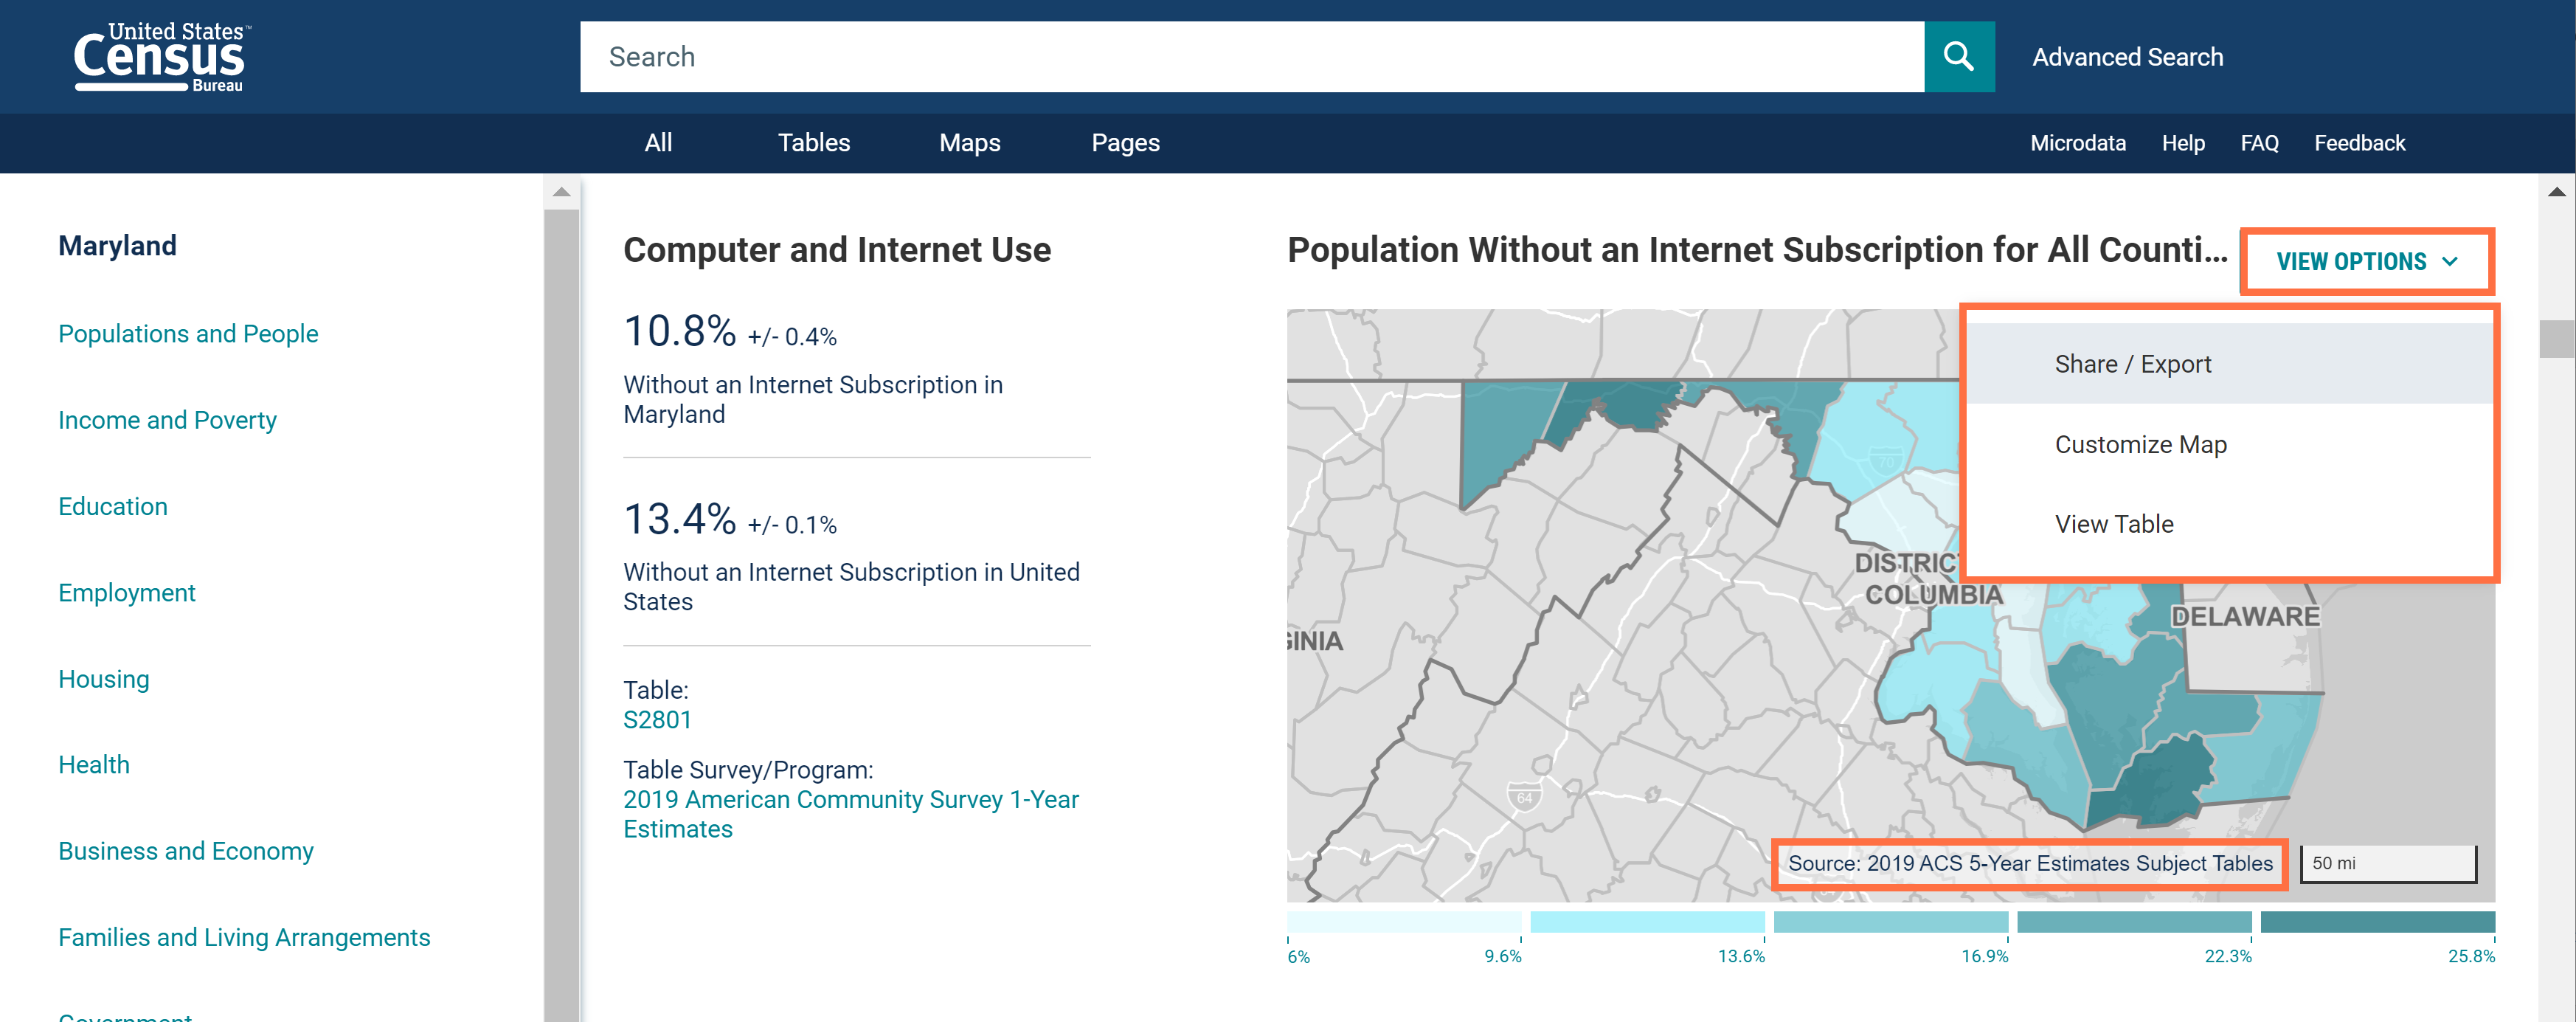
- Improved placement of controls in Geography Profiles. Click the new “View Options” drop-down menu to see all the available action items for a visualization. This includes a new option that allows you to view the table data that powers each map.
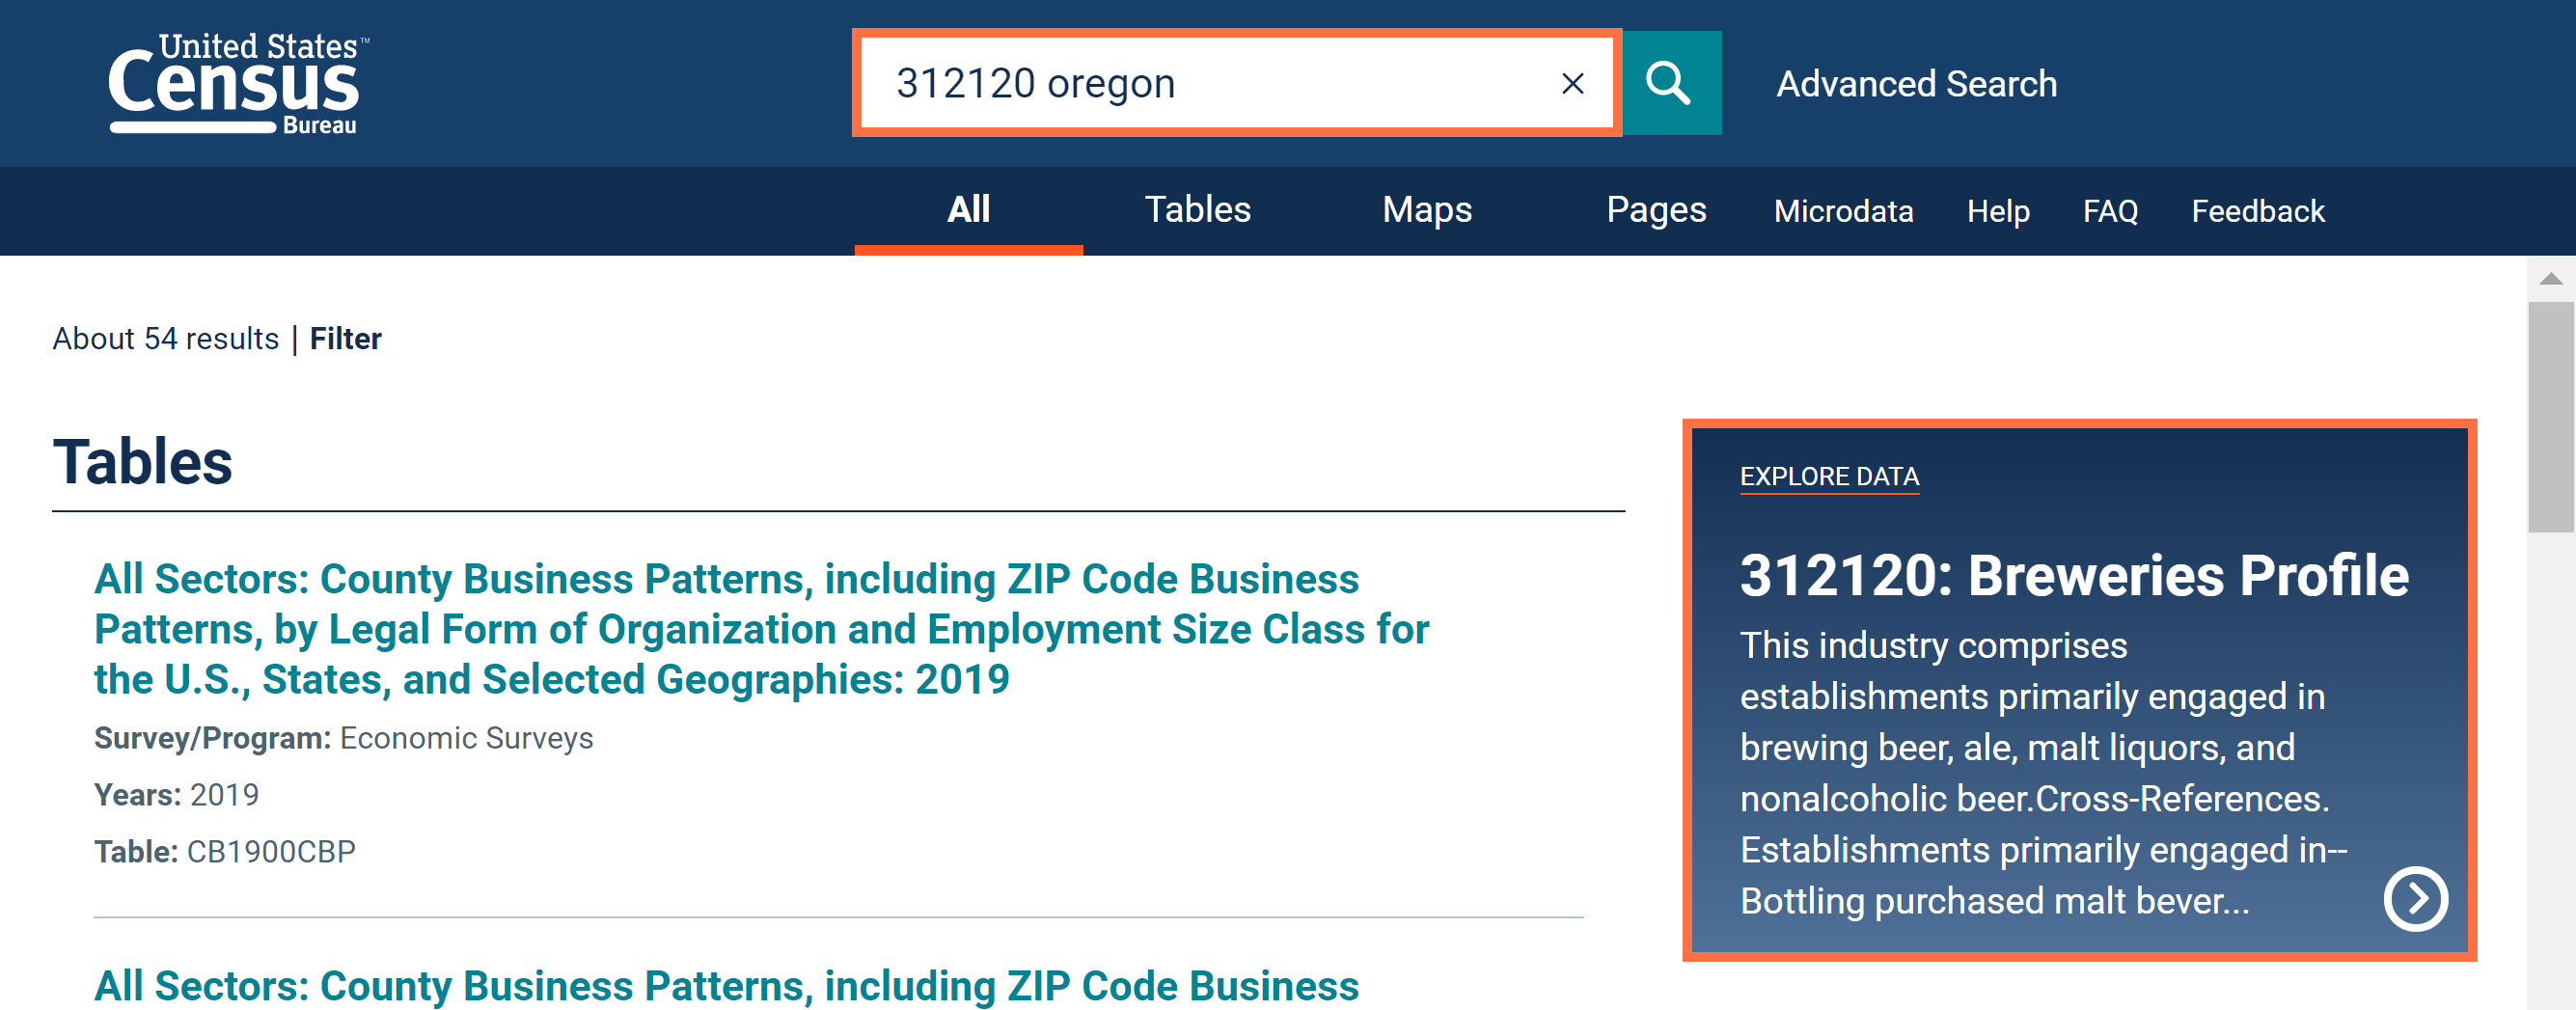
- New Industry Profiles that allow you to explore key data, visualizations, and maps for any 2–6-digit North American Industry Classification System (NAICS) code. These profiles are available at the state or national level.
To access an Industry Profile, run a search for a single NAICS code and up to one geography (nation or state), and then click the blue box on the “All” results page that says “Explore Data.”
- 34 defect resolutions, including fixes that allow you to:
- Select individual blocks that were previously missing in the geography filters
- Experience a more accessible site as we work towards compliance with Section 508 standards
In mid-September, we released the following updates to the site:
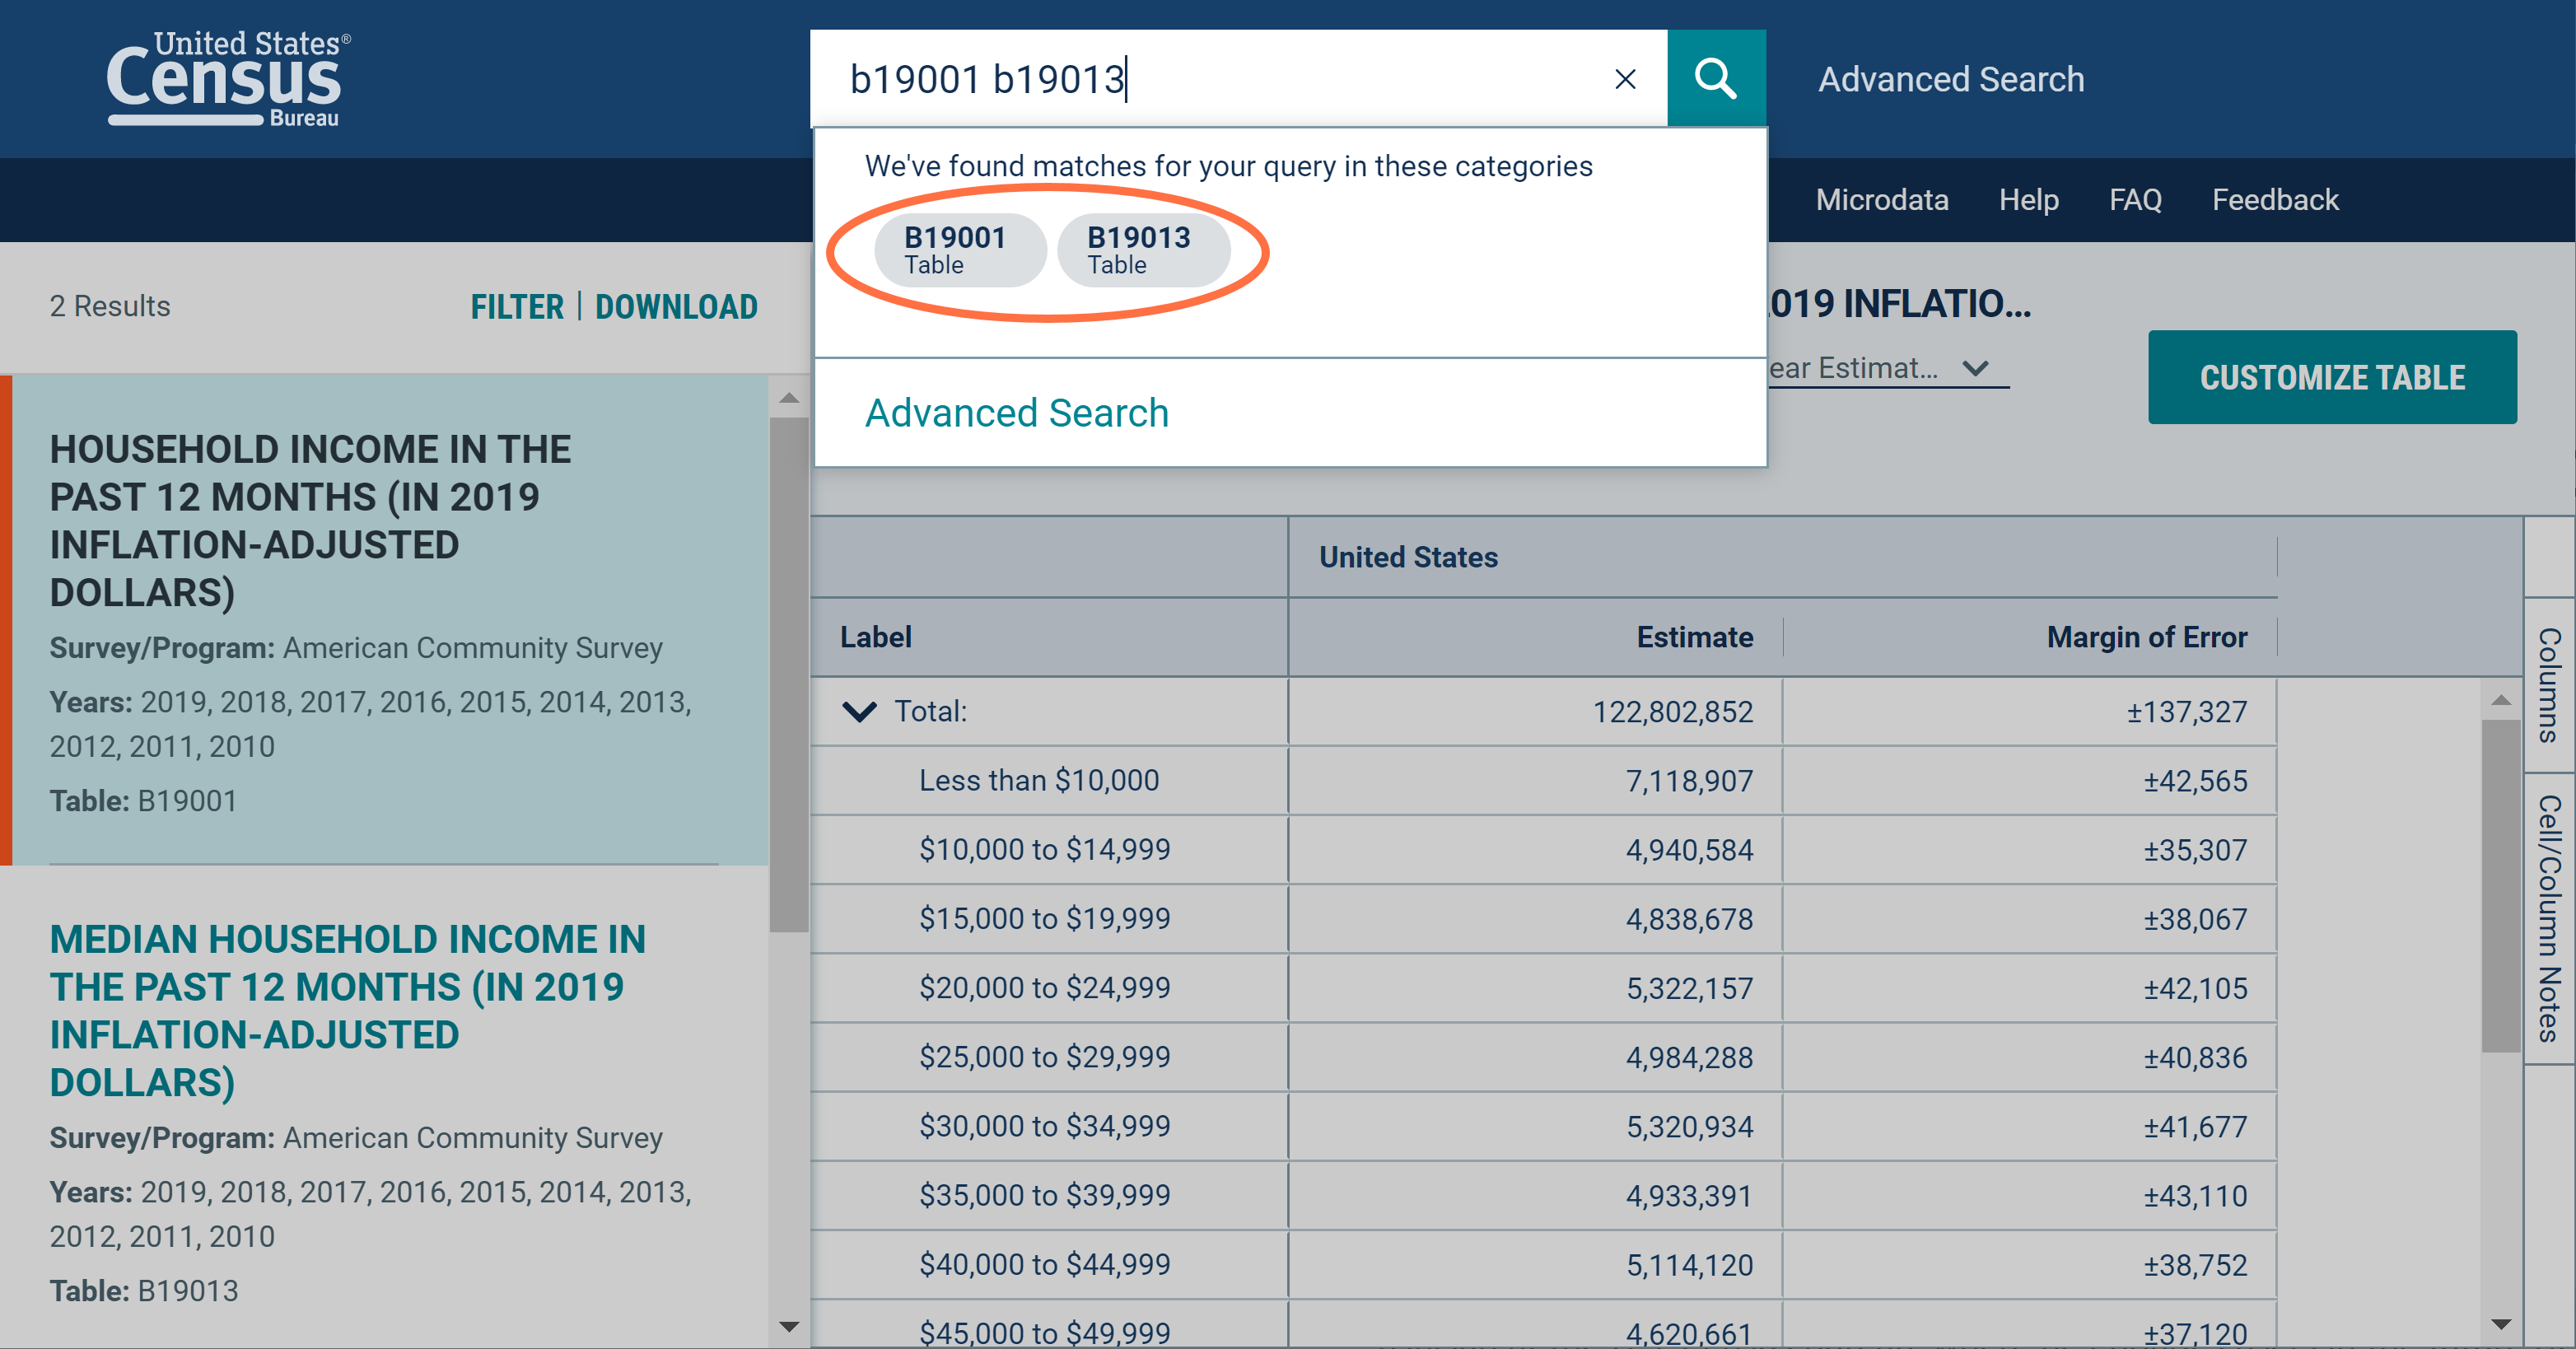
- Formal recognition of table IDs in the single search bar. You will now get a visual indication that table IDs are recognized as search criteria when you search for them in the single search bar.
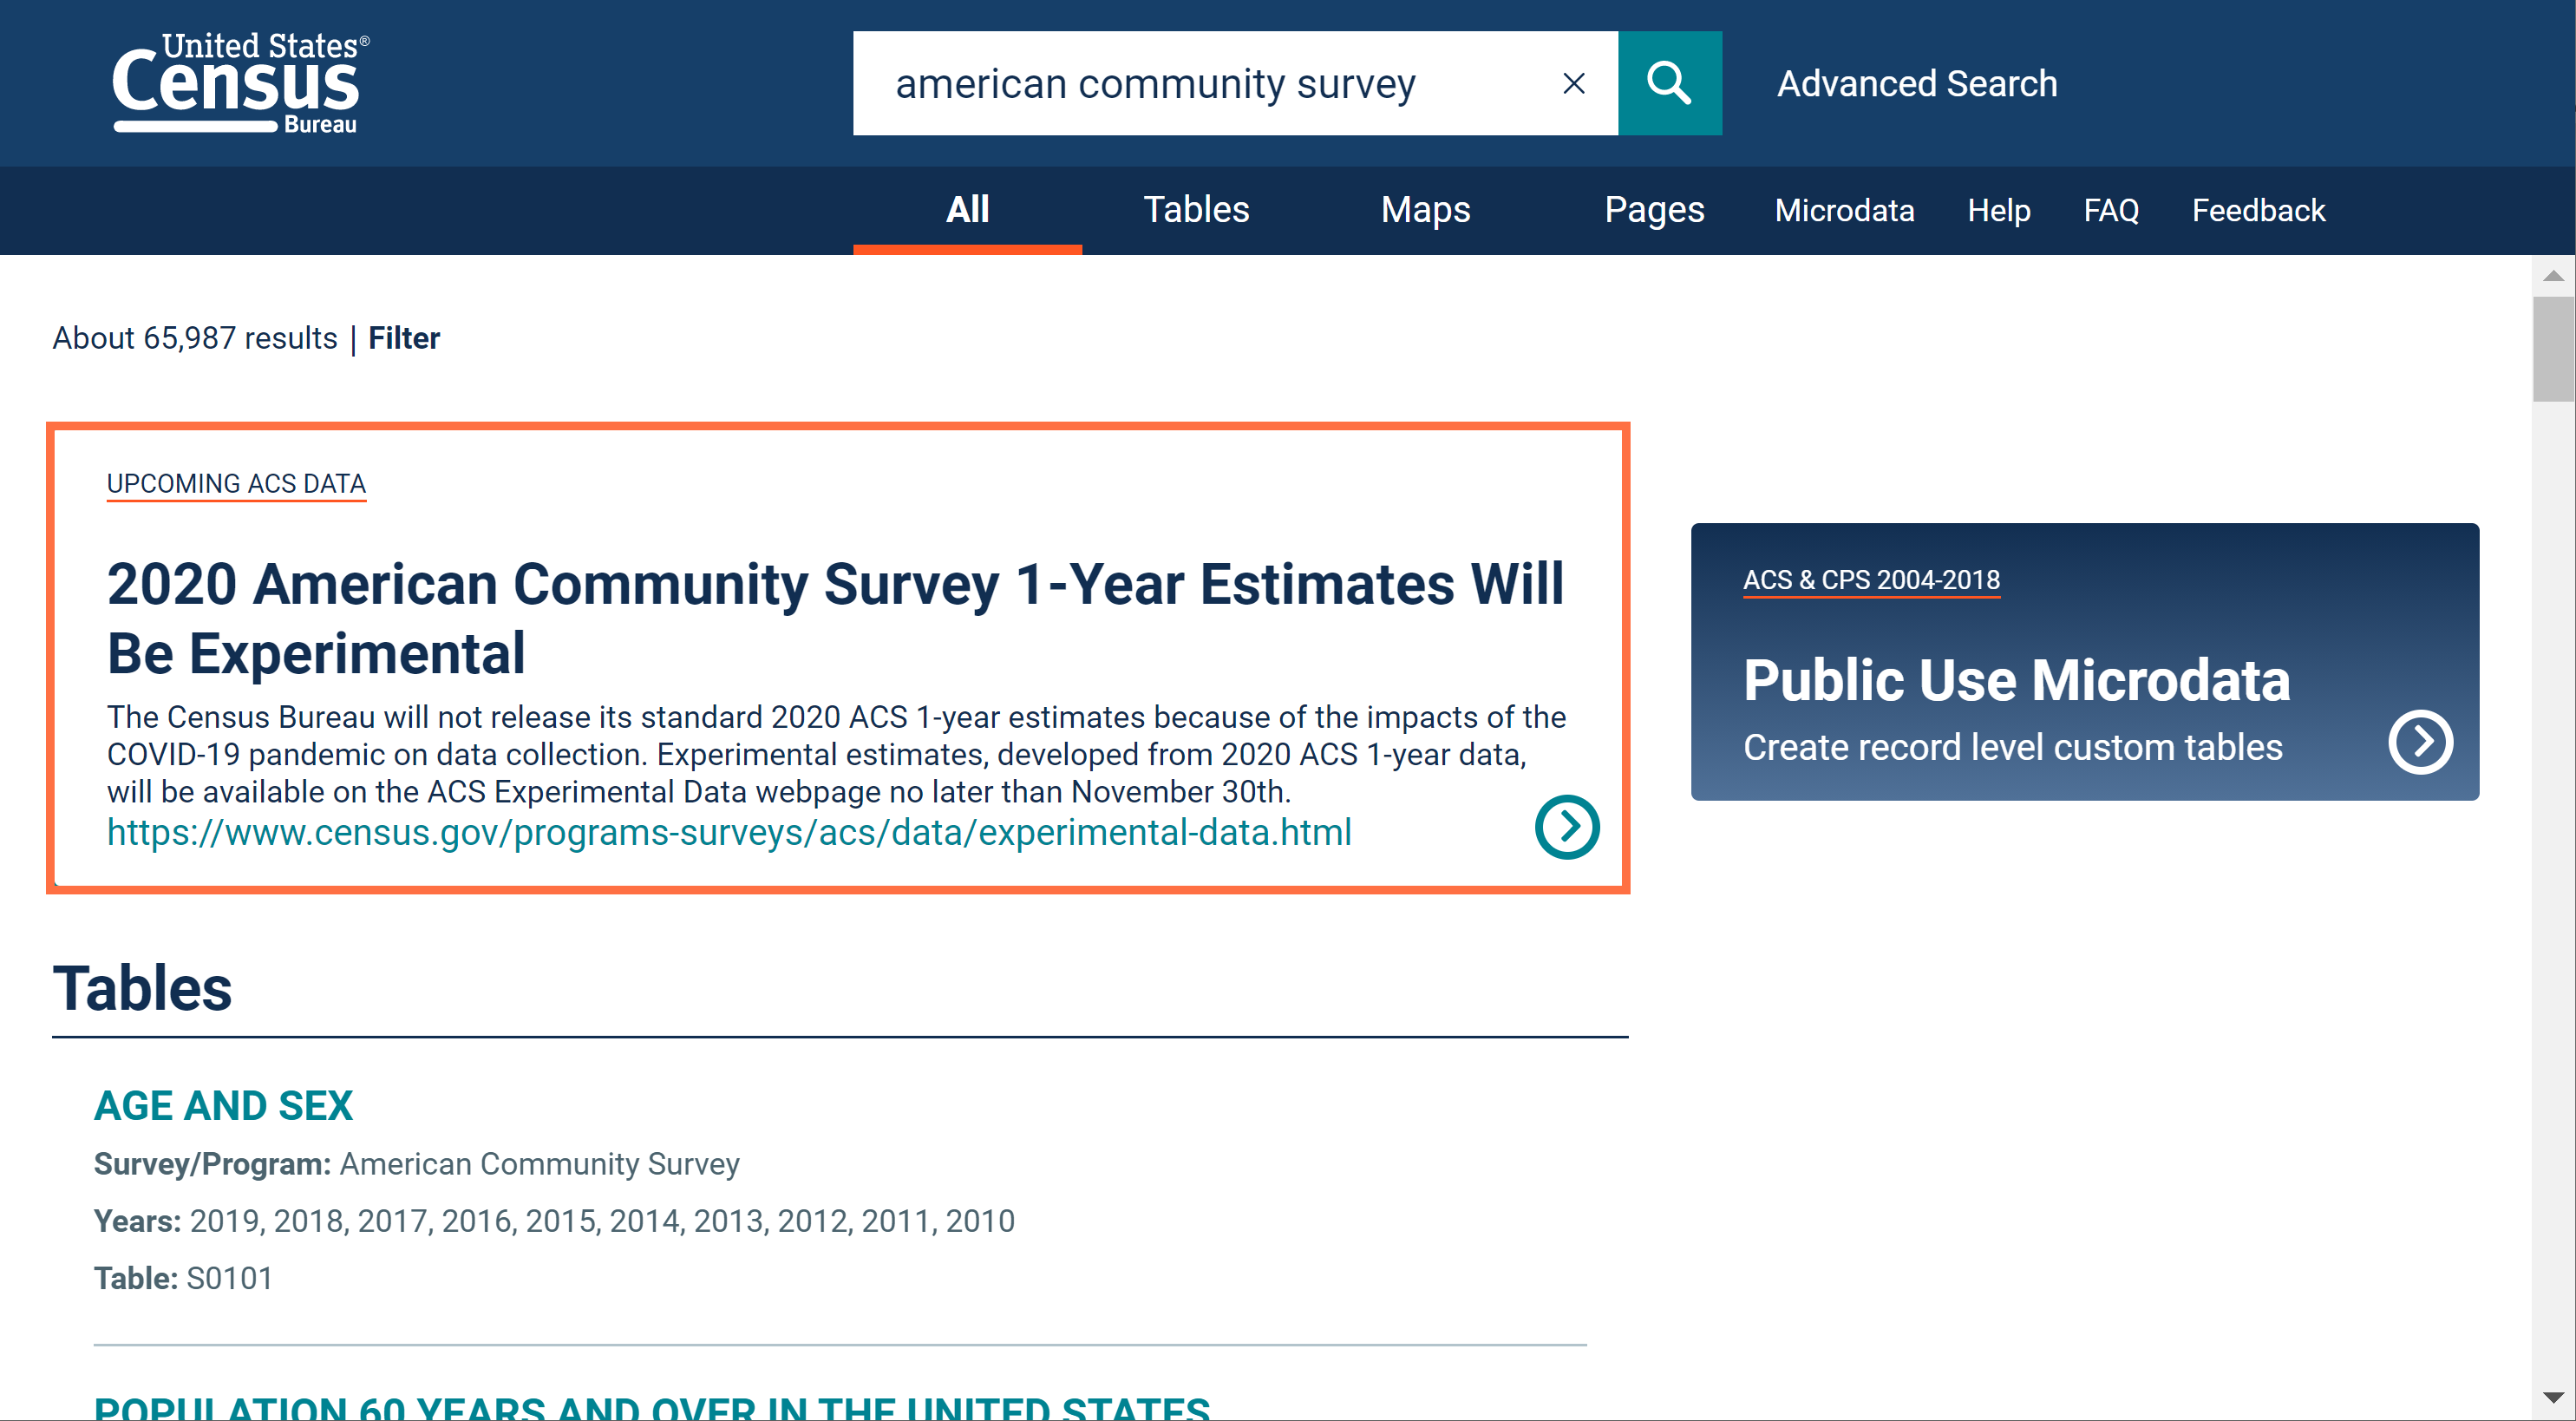
- Links for upcoming 2020 American Community Survey 1-Year Experimental Estimates when you search “American Community Survey” or “ACS” in the single search bar.
- Technical improvements that allow us to provide more frequent banner updates at the top of your screen when we need to alert you to critical notifications.
- 31 defect resolutions, including fixes that allow you to:
- Search in geography filter panels to find geographic components such as urban/rural
- Run searches in the single search bar that include both the table ID and full table title
- See featured statistics for total population on the “All” results page
- View table title and source information at the top of your screen in the “Customize Table” view in situations when it was previously missing
In early-September, we released the following updates to the site:
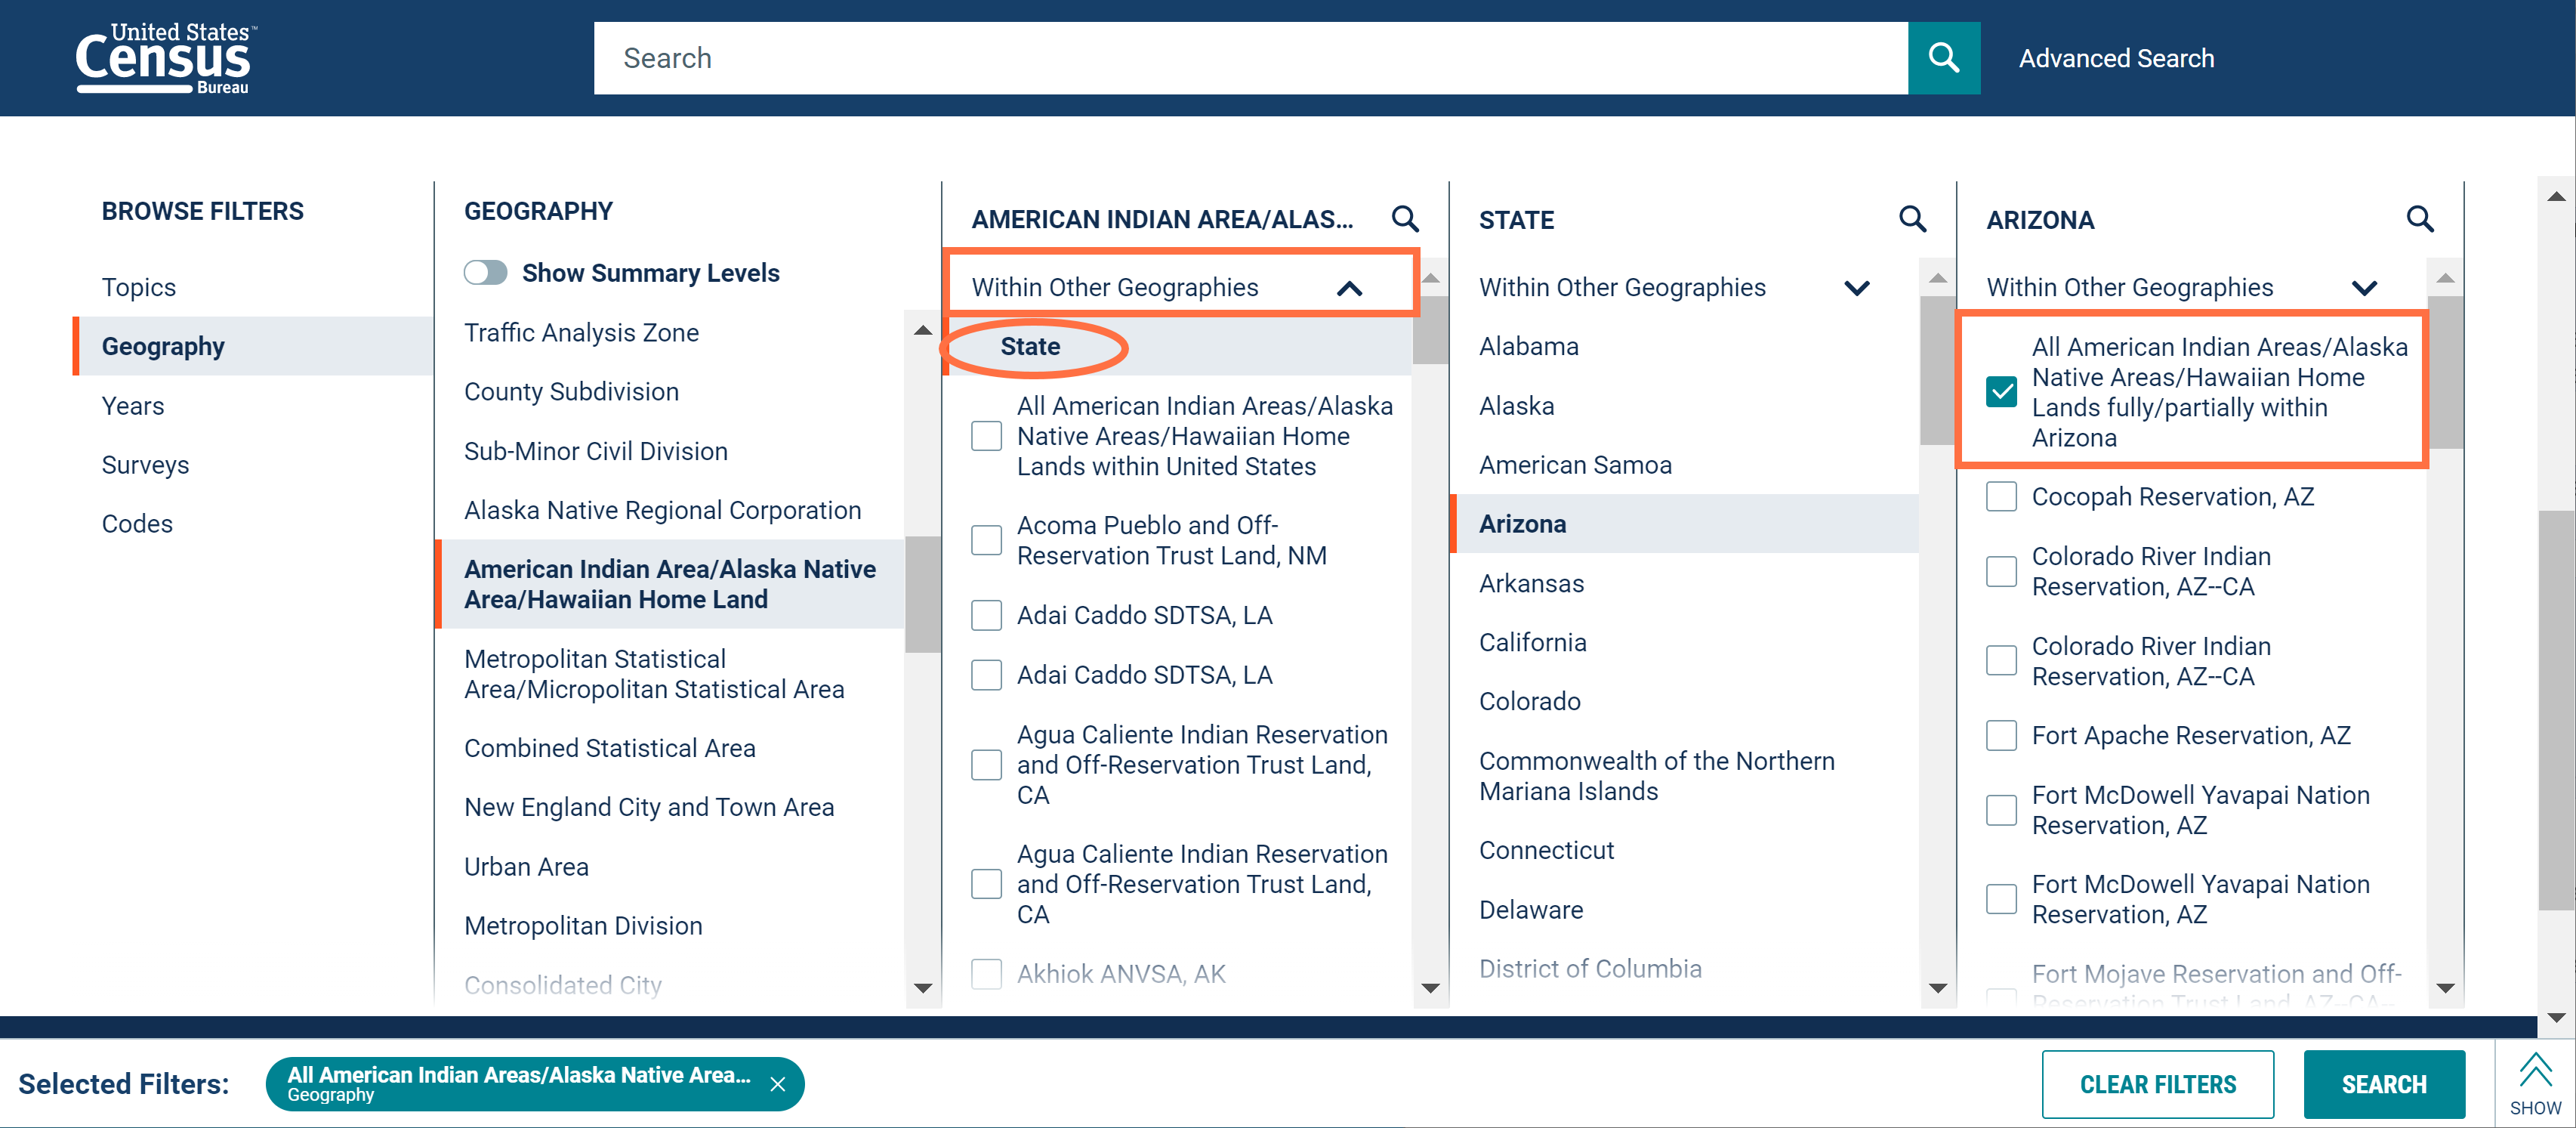
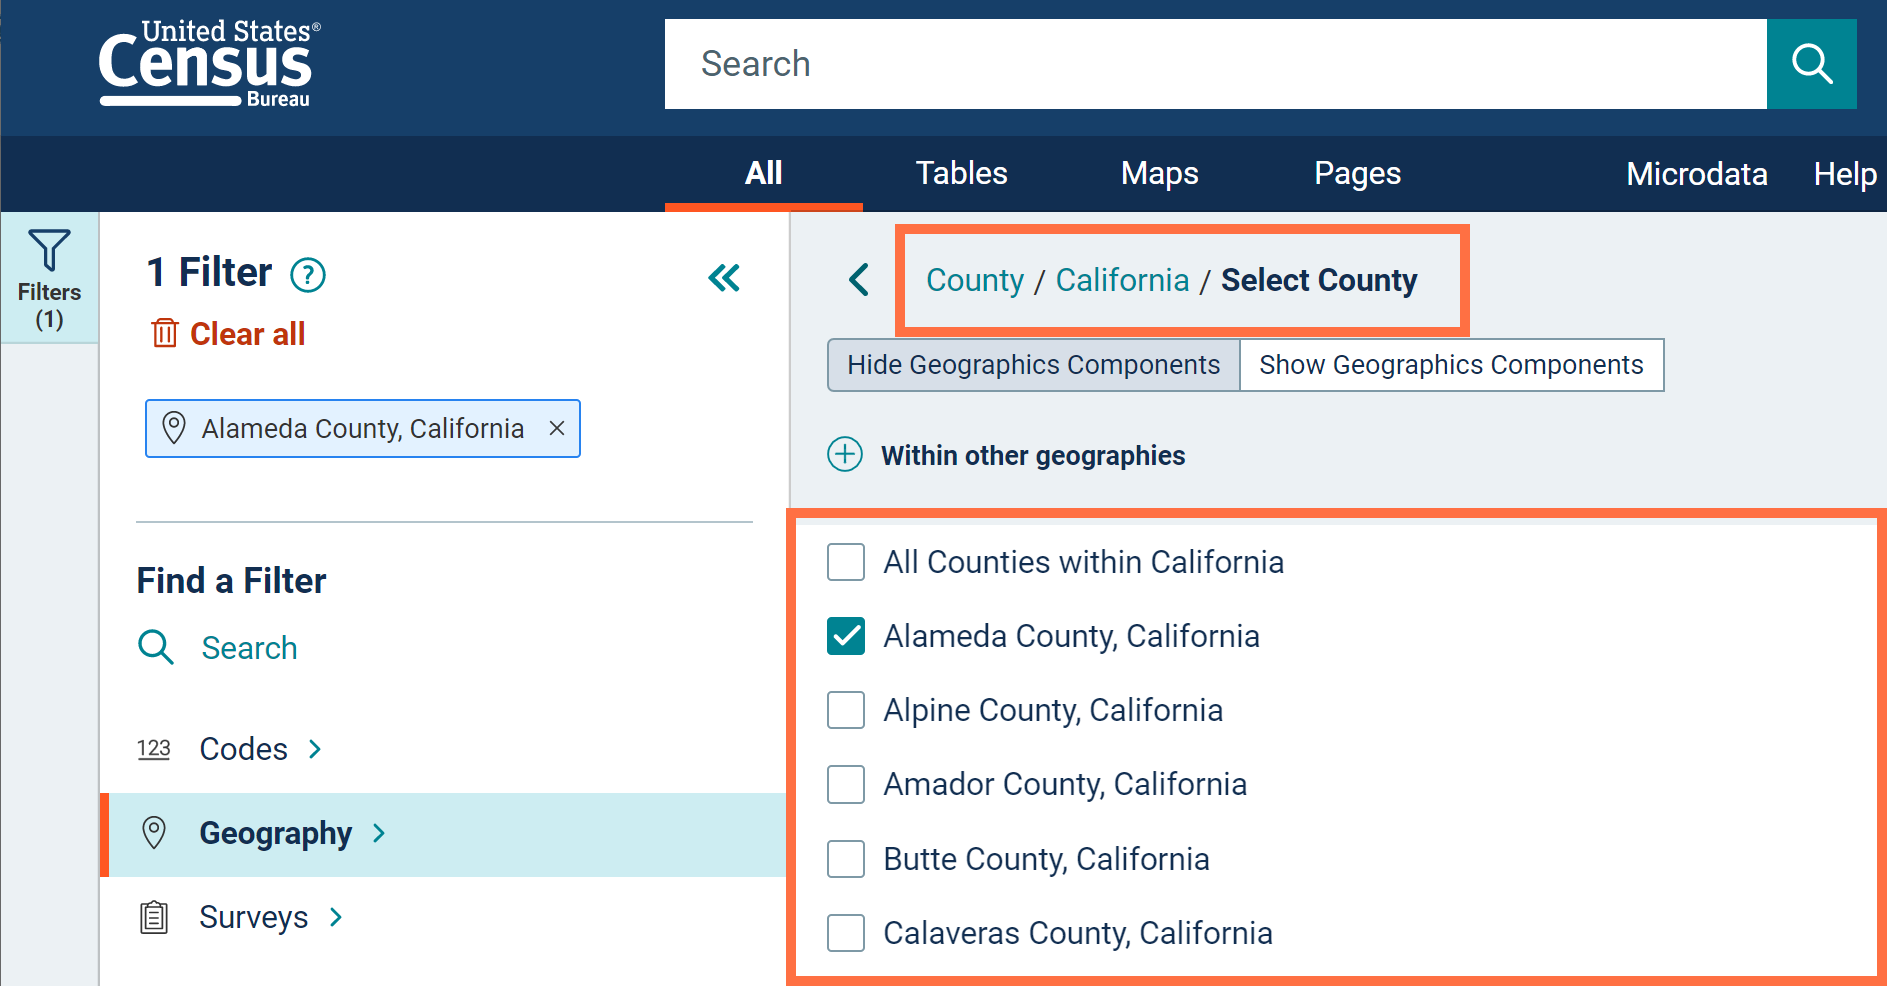
- 40 new check boxes that allow you to select collections of geographies in a single click, such as “All Census tracts in the United States” or “All American Indian Areas/Alaska Native Areas/Hawaiian Home Lands in a State.”
To access many of these new check boxes, you will need to click the “Within Other Geographies” drop-down menu at the top of the appropriate geography panel. As an example, the screenshot below shows the steps to select all American Indian Areas within Arizona. It shows how after selecting your primary geography (American Indian Area/Alaska Native Area/Hawaiian Home Land), you would click the “Within Other Geographies” drop-down menu and choose “State” to proceed with the correct pathway.
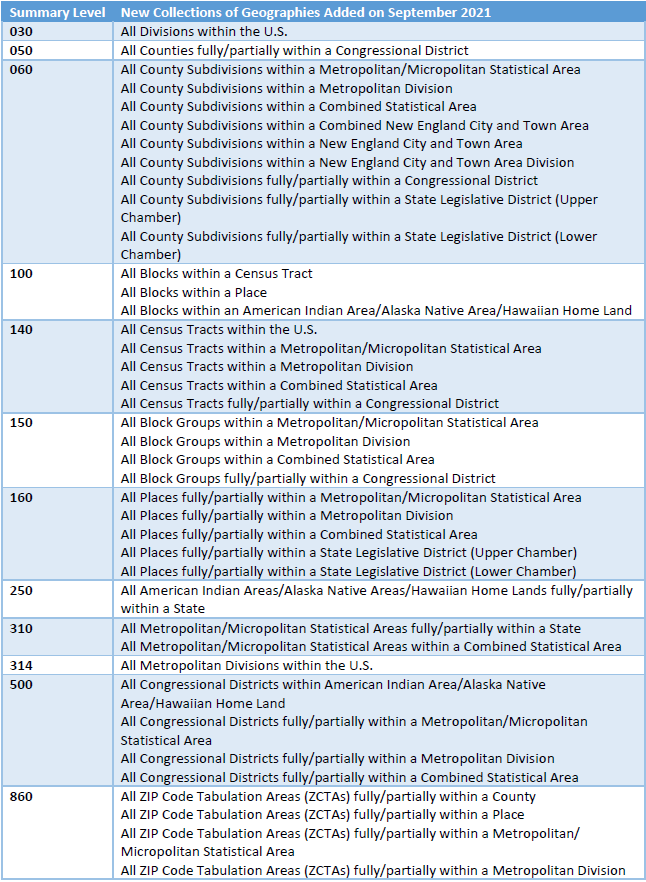
The table below shows the list the 40 specific collections of geographies that are new with this release. To see a complete list of all available options to select collections of geographies (including the options that existed before September), please see Appendix 2.
Please note: We are still working through some inconsistencies with these new check boxes, especially for options involving vintage-based geographies, to make sure that they return the correct set of tables with data as you use them. We will post updates here as fixes are released.
- 12 defect resolutions, including fixes that allow you to:
- View correct data for land area and water area in the Geography Profiles
- Experience a more responsive process to download data tables
In October, we released the following updates to the site:
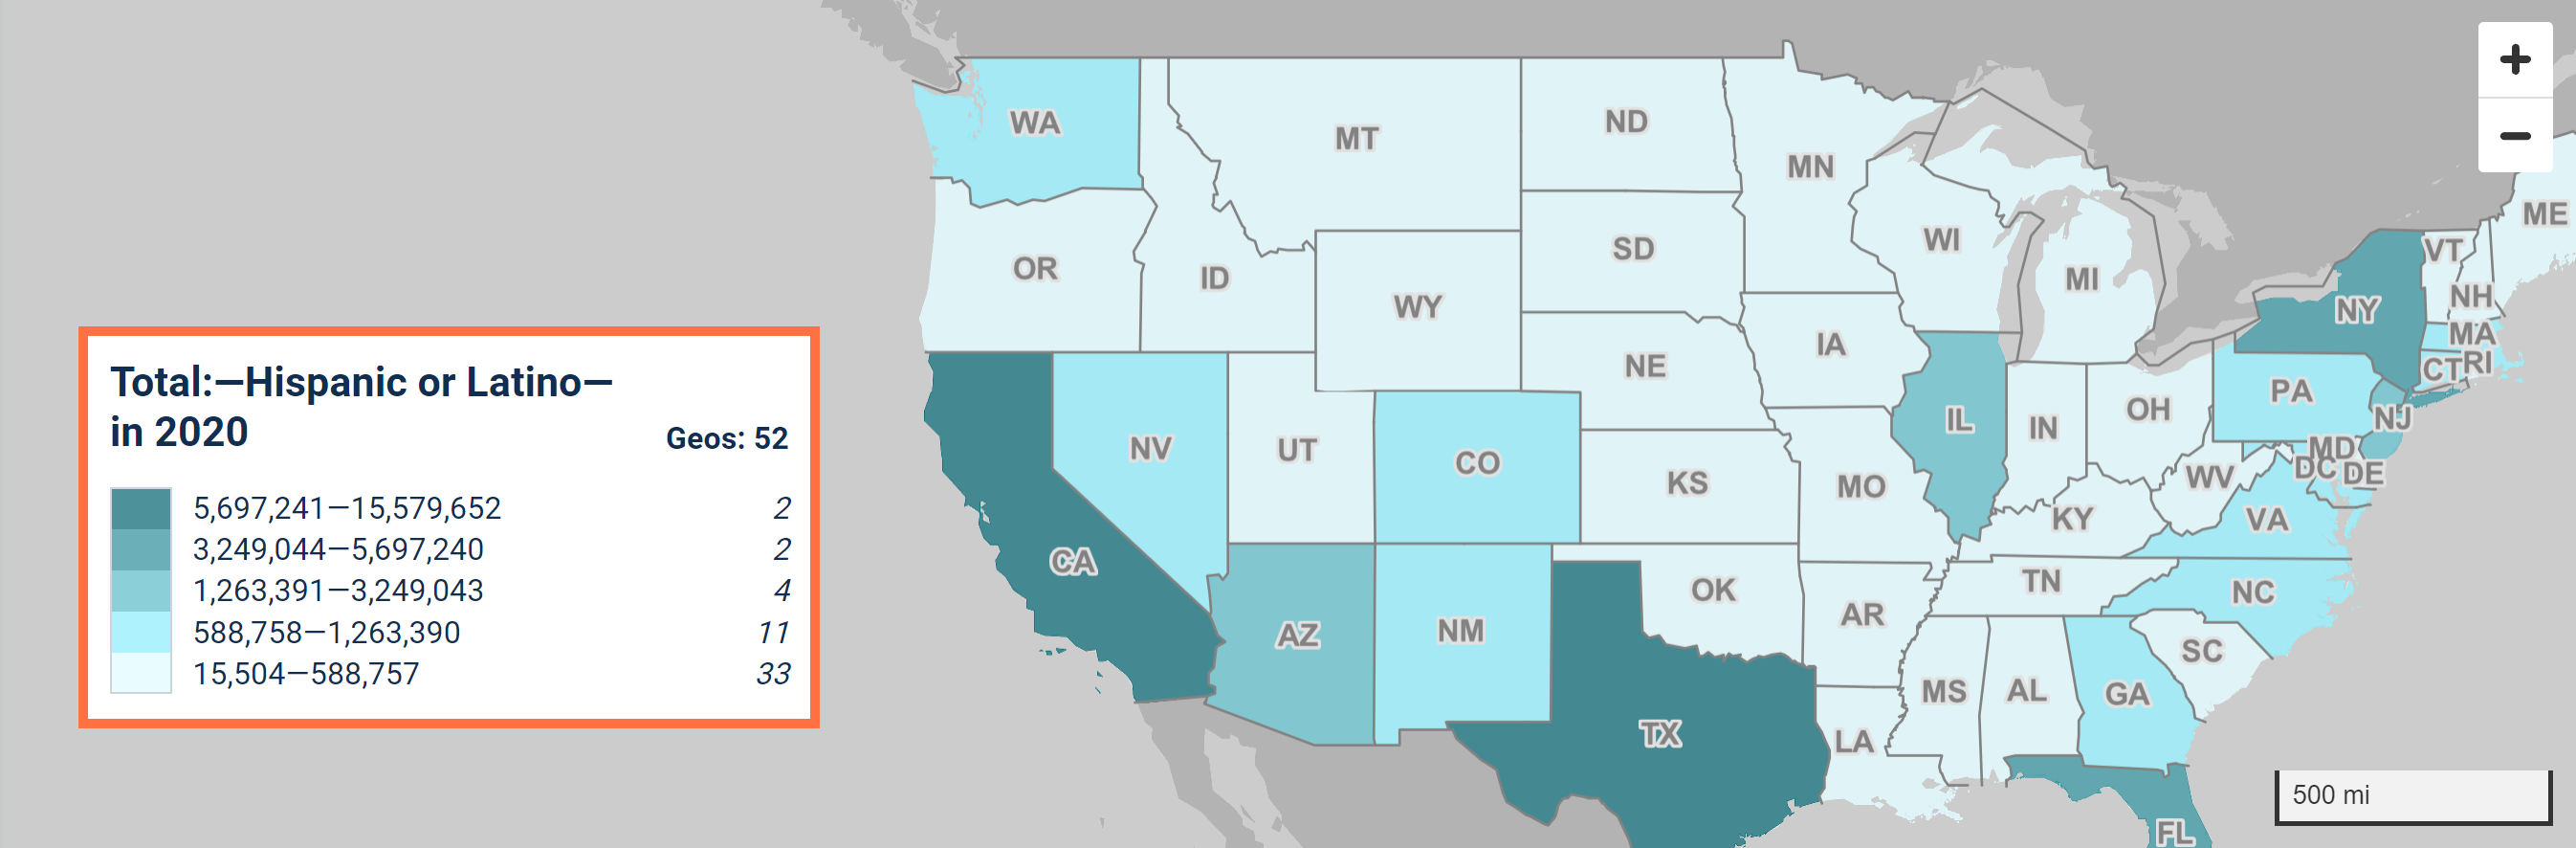
- Tune up of the map legend. You will now see the data variable and total number of geographies indicated at the top of the map legend.
- Technical improvements to load an unlimited number of maps on the Profile pages. These updates allow you to bypass previous browser limitations to load a maximum of 16 maps.
- New banner at the top of the screen to let you know that data.census.gov is an official and secure website of the United States government.

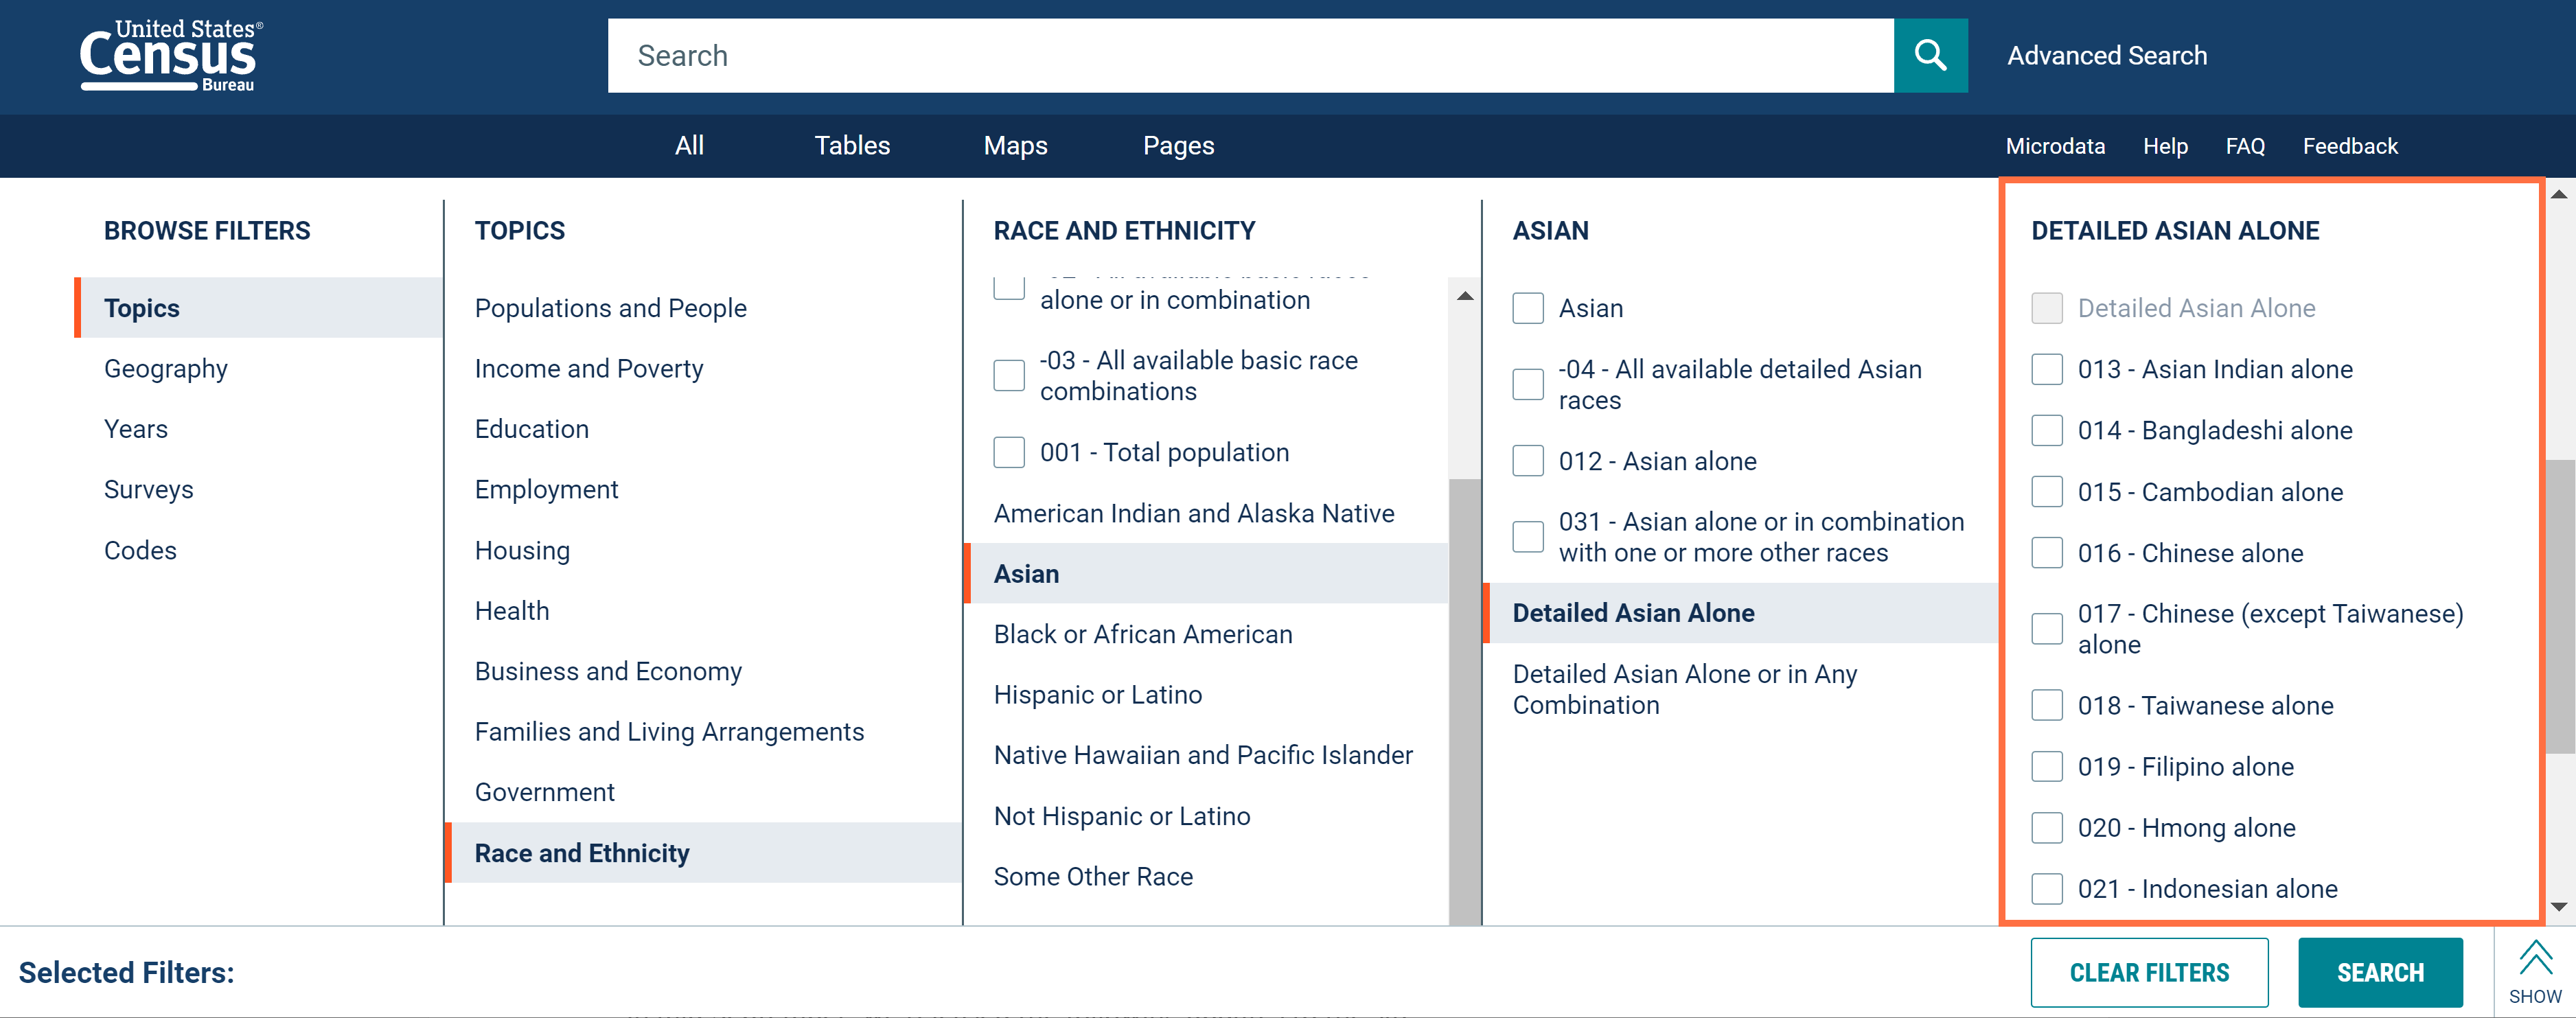
- Simplified labels for detailed population groups. To improve readability, you will now see only one code for each detailed population group in the filter panel. The codes you see will match the codes used for these population groups in the application programming interface (API).
- 13 defect resolutions, including fixes that allow you to:
- View data from Table S0201 -- Selected Population Profile in the United States for all available data years
- Maintain your filter selection for the United States when accessing tables from the 2020 Census
In November, we released the following updates to the site:
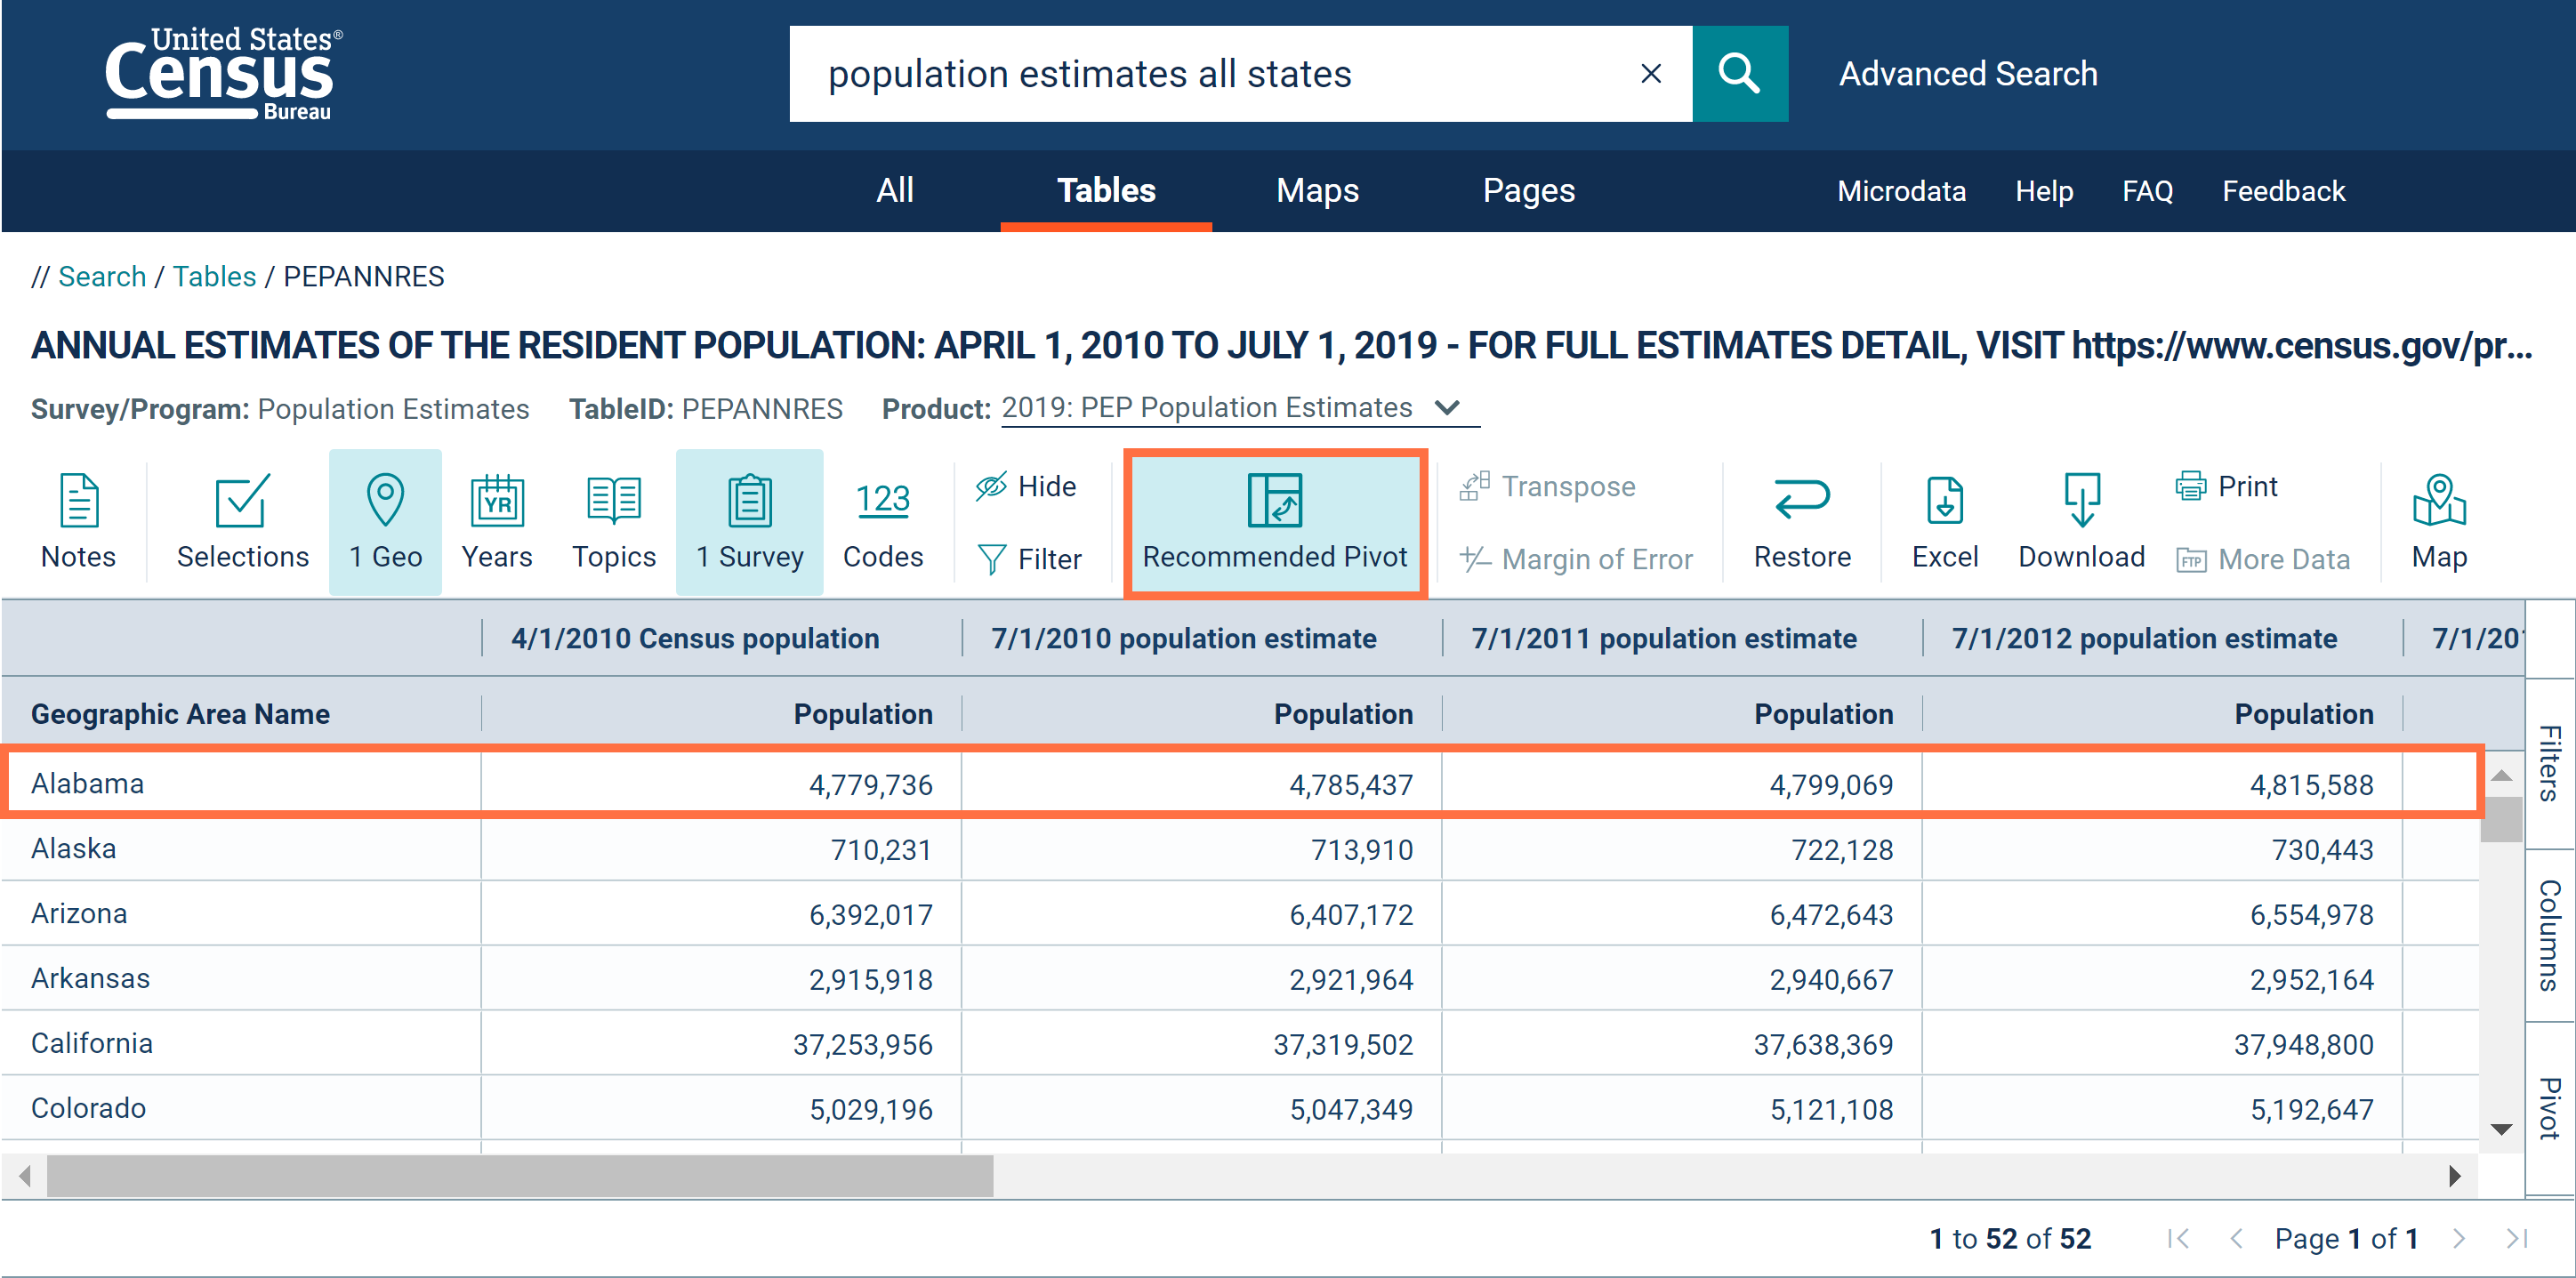
- Improved layout for tables from the Population Estimates Program. With this update, you will now see tables automatically displayed with the recommended pivot. This new feature allows certain data values to become column headers instead of repeated rows within the table.
For Population Estimates Program tables, the default display now provides one row for each of your geographies, and it will contain the geography name and population estimates over time.
- Technical work to help support the upcoming release of 2018 American Community Survey (ACS) 5-Year Estimates Equal Employment Opportunity (EEO) tables on data.census.gov.
- Back-end enhancements to support future efforts to streamline the process to select geographies with variants, such as metropolitan/micropolitan statistical areas, urban areas, and congressional districts.
- 9 defect resolutions, including fixes that allow you to:
- Accurately select “All blocks in a place” in a single click
- View correct results when using typeahead search suggestions for table IDs
In December, we released functionality and tables that allow you to:
- Access data for Equal Employment Opportunity (EEO) occupation codes, such as “0120 – Financial Managers.” Simply type the four-digit EEO occupation code in the single search bar (example: 0120) or select it in the filter panel:
Example: Codes → EEO Occupation Codes → 0120 – Financial Managers
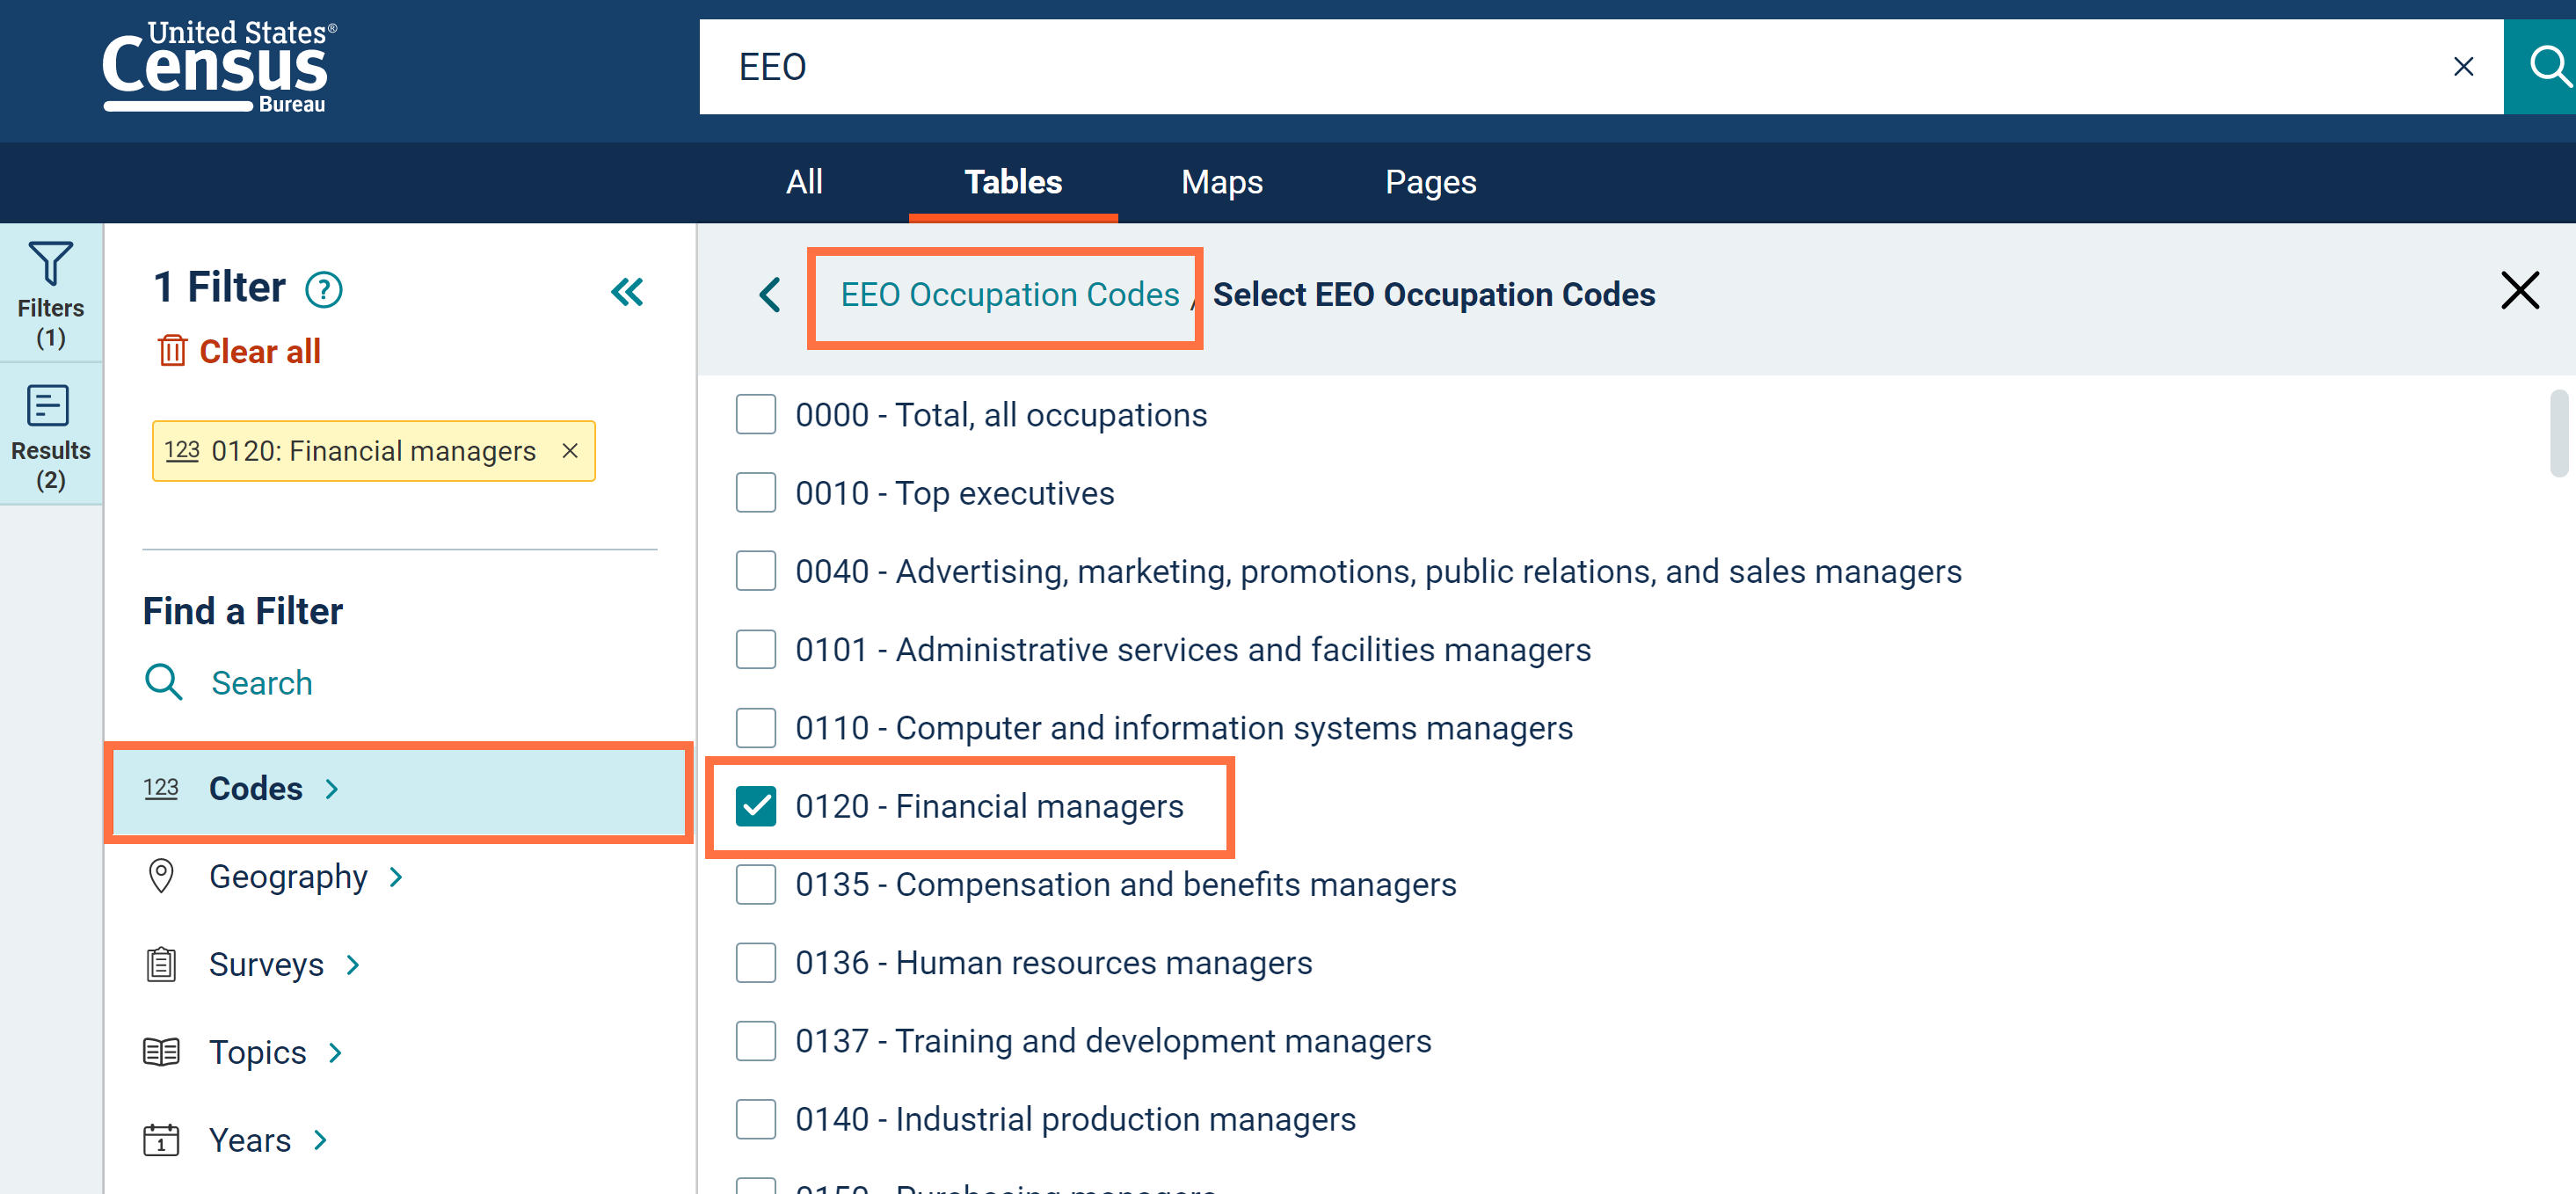
This functionality supports the 2018 American Community Survey (ACS) 5-Year Equal Employment Opportunity (EEO) tables we released in early December. We will continue to add more 2018 ACS 5-Year EEO tables in the future. Learn more in the FAQ: How can I access Equal Employment Opportunity (EEO) Tabulation data on data.census.gov?
In early December, we released several updates based on data user feedback to make the site more intuitive, easier to navigate, and more adaptable to your needs.
- Learn more about each of these updates below:
- Navigation Improvements
- Filtering Enhancements
- Result List Upgrades
- Mapping Refinements
Navigation Improvements
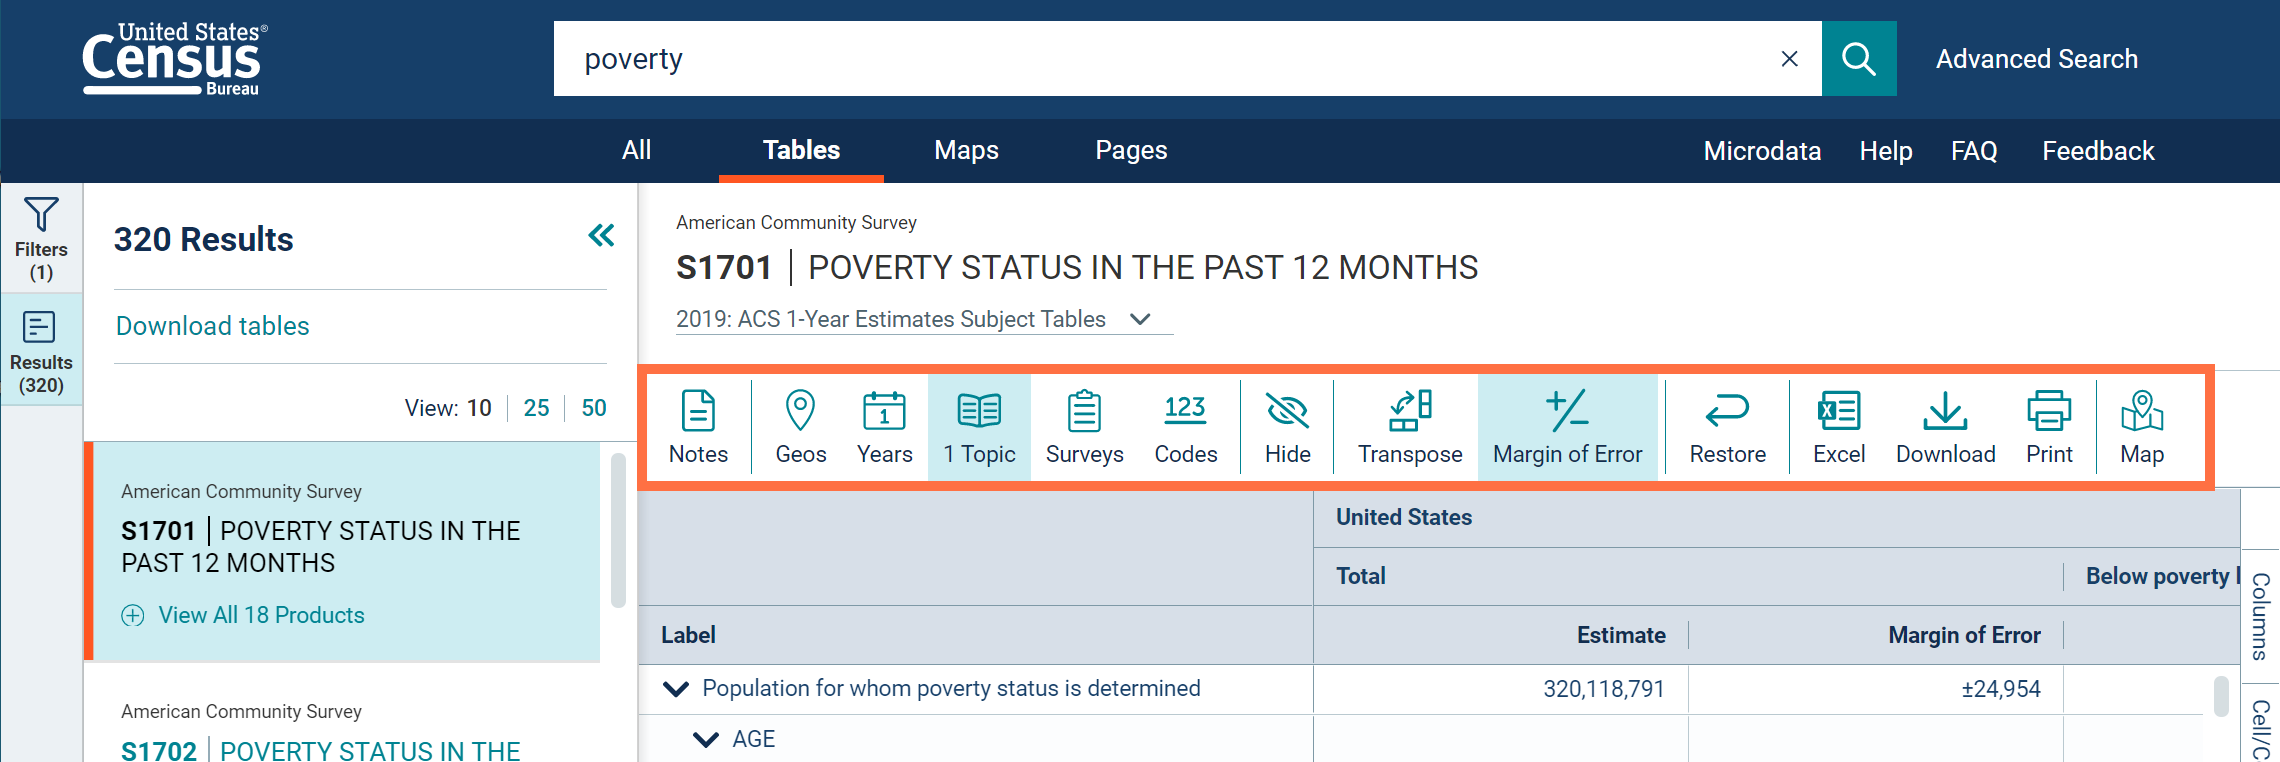
- We now provide toolbar options by default in all table and map views. This makes it easier to see the available customization options and requires fewer clicks for you to use them.
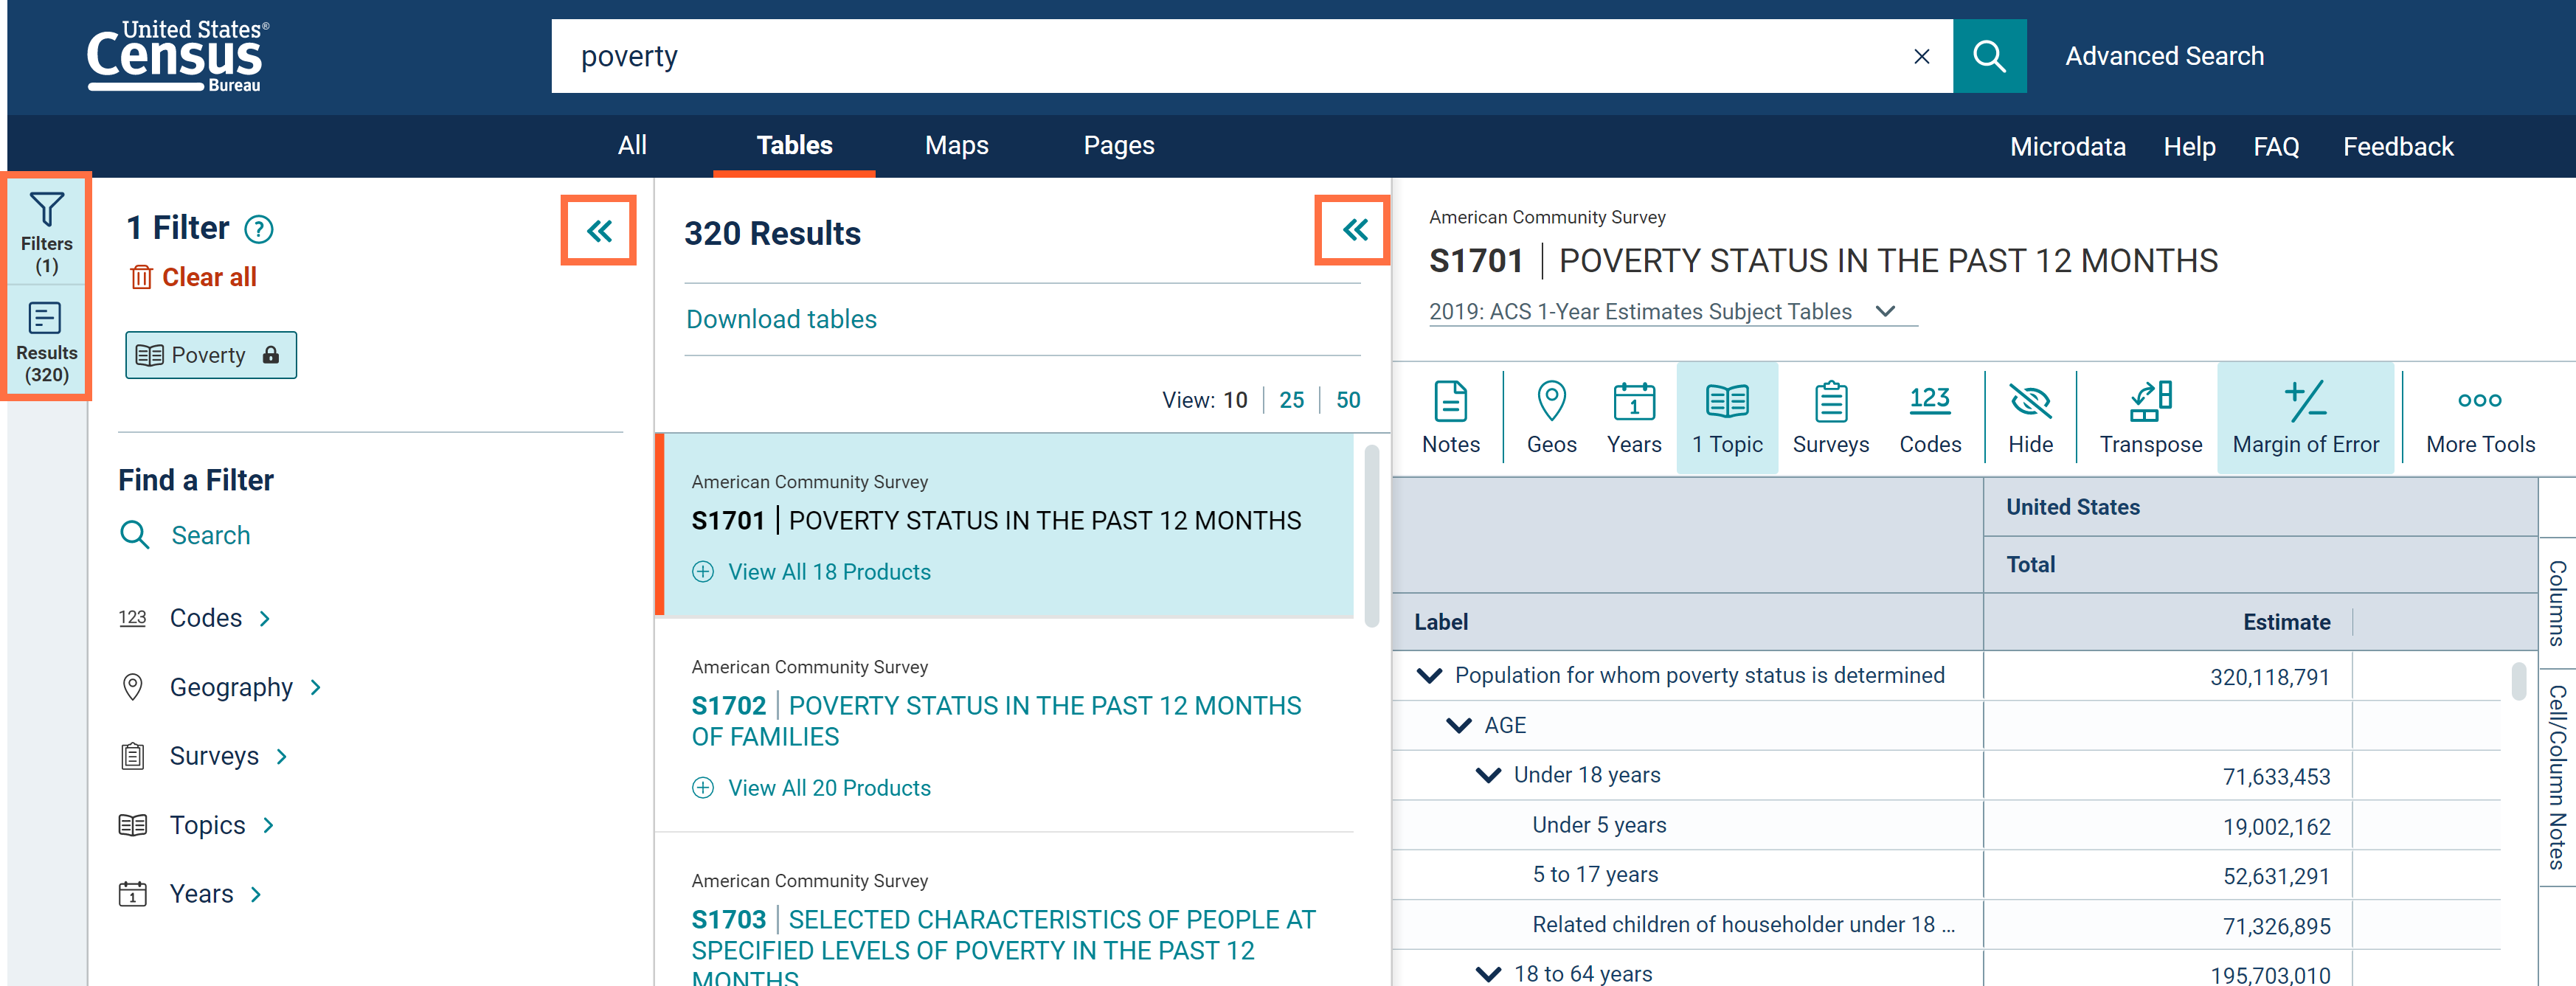
- New panels for filters and results. This update allows you to easily access all filters and results on the same screen, with the flexibility to collapse the panels you do not need.
Click the “Filters” button, “Results” button, or the chevrons to open/close these panels.
Filtering Enhancements
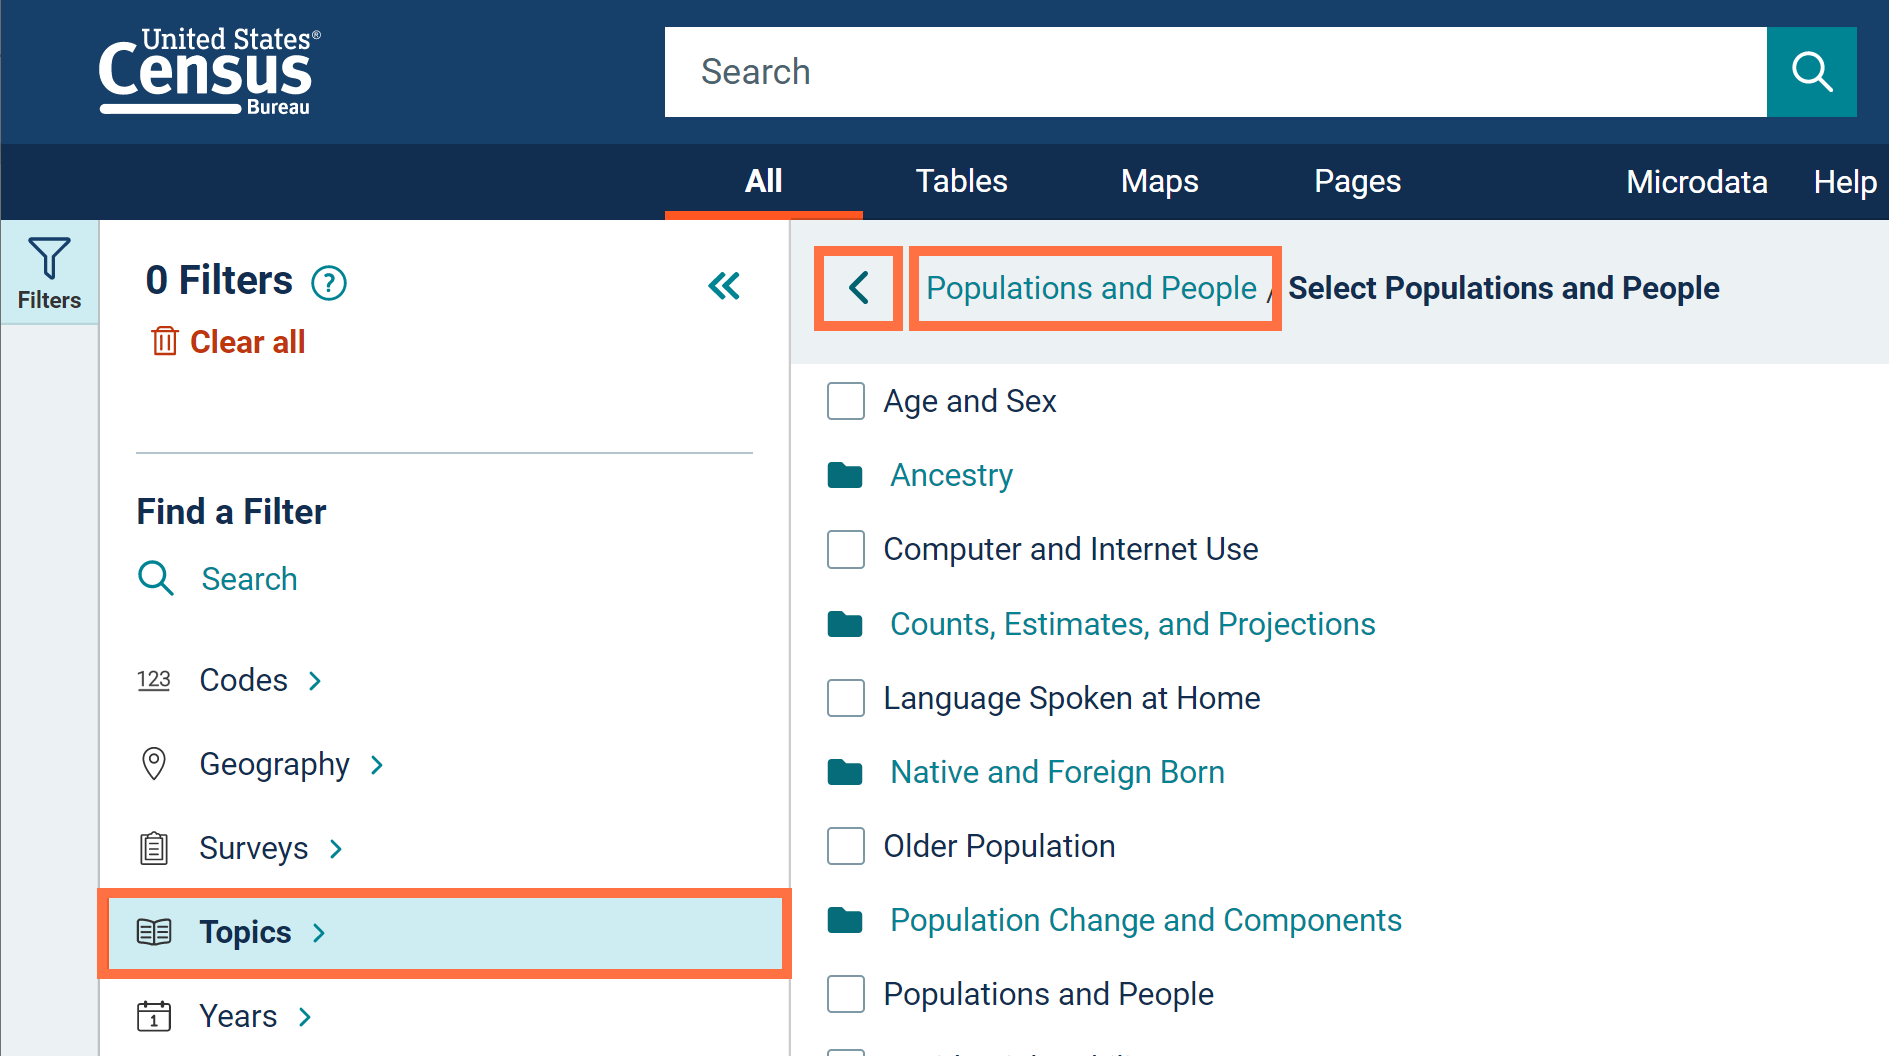
- The site will show you only one section of the filter panel at a time to simplify the details you see. Breadcrumbs show the previous clicks you made to get to where you are in the filter panel.
- Click a check box to make a final selection. Click a folder to choose from more detailed options
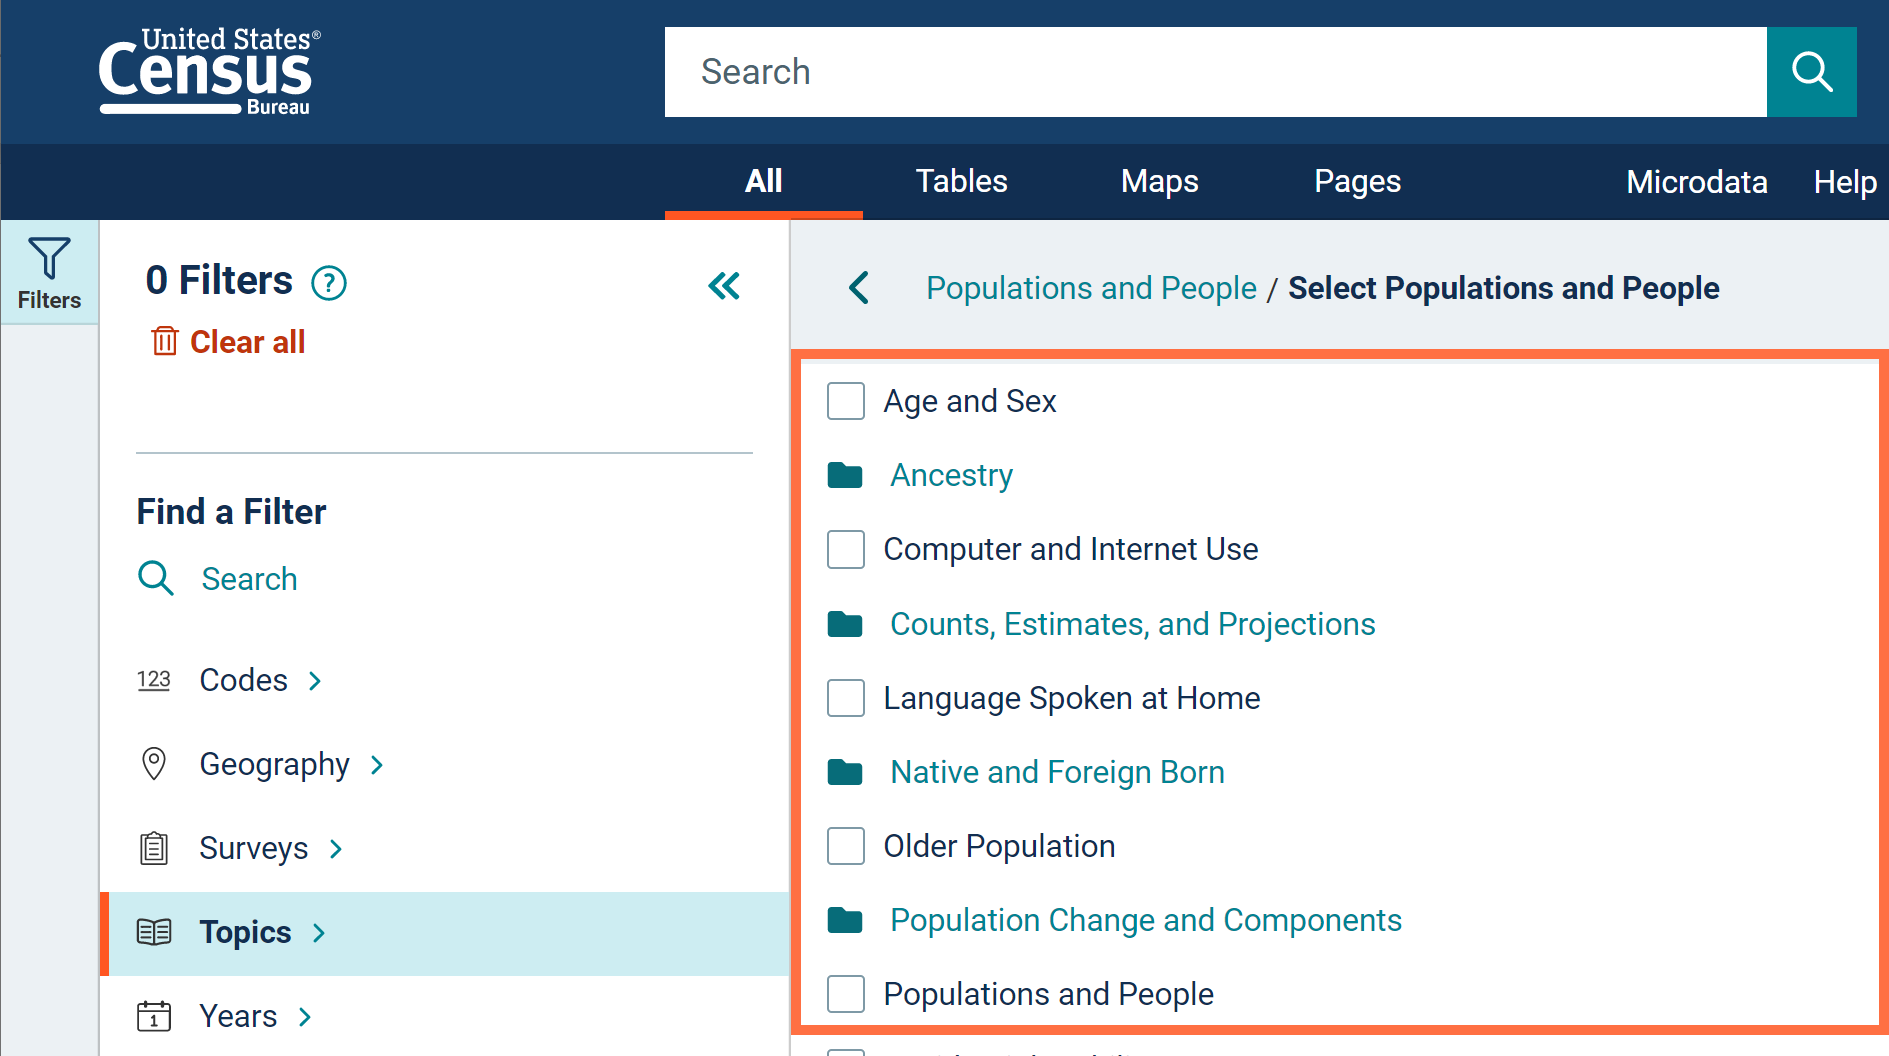
- Click the back arrow, breadcrumbs, or primary filter categories to navigate backwards
- You will no longer see filters that are incompatible with your current selections. This makes it easier to see and select options that are relevant.
- Types of filters
o Color-coding and icons are used to show the type of search criteria, such as whether it is a topic, geography, or year
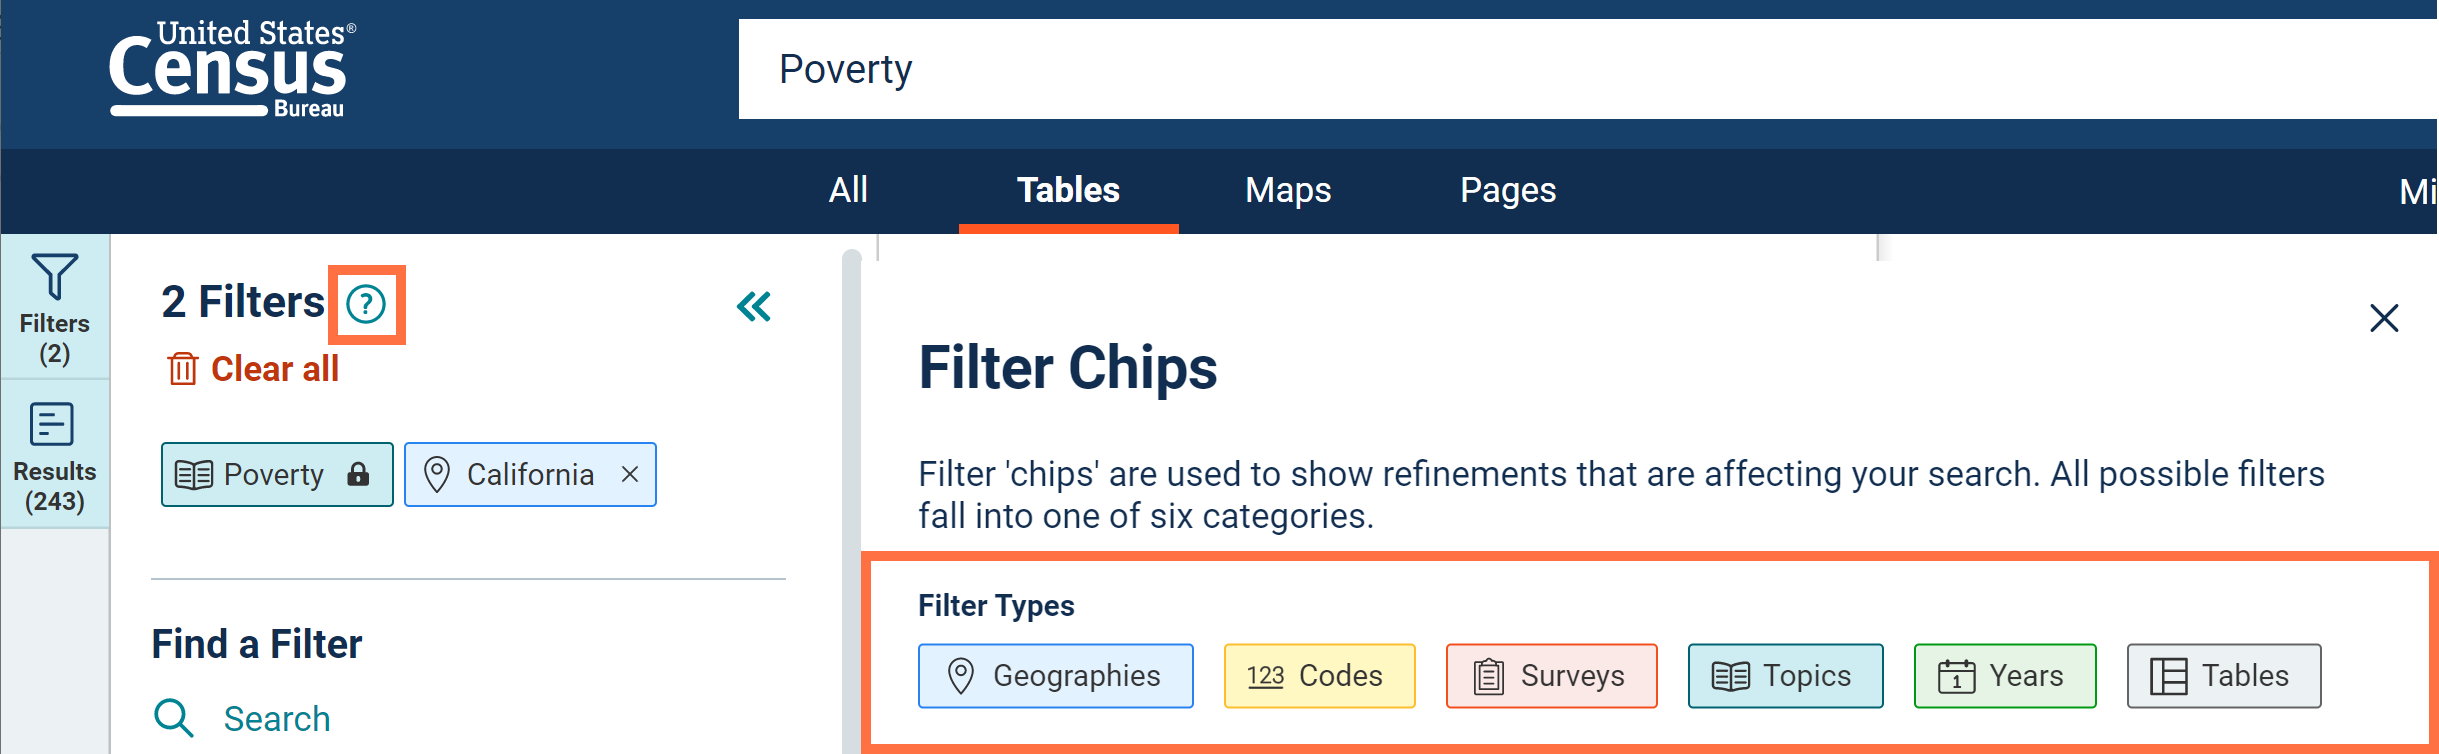
o A lock icon means the search criteria is powered by the text you entered in the single search bar and cannot be individually removed at the click of a button
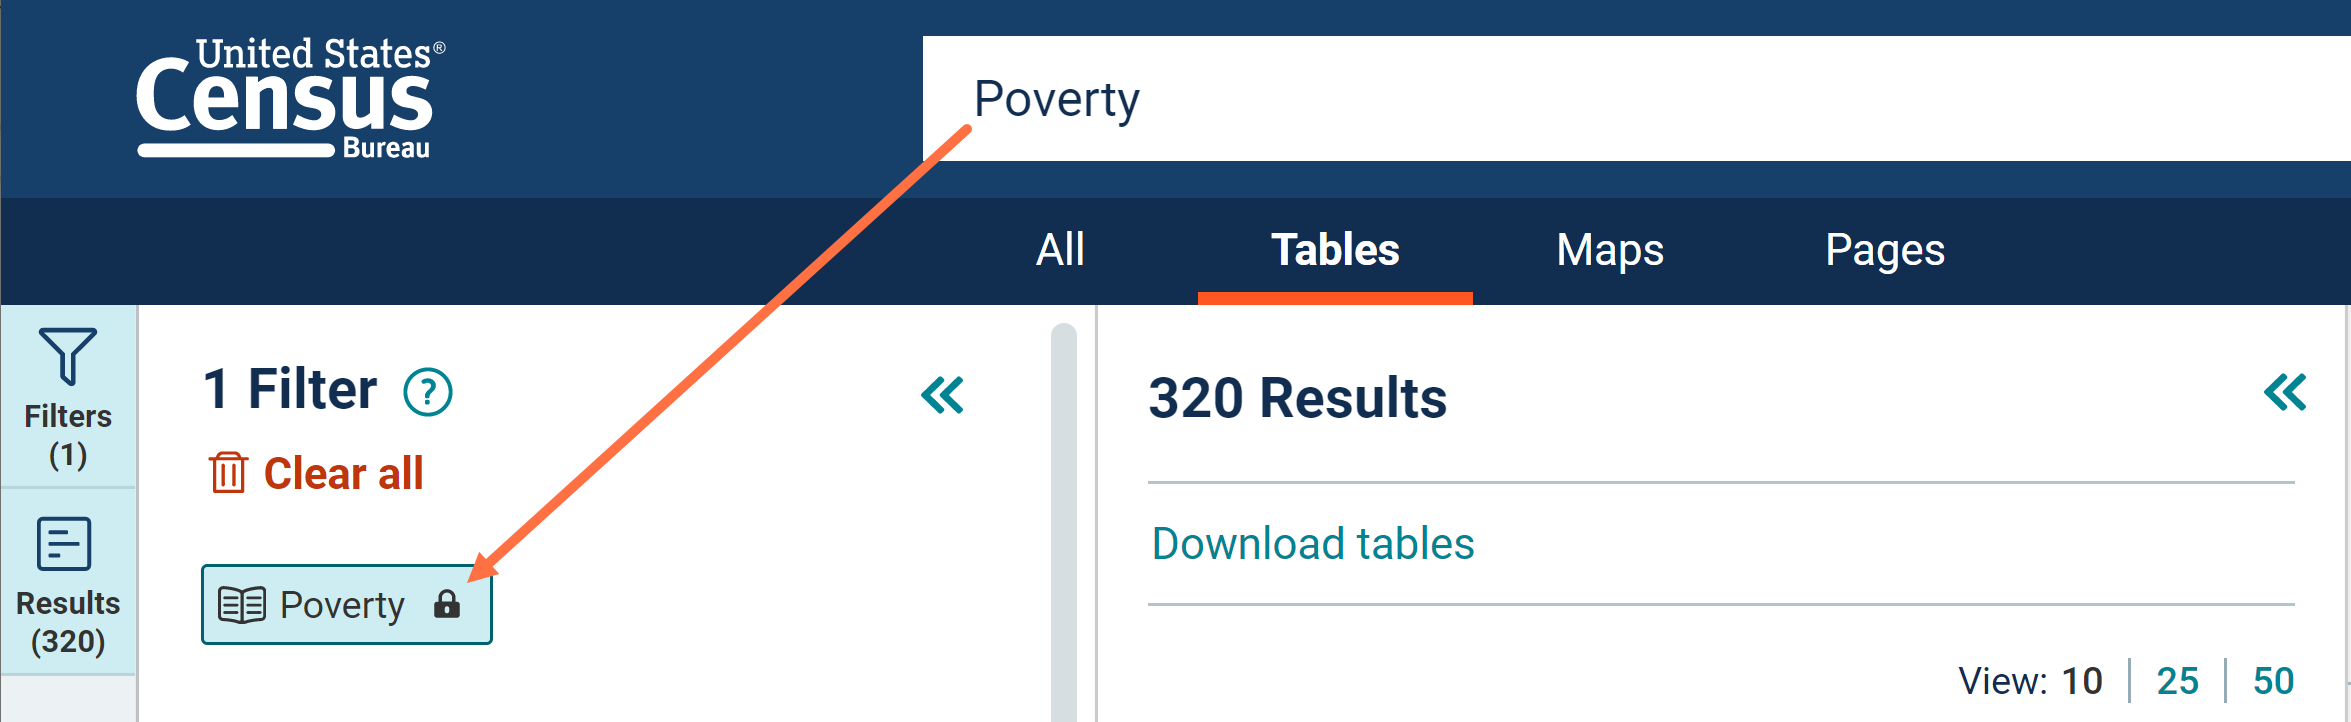
o An “x” means the search criteria is based on a filter check box you selected. You can click the “x” to individually remove the search criteria

Geography Filtering Enhancements
- New “Most Common Geographies” at the top of the list, with All Other Geographies in an alphabetized list below
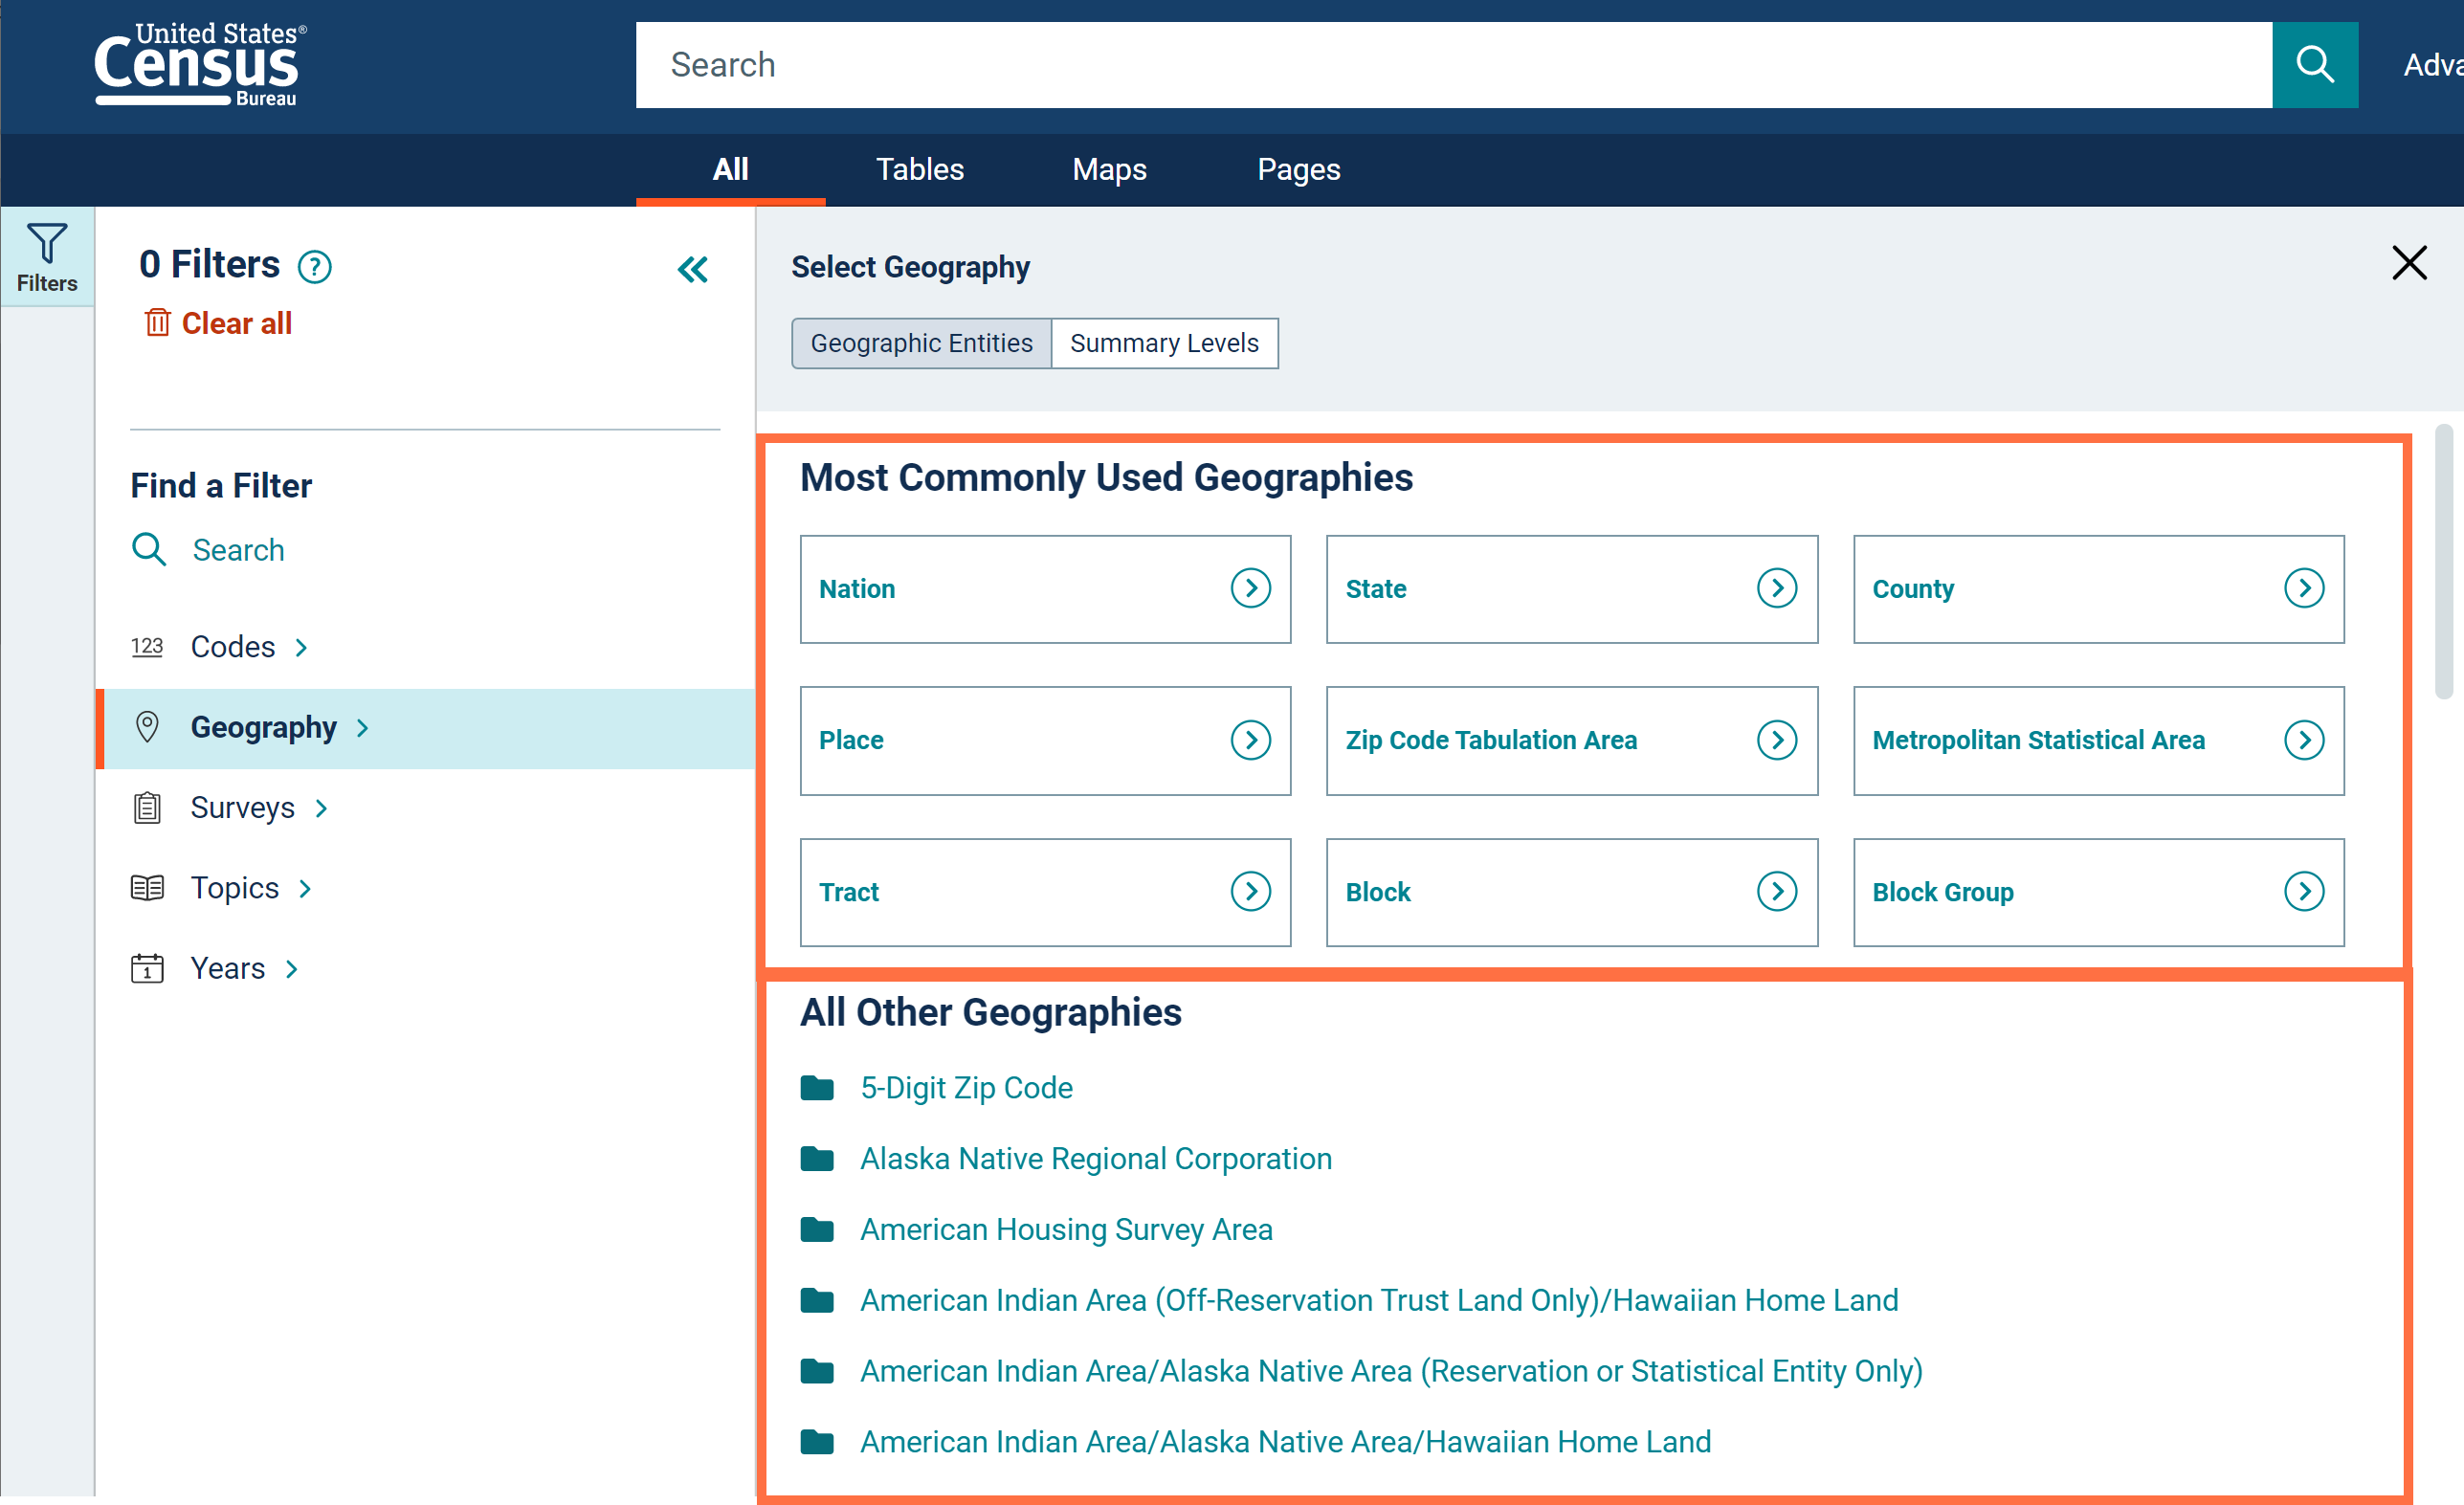
- Simplified process to select geographies that contain variants, such as metropolitan/micropolitan areas, urban areas, congressional districts, and state legislative districts.
For example, the screenshot below shows only one label for the Baltimore-Columbia-Towson, MD Metro Area. The previous version of the site showed separate labels for each of the 6 variants of the Baltimore metro area, requiring you to click on the label that was compatible with data you were seeking. This is now streamlined into one label that will provide data for all available variants, even if the geography name has changed over time.
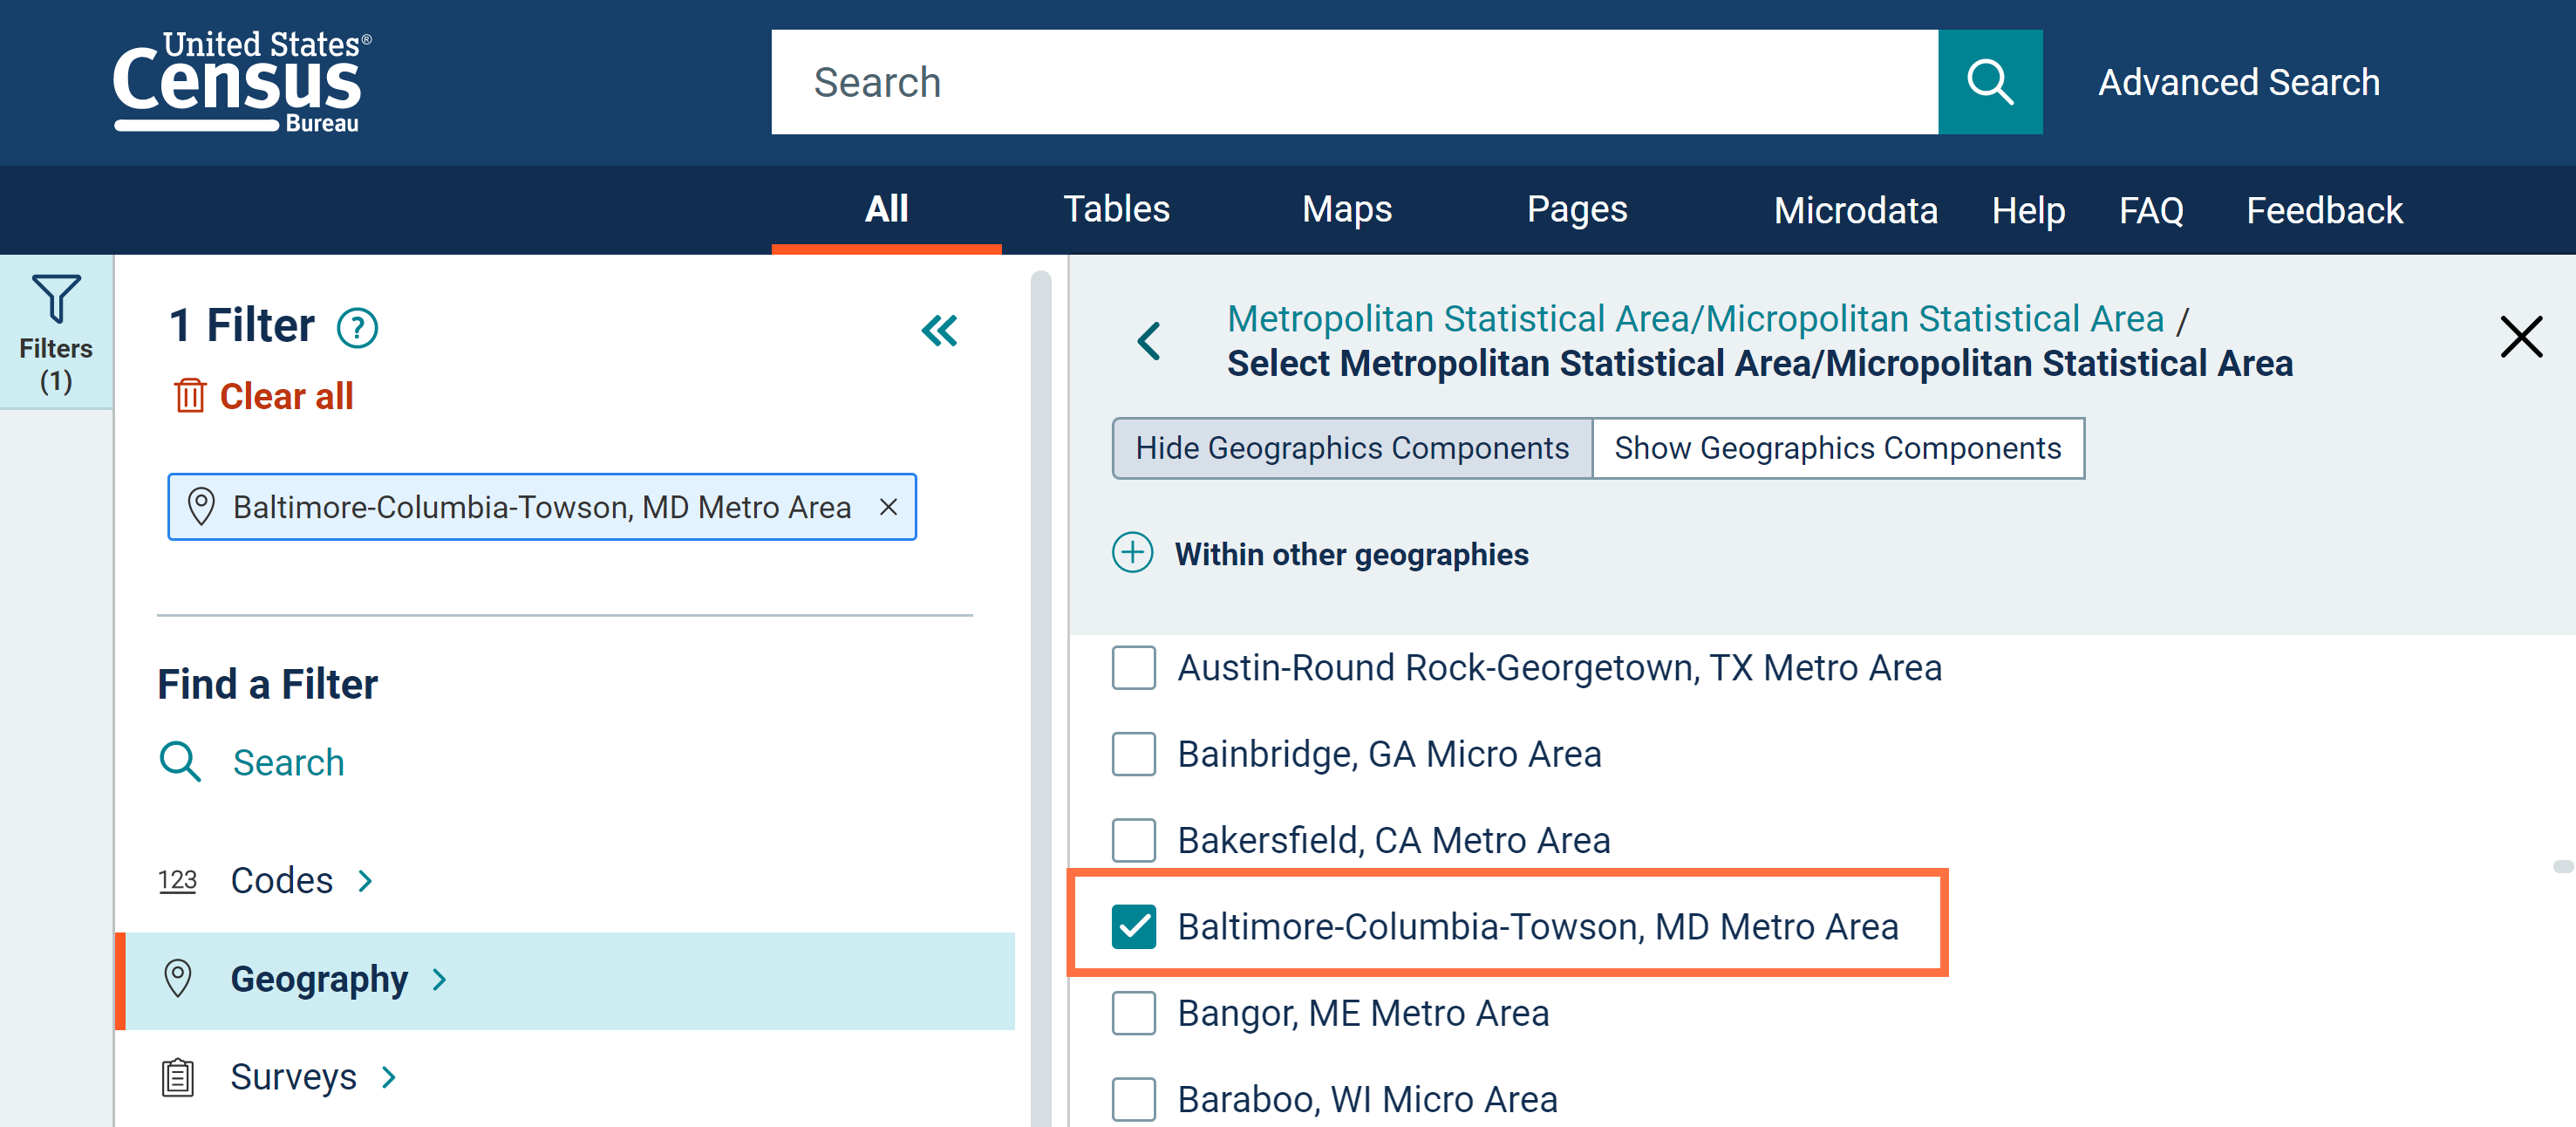
This feature is made possible by technical updates that implement a common geography ID, that uses “XX” in place of the variant code (e.g. M1, M2, M3, M4, etc.) For example, the common ID for the Baltimore Metro area is 310XX00US12580. Common IDs appear in data.census.gov URLs. Data downloads will continue to show the actual geography ID of the variant for the applicable data year, such as 310M600US12580.
- Continued access to geographies by summary level and geographic components
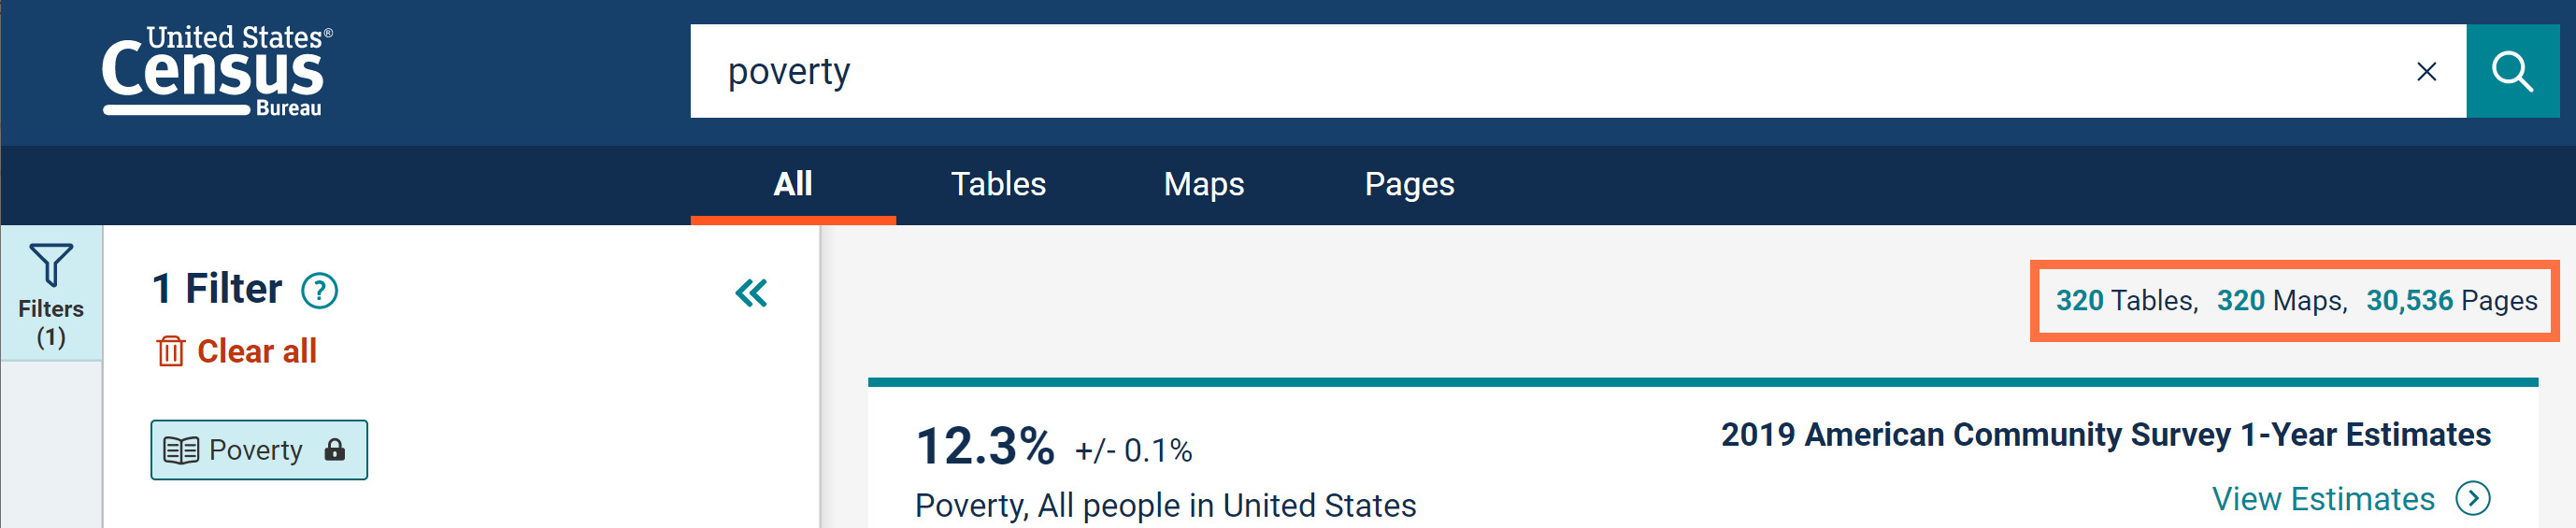
Result Page Upgrades
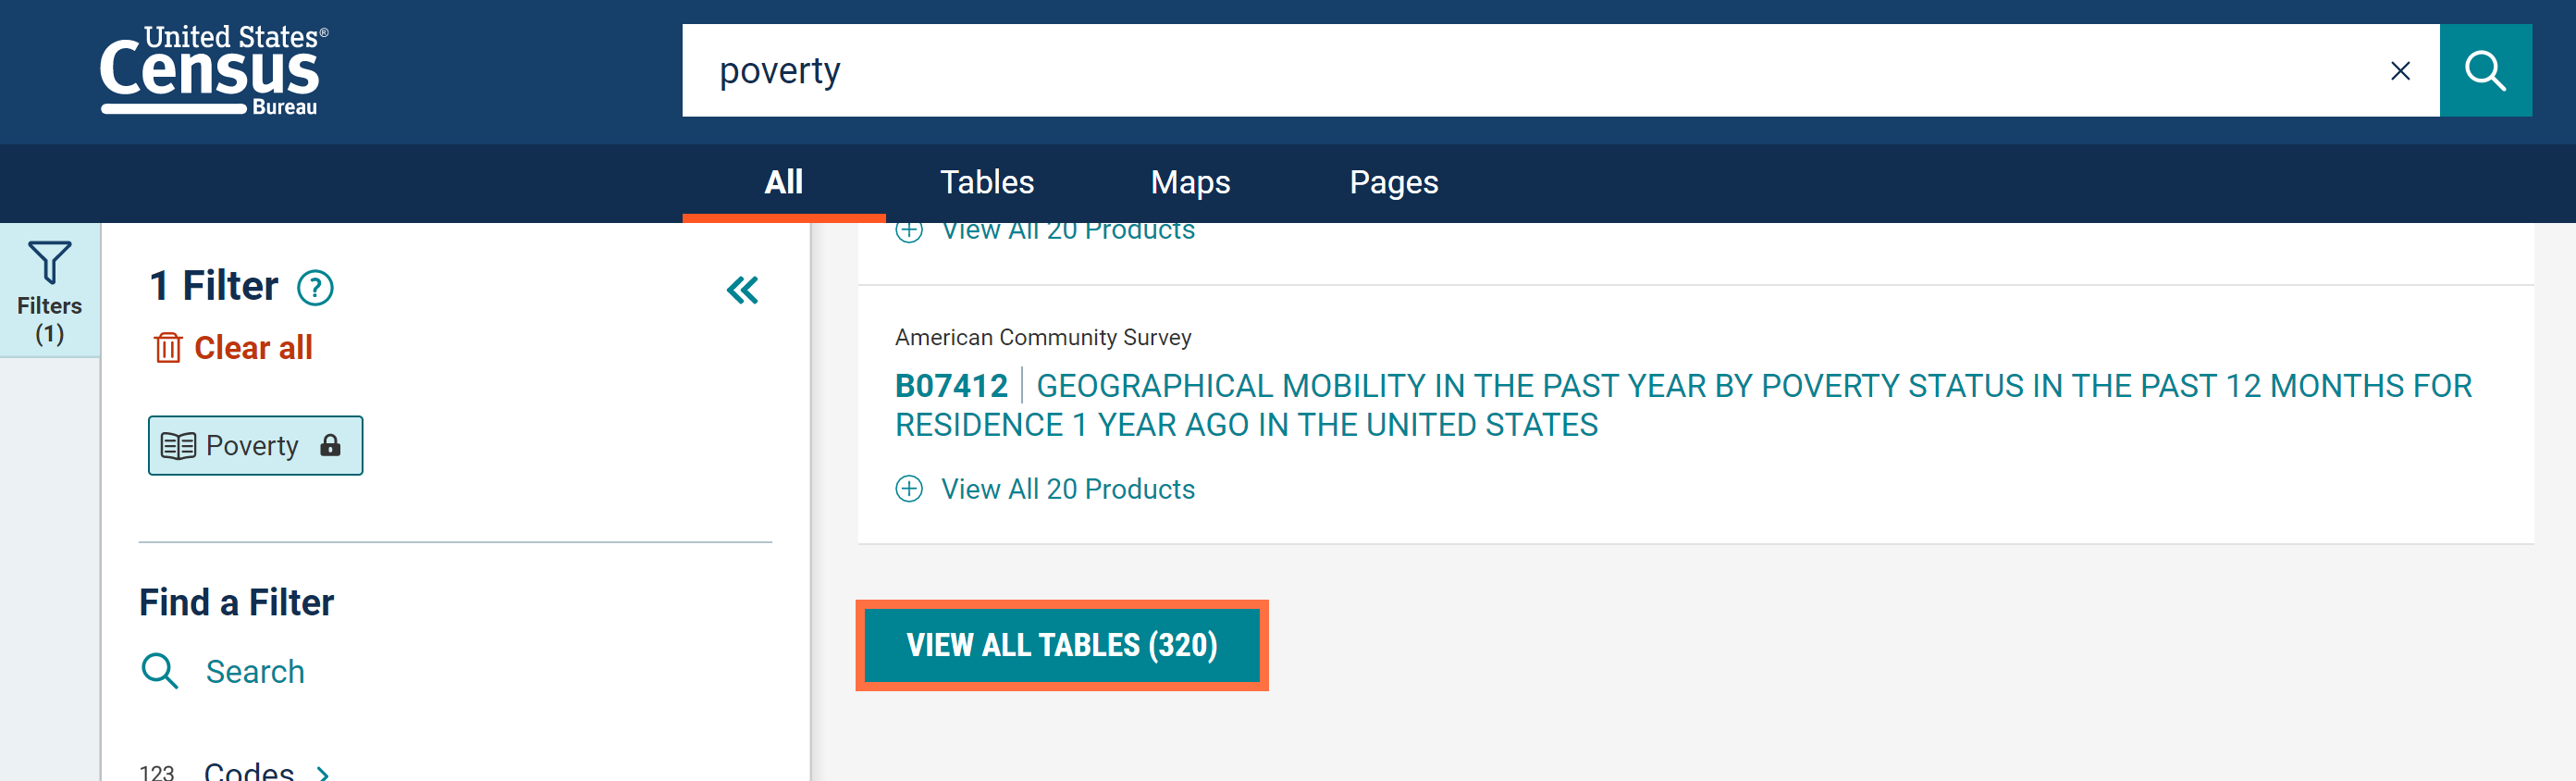
- Total number of tables, maps, and webpages are now listed individually
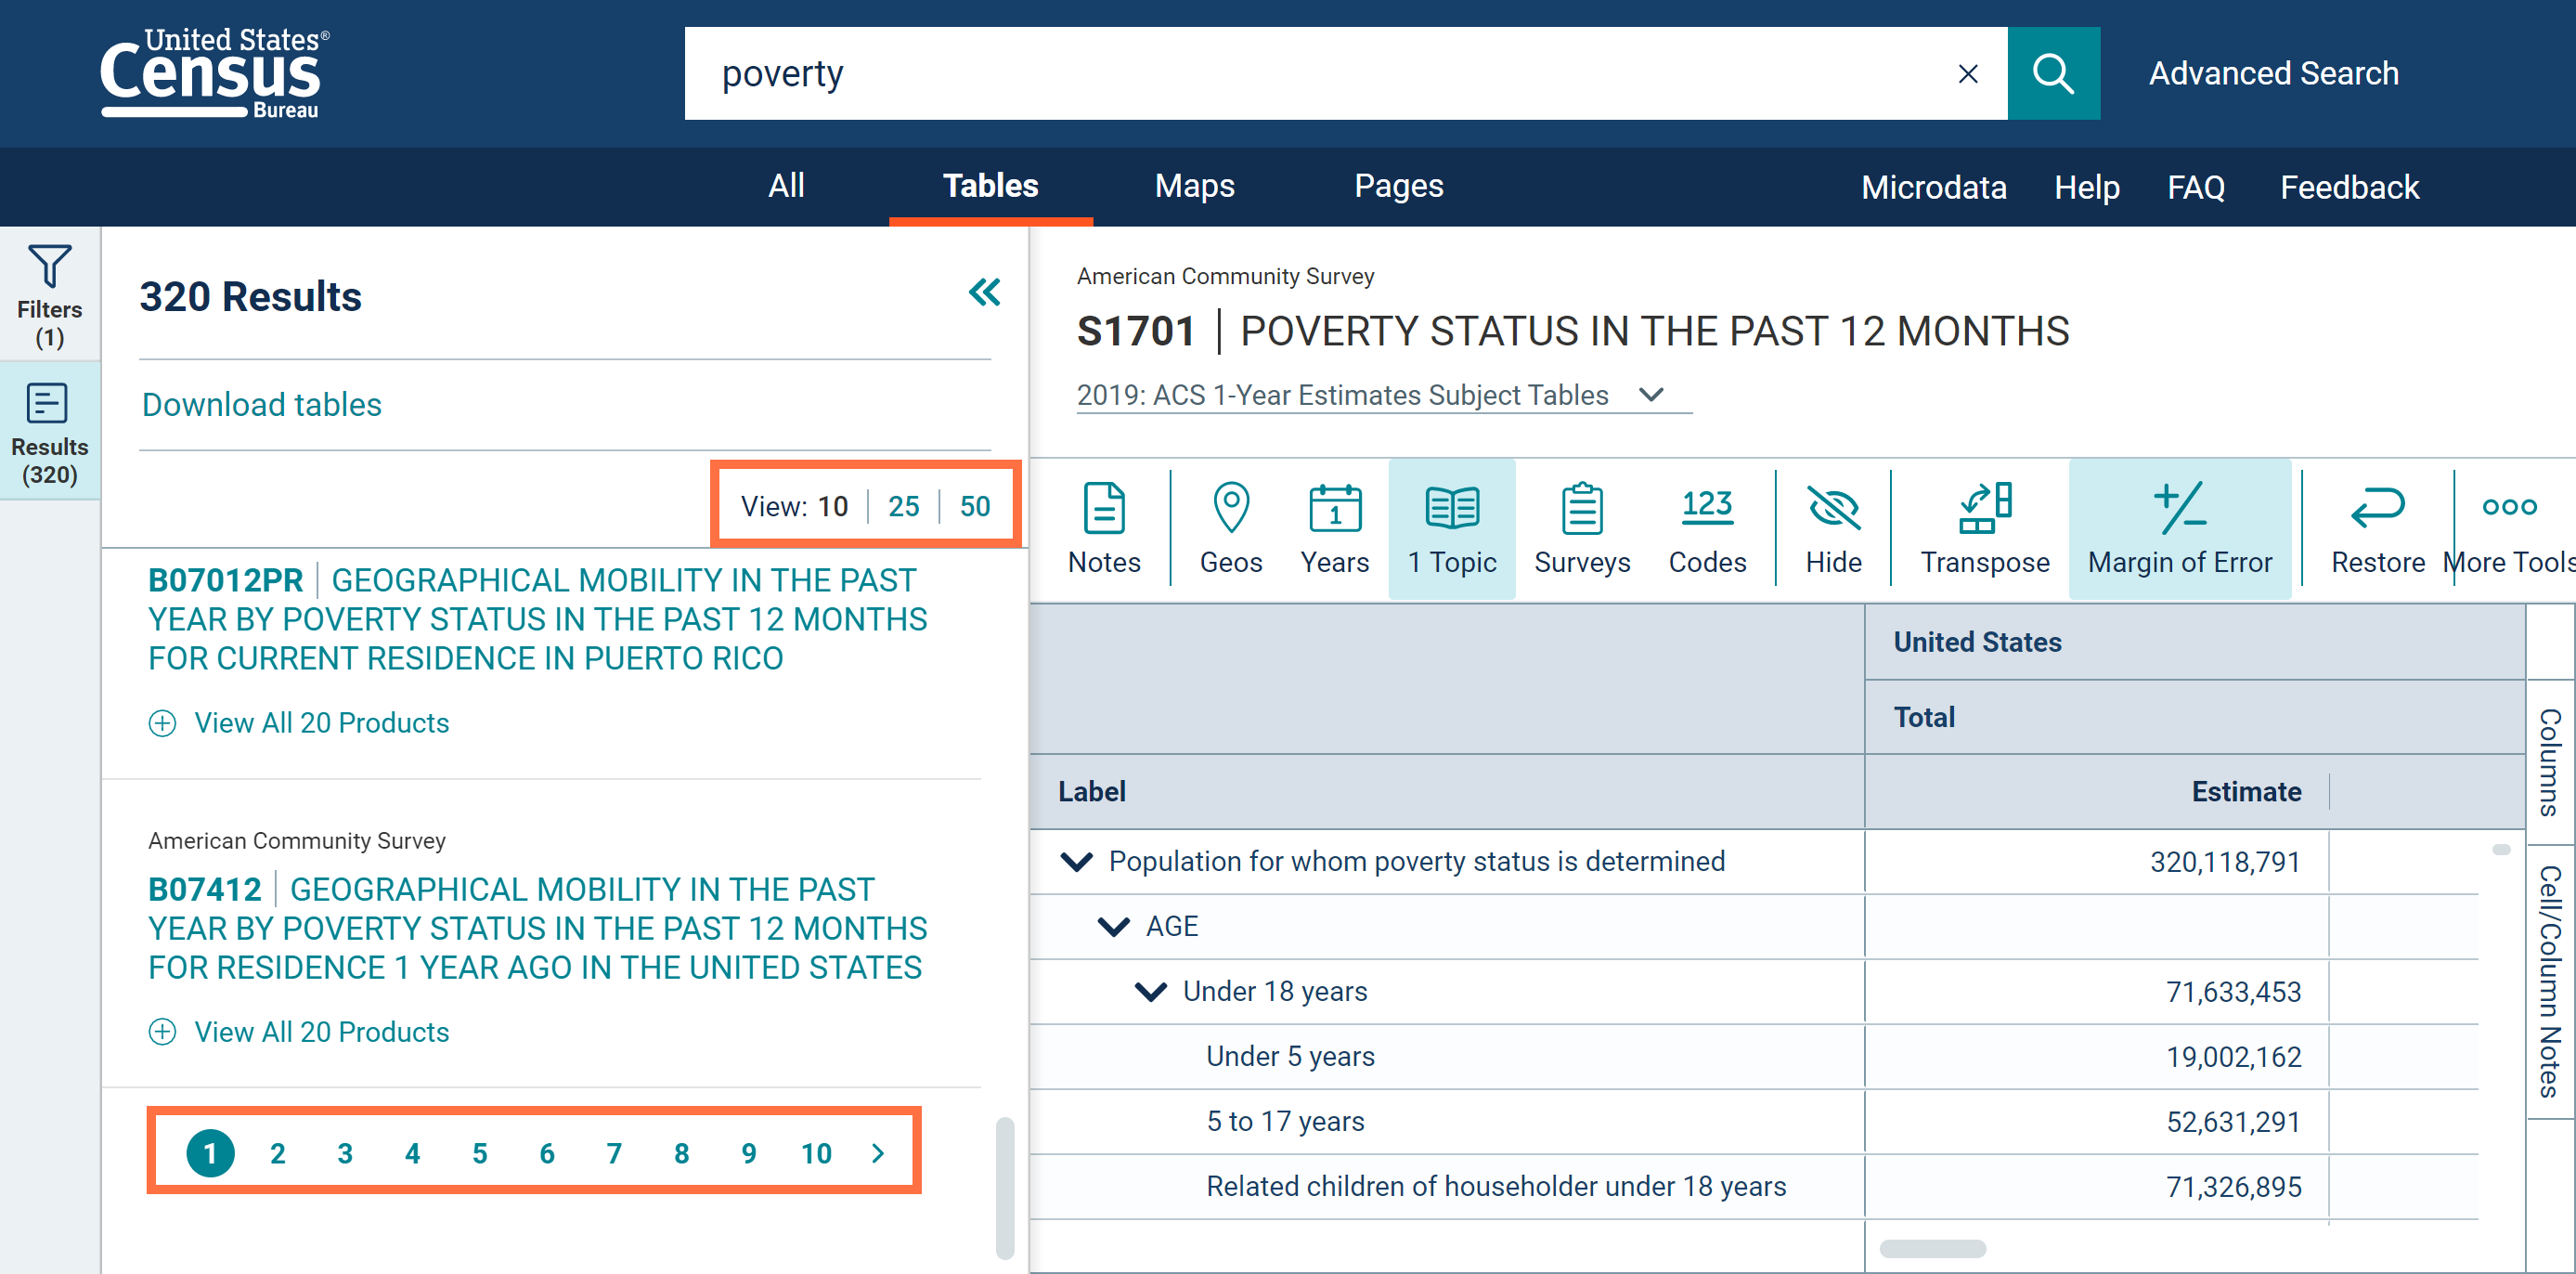
- Improved option to “View All Tables” that allows you to see the list of tables across your full screen, making it easier to scan a long list of results
- New options to page through results and view up to 25 or 50 table results at a time
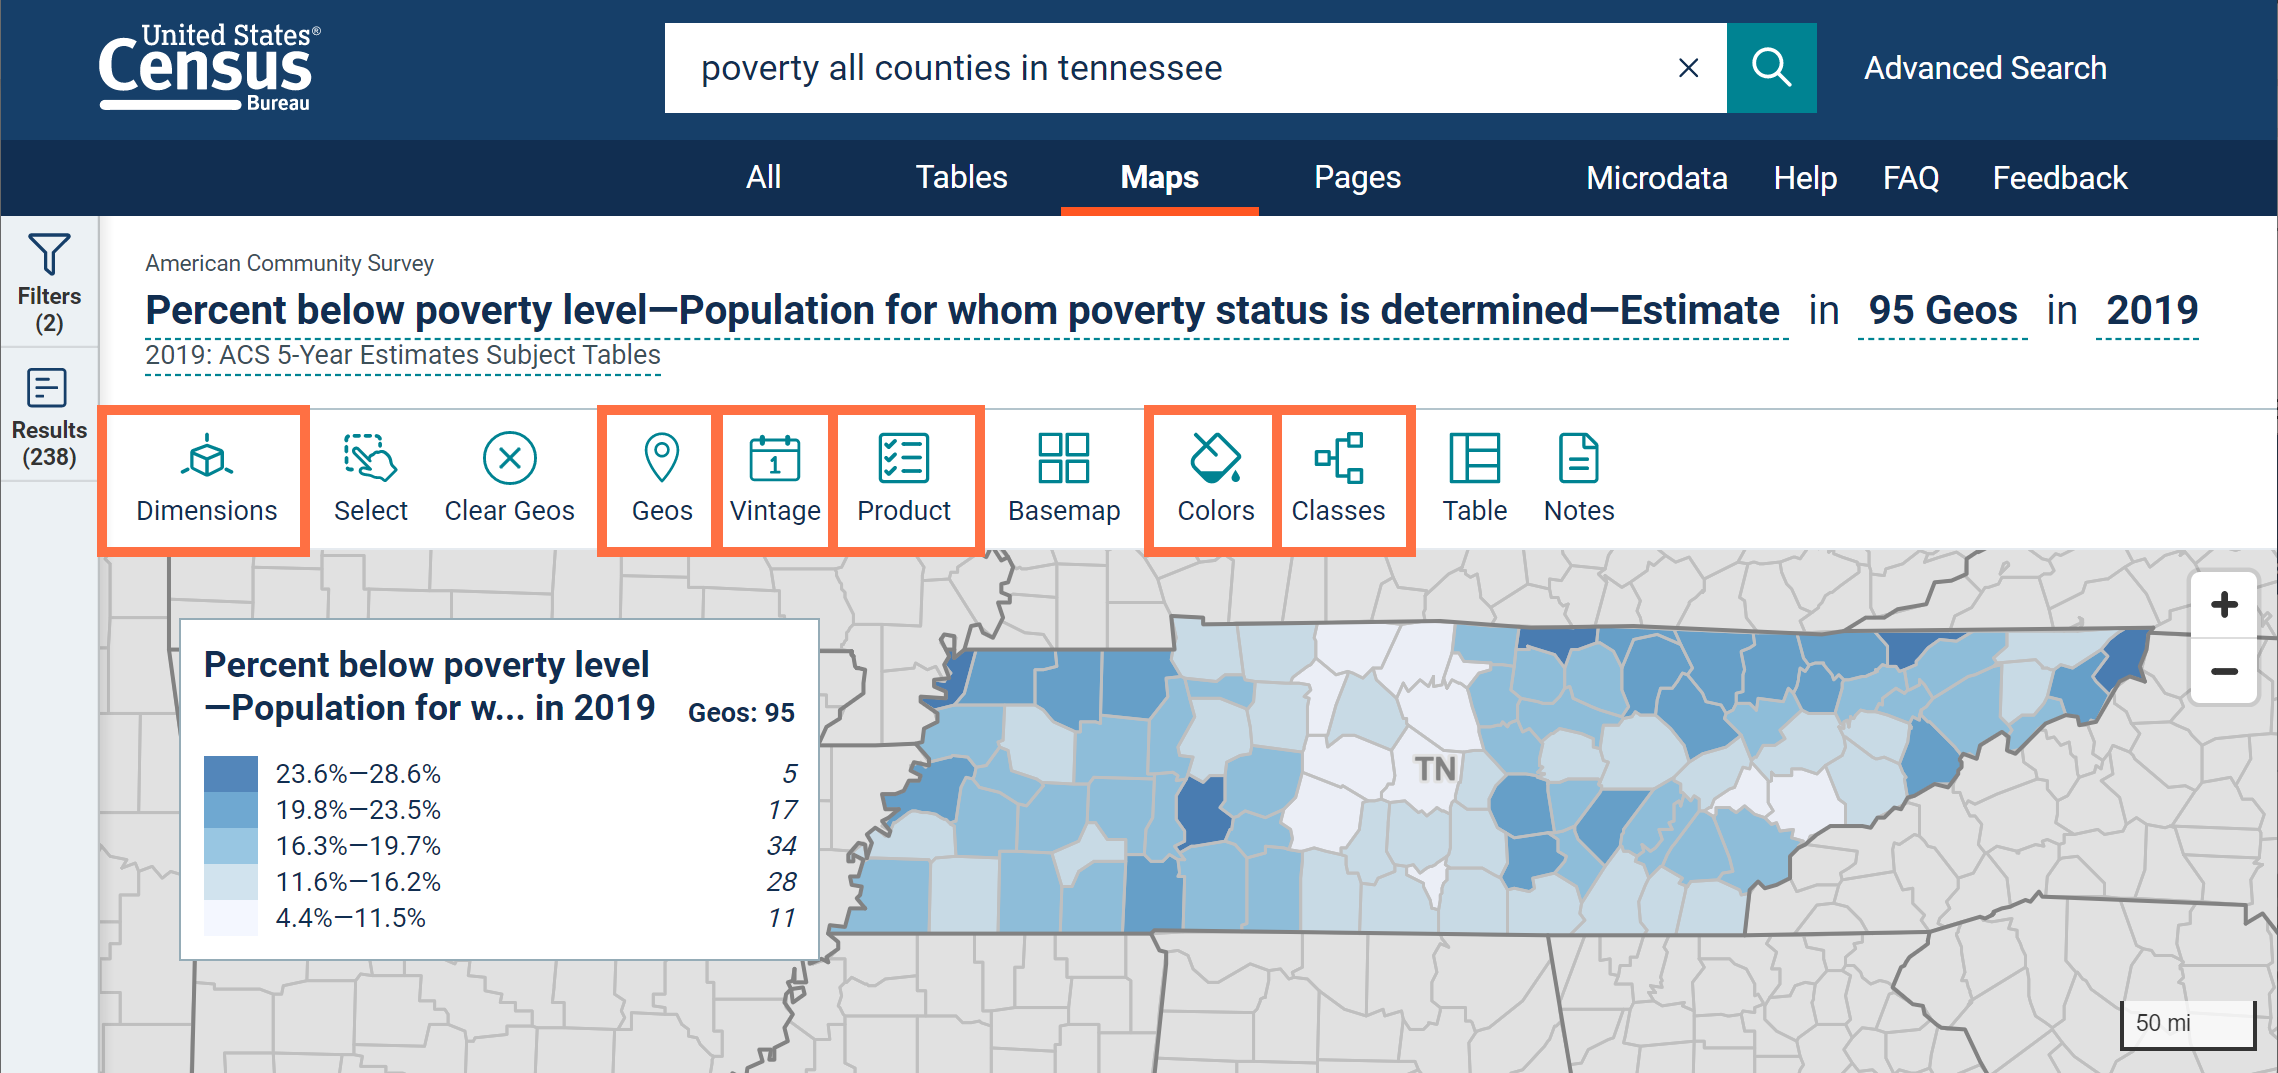
Mapping Refinements
- New Dimensions, Geos, Vintage, Product, Colors, and Classes buttons at the top of the map. These allow you to access the pre-existing options to customize your map all in one place.
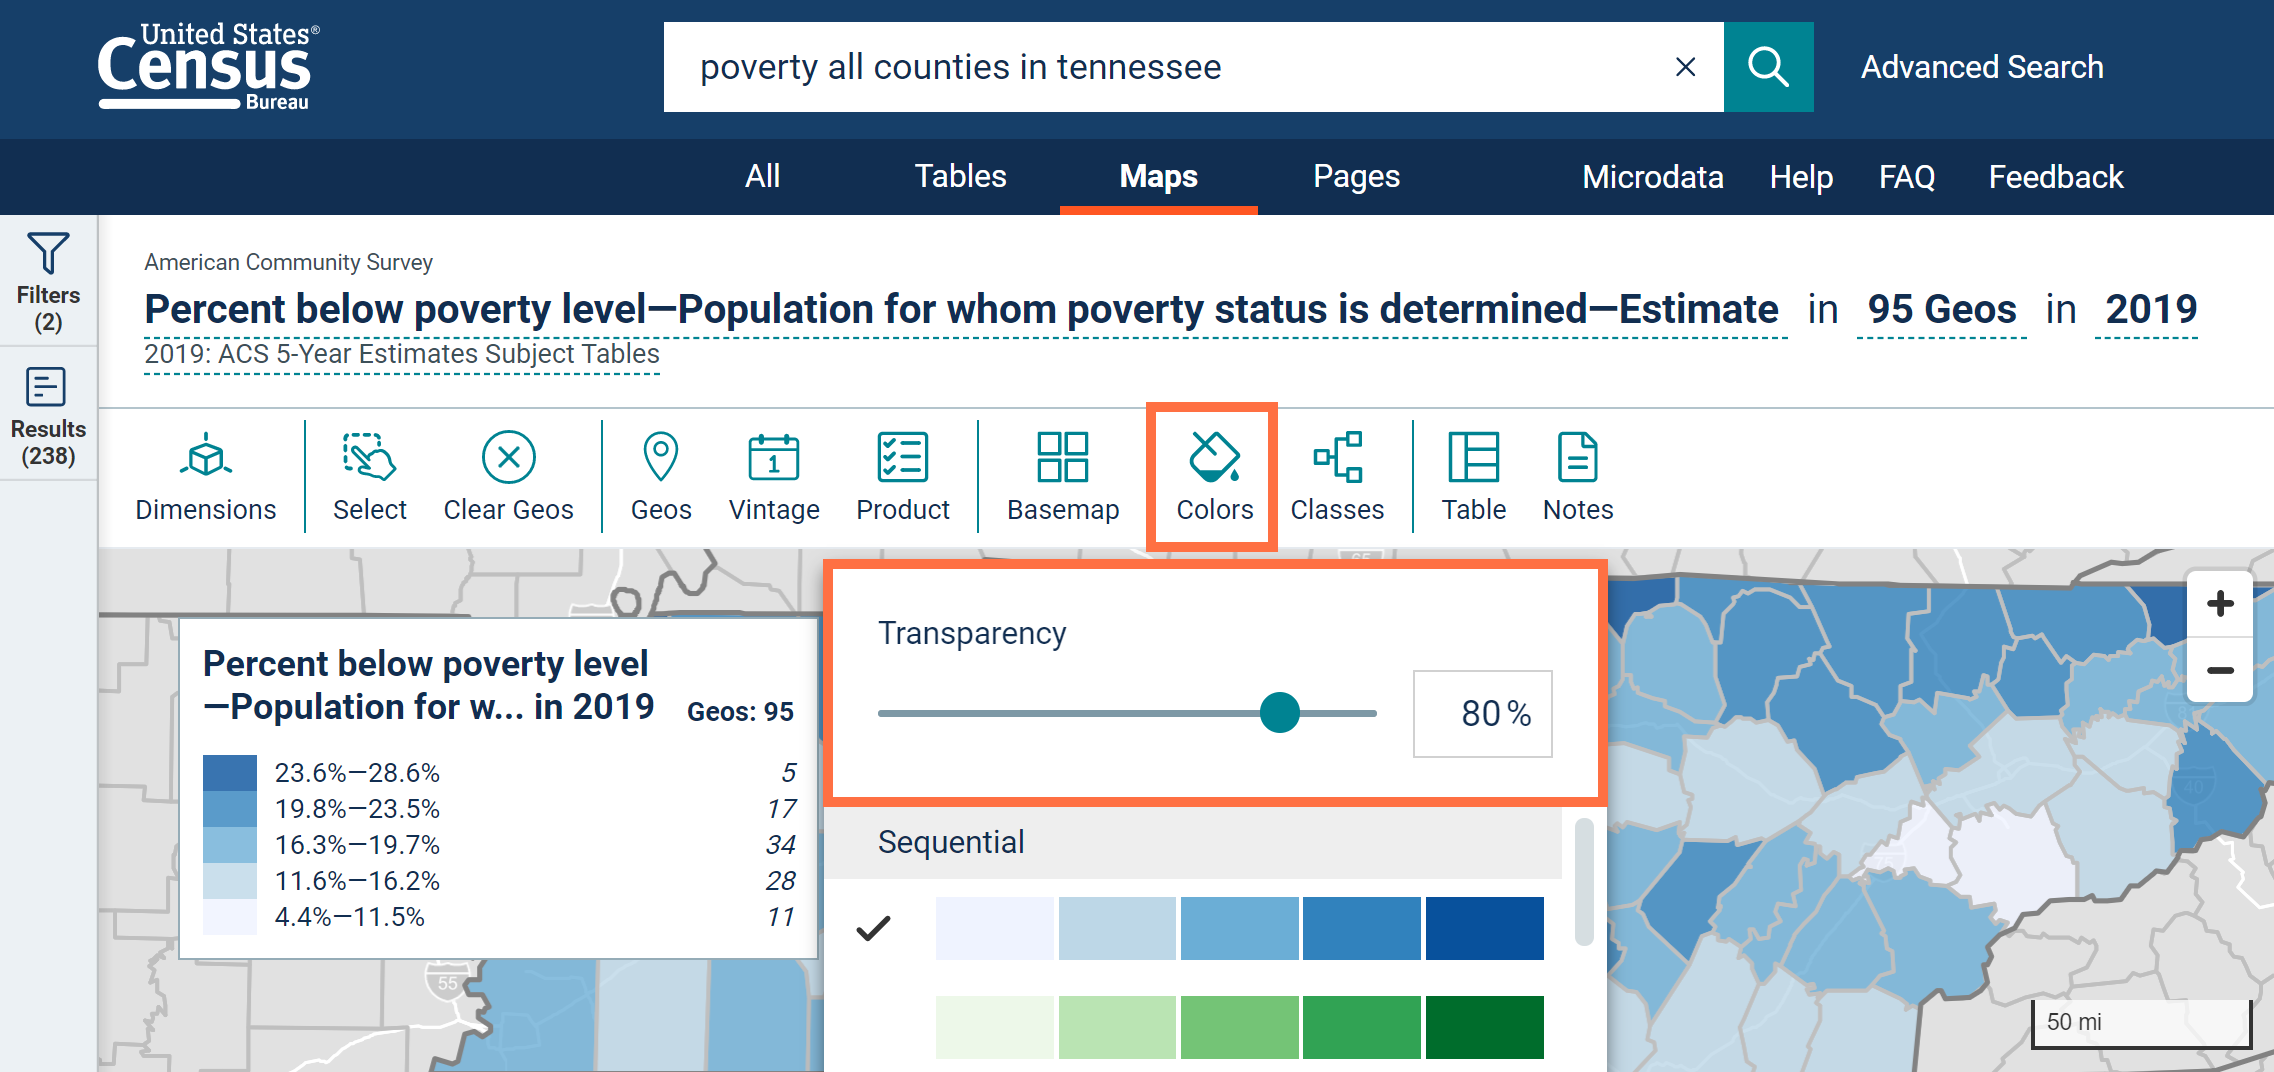
- New option to adjust the transparency of the colors in your thematic map
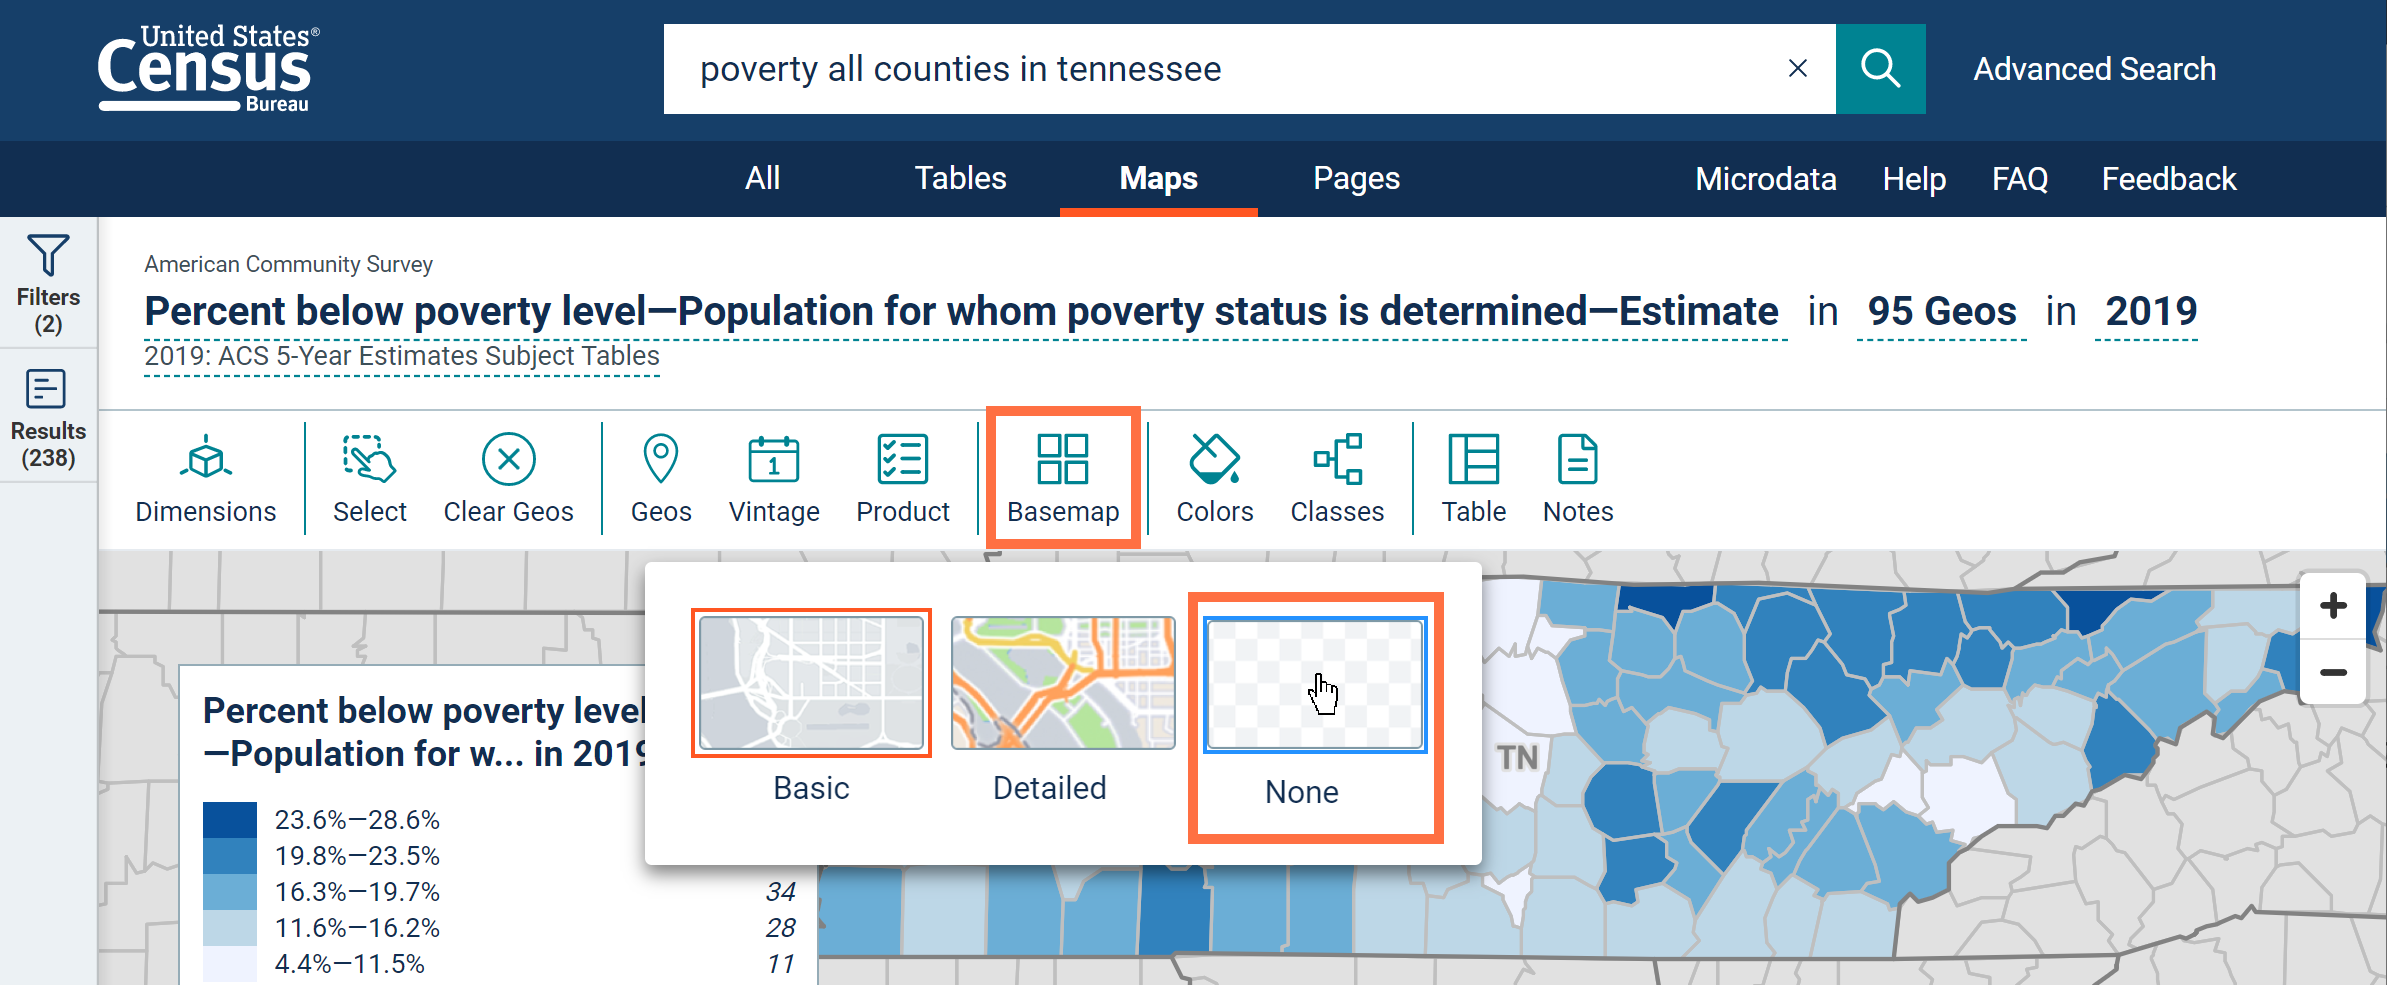
- New options to turn off the base map if you do not need to see streets or other reference features on the map.
Other Improvements
- Look and feel enhancements throughout the site
- Improved access to tables when using a mobile device. You can now use the controls at the top of the table that were previously only available in desktop mode.
- Fixes to 38 defects, including fixes that allow you to:
- Select individual ZIP Codes for ZIP Business Patterns tables
- View large economic tables that meet the display requirements
- Get data when using the geography selection for “All Economic Places in the U.S.”