
Official websites use .gov
A .gov website belongs to an official government organization in the United States.
Secure .gov websites use HTTPS
A lock (
) or https:// means you’ve safely connected to the .gov website. Share sensitive information only on official, secure websites.

Topics
Data & Maps
Surveys & Programs
Resource Library
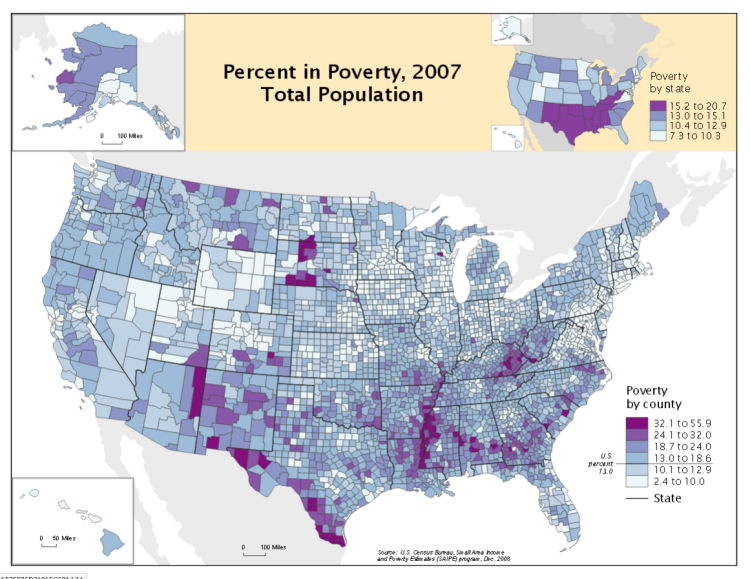
Release Highlights of 2007
Release Highlights of 2007
The following estimates are produced for 2007 from the Small Area Income and Poverty Estimates (SAIPE) program:
| Counties & States | School districts |
|---|---|
| all people in poverty | total population |
| children under age 18 in poverty | children ages 5 to 17 |
| related children ages 5 to 17 in families in poverty | related children ages 5 to 17 in families in poverty |
| children under age 5 in poverty (for states only) | |
| median household income |
Estimates are available in table format and in maps. These model-based estimates are produced for all school districts, counties and states of all population sizes. The estimates use data from the American Community Survey and fill in where direct survey estimates are not available. For an overview of the changes in methodology between the 2007 and prior estimates, see Estimation Procedure Changes.
The Release Summary of 2007 Estimates is available for counties and states and contains estimates with the highest and lowest estimated poverty rates and median household income in 2007. Estimates for counties/states in the tables may not be statistically different from estimates for other counties/states in the tables due to uncertainty in the estimates. Please see uncertainty for information associated with model-based estimates, and also general cautions about comparing model-based estimates.
Quantifying Uncertainty in State and County Estimates
The model-based estimates almost certainly differ from the figures that would result from administering the ACS to all households in the nation.
General Cautions About Comparing Estimates
View caution statements regarding comparing SAIPE estimates with other estimates.

Related Information
VISUALIZATION
State and County Maps 2007
Page Last Revised - October 8, 2021
✕
Is this page helpful?
 Yes
Yes
 No
No
 Yes
Yes
 No
No✕
NO THANKS
255 characters maximum
 255 characters maximum reached
✕
Thank you for your feedback.
Comments or suggestions?

Comments or suggestions?