
Census Microdata API User Guide

The purpose of this guide is to provide an overview of the U.S. Census Bureau’s microdata application programming interface (API) and walk through how to make queries. Through this guide, you will learn what the microdata API is, when to use it, and how to use it to get raw data and custom statistics.
Additional Concepts
Additional Concepts for Get Queries
In addition to the concepts described in the previous section, there is an additional concept that is related exclusively to get ?get= microdata API queries. If you would like to get results in Comma Separated Values (CSV) format, you may use the outputFormat parameter with these queries:
- &outputFormat=csv provides output in CSV format. When using this parameter in your web browser, it will create a CSV file that will appear in your downloaded files.
Example:
- &outputFormat=json provides output in JSON format.
By default, API results are also provided in JSON format when an output parameter is not added to the API call.
 |
The outputFormat parameter is only compatible with microdata API get queries. API calls are also case sensitive. Be mindful of capitalization when using &outputFormat=csv and &outputFormat=json |
Additional Concepts for Tabulate Queries
Here are more concepts that are related exclusively to tabulate ?tabulate= microdata API queries.
Because the microdata in the API are based on survey samples, you will need to apply a weight in order to create estimates that represent the overall population. Otherwise, the totals you calculate will only represent the people or households in the sample.
Include the weight function weight(insert weight) after ?tabulate= in your API queries. For example, the below query applies the person weight PWGTP to the tabulated variables, SEX and DIS. Including this in the query ensures that results represent the total number of people, and not just the number of people in the sample: api.census.gov/data/2019/acs/acs1/pums?tabulate=weight(PWGTP)&col+for&row+SEX&row+DIS&HICOV=2&for=state:11,24,51
The other weight for this dataset is the housing weight WGPT, which weights the statistics to provide data for the number of households.
Determining Which Weight to Use
Each variable in the microdata API has a suggested weight. If you are not sure which weight to use for your API query, check out the suggested weight for each variable in the API call.
For example, clicking the variable DIS in the 2019 ACS 1-Year PUMS shows the suggested weight is PWGTP, as shown in the screenshot below.
Figure 9: Variable Details for DIS Show Suggested Weight of PWGTP api.census.gov/data/2019/acs/acs1/pums/variables/DIS.json
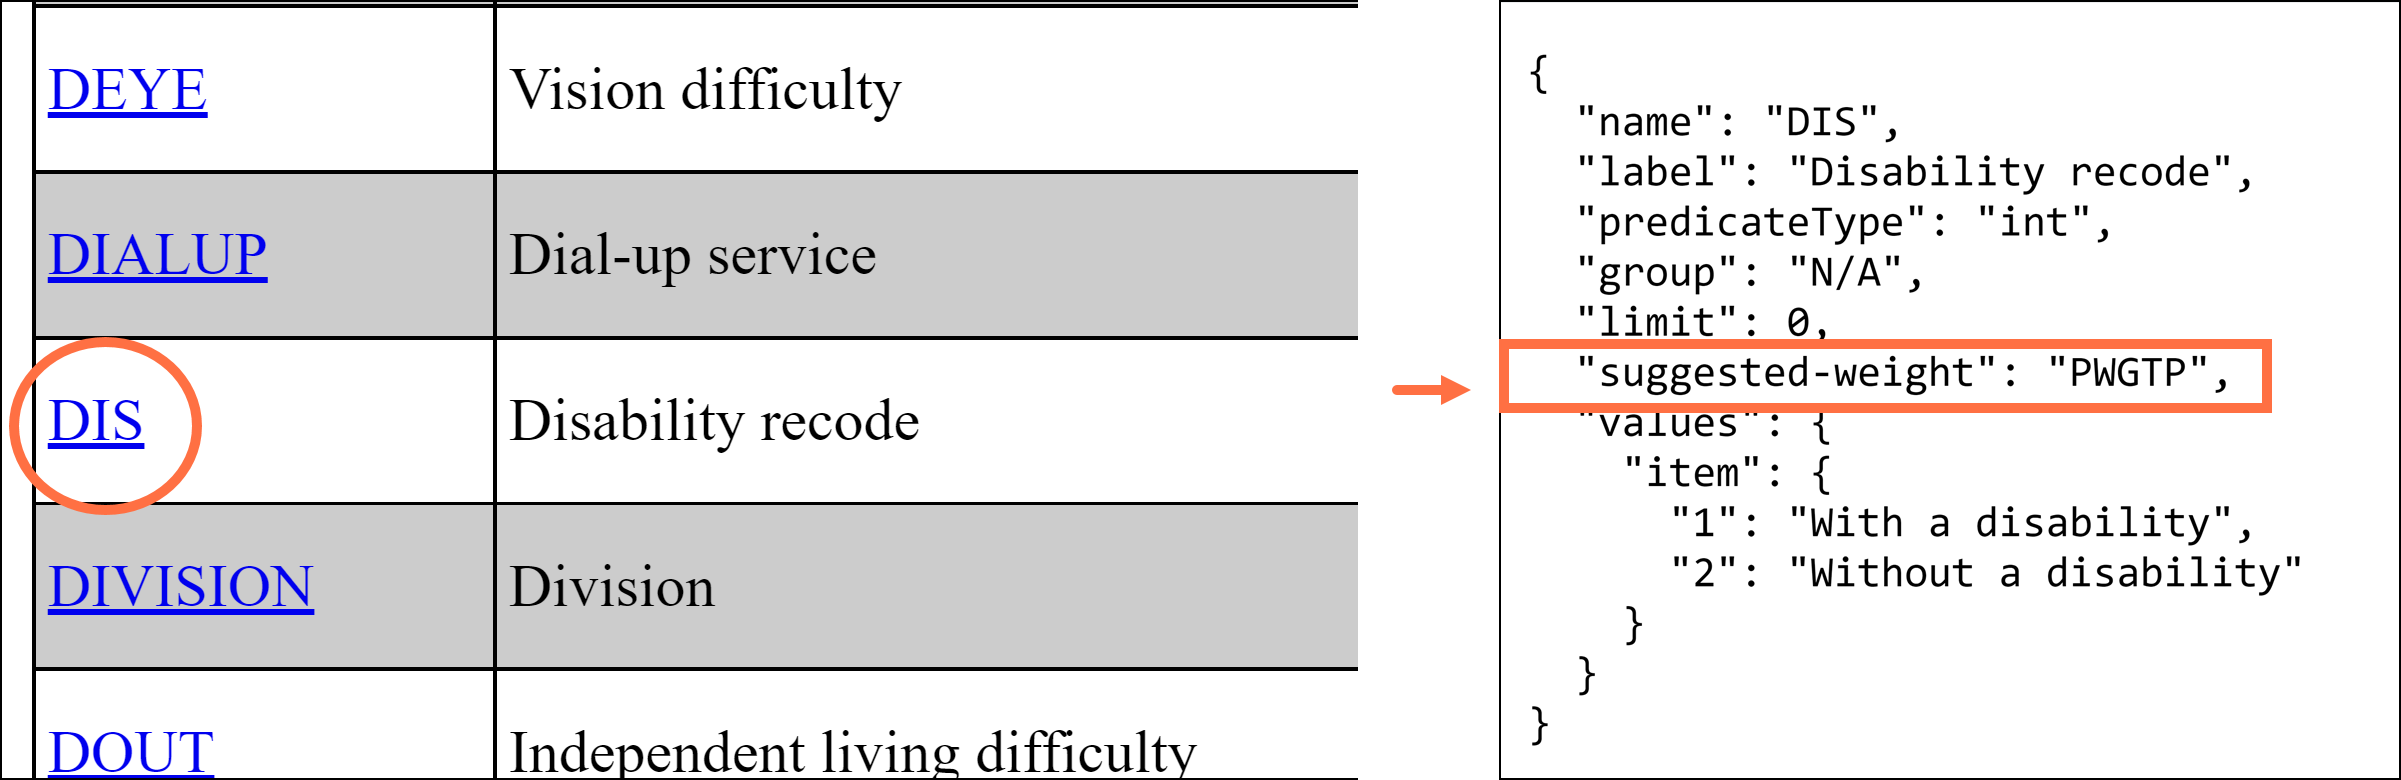
When all the variables in your query have the same suggested weight, it is recommended that you apply that weight in your API call.
Unweighted Counts
To get unweighted counts, simply omit the weight function from your API query. This will tell you the sample size that the custom statistics are based on.
The goal of a tabulate API query is to create custom statistics in a table format. To create these custom statistics, you must specify the format of your results by placing variables in the columns and/or rows of your tabulate request.
Use the predicates &col+ and &row+ to place variables in the columns and rows. For example, in this request: api.census.gov/data/2019/acs/acs1/pums?tabulate=weight(PWGTP)&col+SEX&row+DIS
- &col+SEX places the sex variable in the columns
- &row+DIS places the disability variable in the rows
You can see this reflected in the results for this API call:
[[{"SEX": "1"}, {"SEX": "2"},"DIS"],
[21099249,22181817,"1"],
[140495023,144463434,"2"]]
The first row of the API results tells us the format of our custom table. In this layout, the first column provides data for sex code 1 (male), the second column provides data for sex code 2 (female), and the third column indicates the disability code that each row refers to. The first row of data provides results for people with a disability (DIS=1) and the second row of data provides results for people without a disability (DIS=2).
The results tell us based on the 2019 ACS 1-Year PUMS, in the U.S. there were approximately:
- 21,099,249 men and 22,181,817 women with a disability
- 140,495,023 men and 144,463,434 women without a disability
Determining How to Place Variables in Columns and Rows
All variables that you place in the columns and rows will be cross tabulated by default. This means that placing the same set of variables in different combinations of columns and rows will provide the same set of statistics in a different layout. In other words, the decision on whether to include a variable in a column or a row is primarily cosmetic and will affect how you read the results, not the statistics themselves.
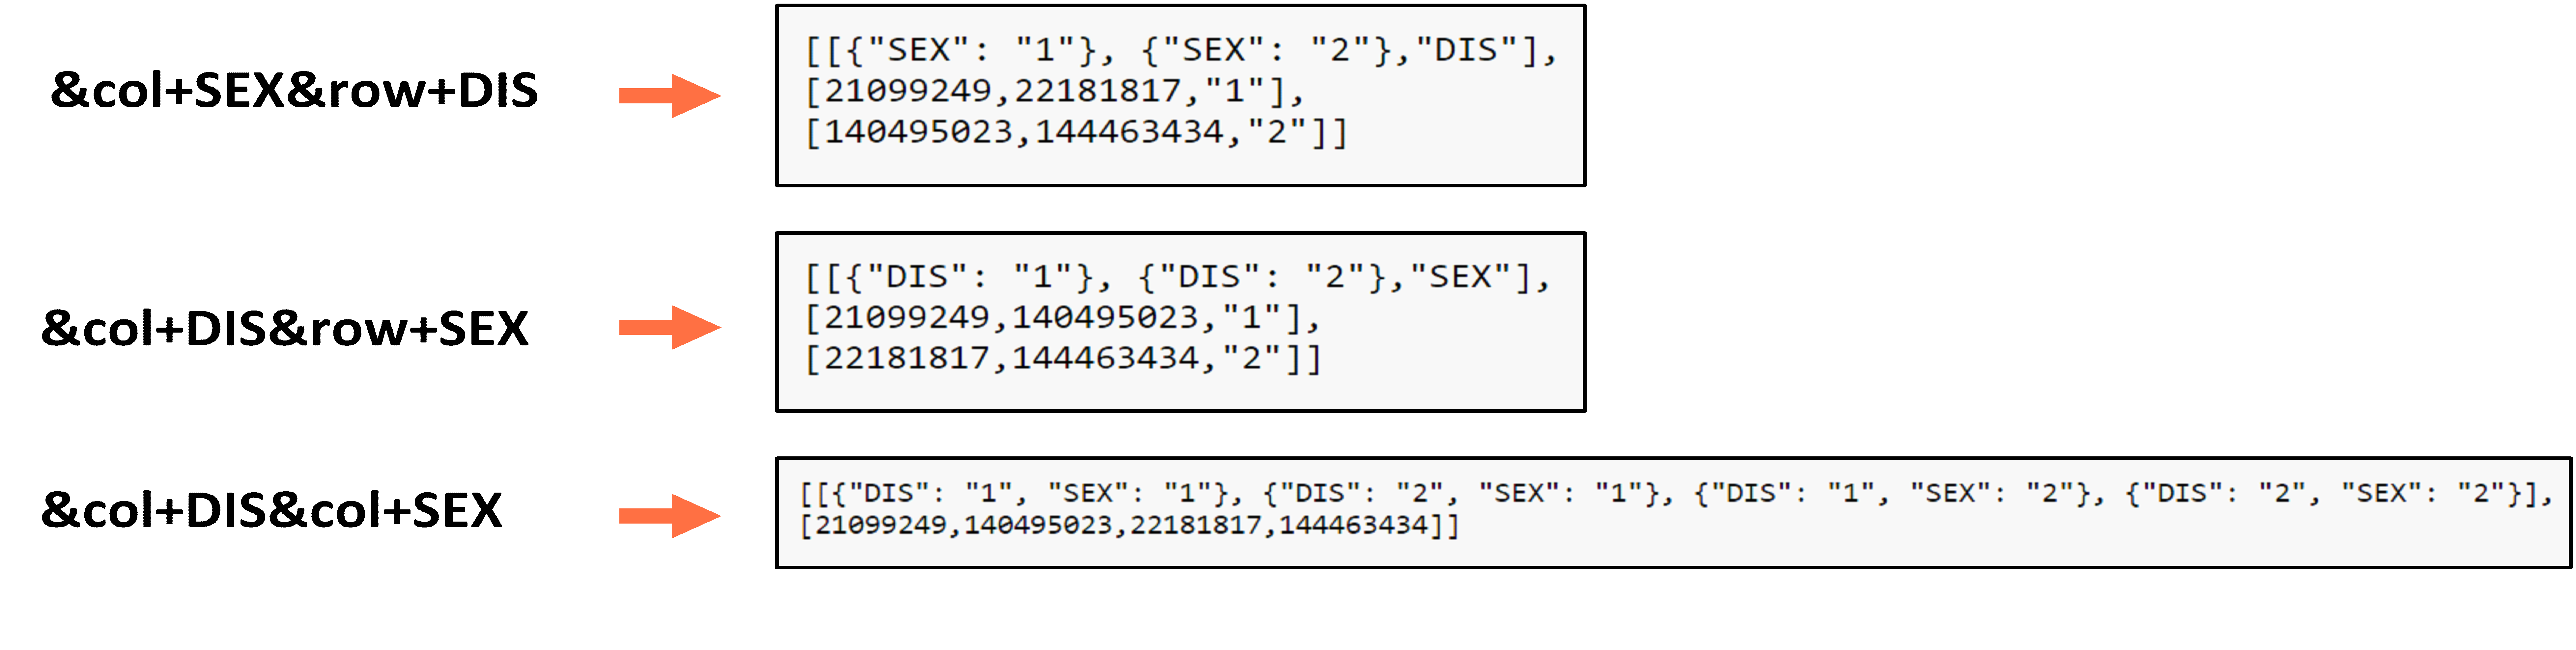
For example, in the screenshot below, you can see how different ways of placing the variables SEX and DIS in the columns and rows provides the same set of statistics in slightly different layouts.
Figure 10: Custom Statistics for Sex by Disability in Different Layout Options api.census.gov/data/2019/acs/acs1/pums?tabulate=weight(PWGTP)&col+SEX&row+DIS api.census.gov/data/2019/acs/acs1/pums?tabulate=weight(PWGTP)&col+DIS&row+SEX api.census.gov/data/2019/acs/acs1/pums?tabulate=weight(PWGTP)&col+DIS&col+SEX
To get results for more than one geography, you must include the predicate &col+for or &row+for in your API call. This will place the geographies in the row or column or your table.
For example, when you add &col+for to the API query below, it provides data for your geographies in the columns: api.census.gov/data/2019/acs/acs1/pums?tabulate=weight(PWGTP)&col+for&row+SEX&row+DIS&for=state:11,24,51
The results for this query provide sex by disability data for the District of Columbia (state=11) in the first column, Maryland (state=24) in the second column and Virginia (state=51) in the third column.
[[{"state": "11"}, {"state": "24"}, {"state": "51"},"SEX", "DIS"],
[37840,327485,514387,"1","1"],
[46182,377087,544915,"2","1"],
[298100,2601638,3686473,"1","2"],
[323627,2739470,3789744,"2","2"]]
If you omit &col+for from this query, you will get sex by disability totals for the combined area spanning DC, MD, and VA. It will not provide results for each state individually.
The default is that the microdata API will give you results for the total number of people or housing units in your universe. Some variables allow you to also get results for averages by including avg(insert continuous variable) in your API query. For example, adding avg(AGEP) to this query after the weight allows you to look at the average age of men and women with disabilities compared to those without disabilities: api.census.gov/data/2019/acs/acs1/pums?tabulate=weight(PWGTP),avg(AGEP)&col+SEX&row+DIS
Be sure to place the average function after the tabulate parameter, using a comma to separate the weight function from the average function.
The microdata API allows you to calculate averages for continuous variables. It does not support use of the average function for categorical variables, because in many cases, the calculation of an average would not make sense or would be inappropriate for these variables.
You may also need to restrict your universe to calculate a meaningful average. Many variables will have values of 0 or -1 to indicate people or households that are not in the universe, and you will likely want to exclude these values from your universe when calculating an average.
Variables in the microdata API can be categorical or continuous variables. Categorical variables have a set number of pre-defined data values that are all individually listed in the “Values” section after you click the variable in the Discovery Tool. HICOV is an example of a categorical variable, where a value of 1 represents people with health insurance coverage and a value of 2 represents people without health insurance coverage.
Continuous variables will have numerical output that falls within a specified range of values. You know you are working with a continuous variable anytime you see minimum and maximum numbers defined in the “Values” section after clicking the variable in the Discovery Tool (see Figure 11).
Figure 11: JWMNP is a Continuous Variable That is Defined with a Range of Values
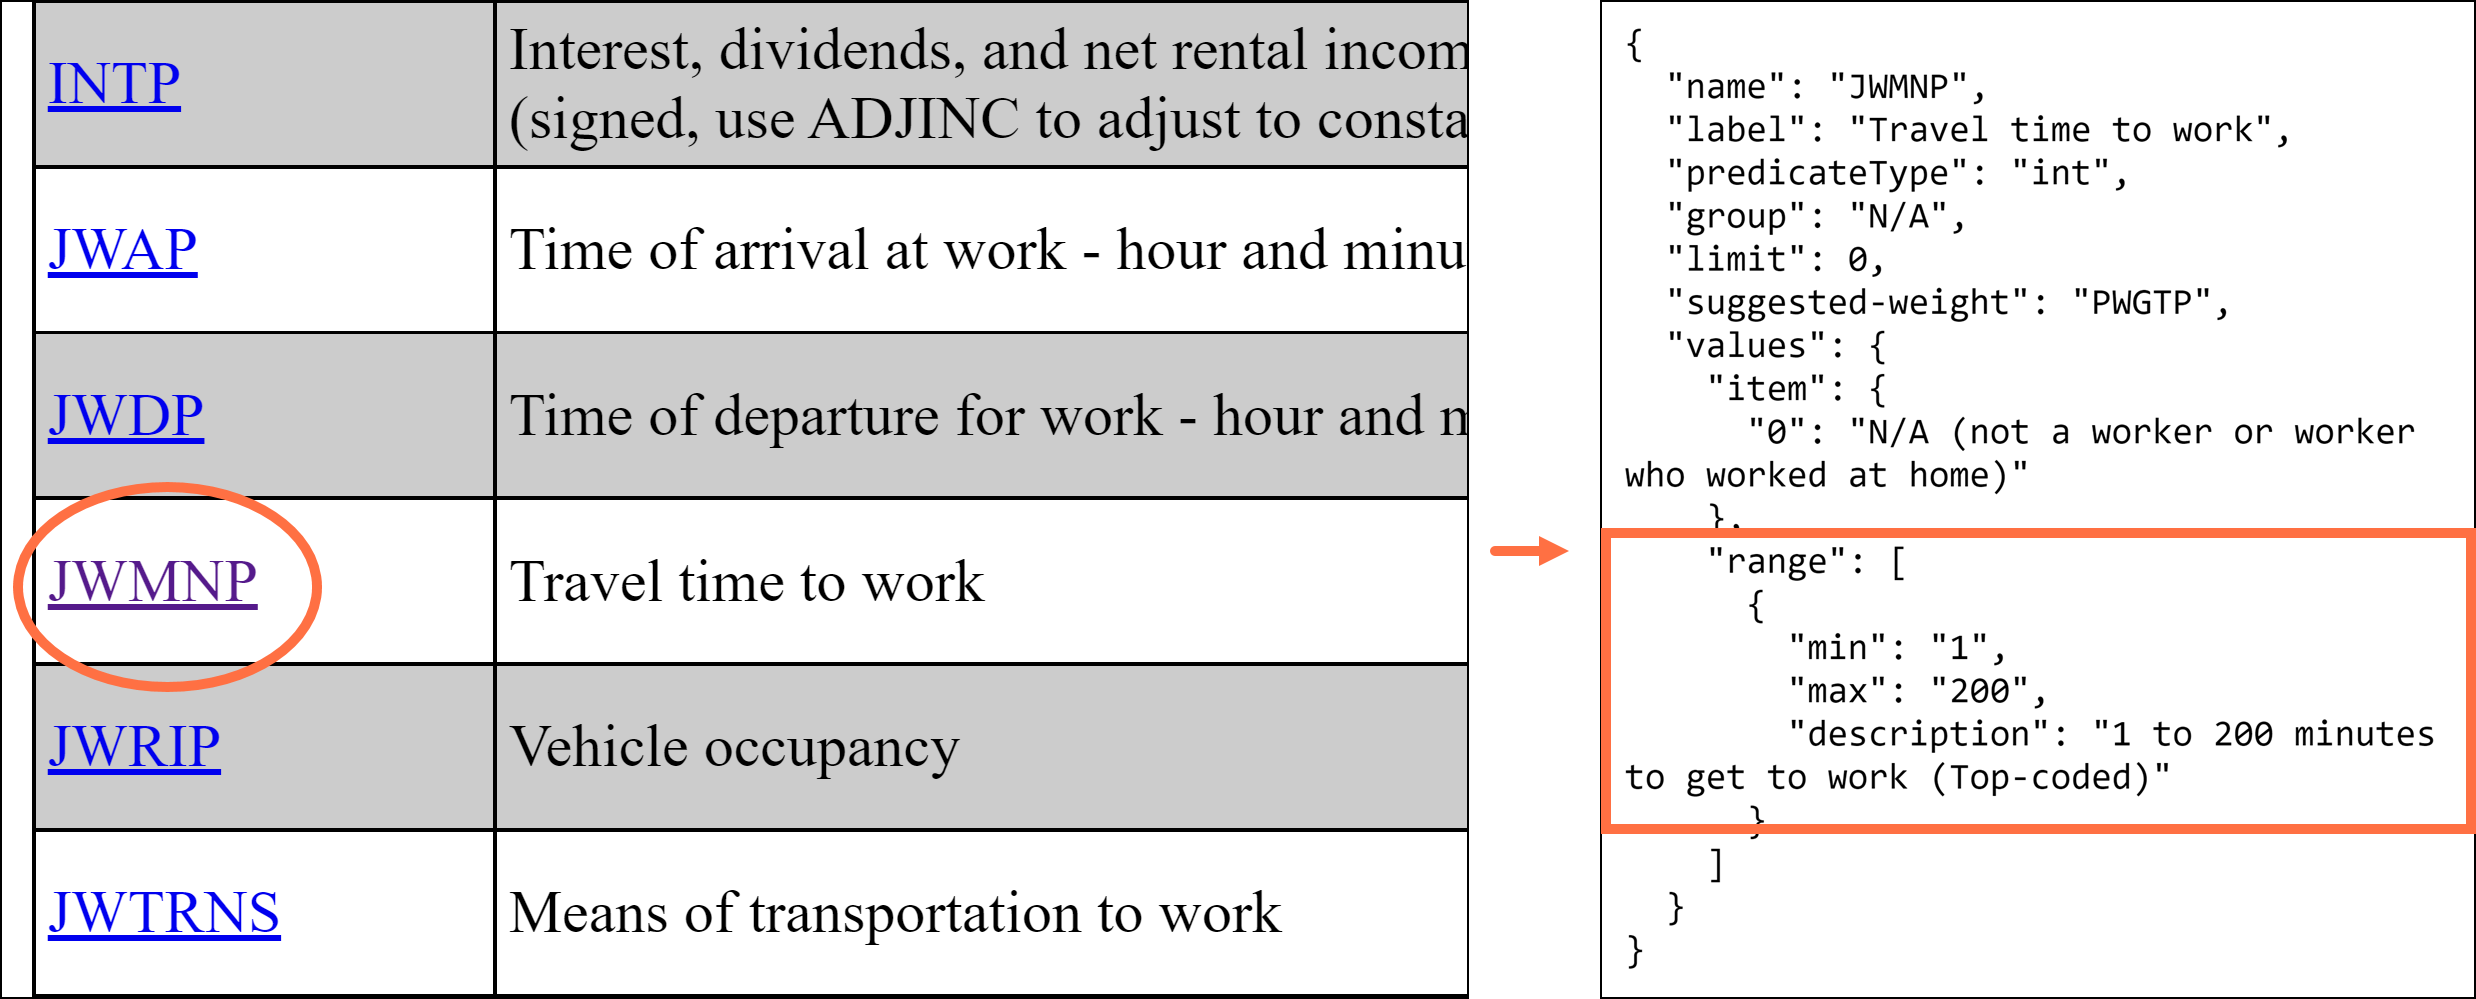
JWMNP is an example of a continuous variable in the 2019 ACS 1-Year PUMS dataset that provides data for travel time to work. When you click the variable in the API Discovery Tool, it shows that this variable provides data for a range of values. The minimum value is a 1-minute commute time, and the maximum value is a 200-minute commute time. The details directly above the range highlighted in Figure 11 also show that a value of 0 represents people who are not in the universe for this variable, because they are either not a worker or they work from home.
The last consideration of your microdata API query is to determine if you need to recode any variables. This is a process where you can specify custom categories that your statistics represent rather than using the most-detailed, default categories. It is required when working with many continuous variables and is beneficial for categorical variables as well.
For example, suppose you are working with JWMNP, a continuous variable in the ACS PUMS microdata API for travel time to work. If you place it in the columns or rows of the API query without recoding it, you will get results for each possible value of the continuous variable. Consider this query that provides travel time to work broken out by sex.
api.census.gov/data/2019/acs/acs1/pums?tabulate=weight(PWGTP)&col+SEX&row+JWMNP
After running the query, you will notice the default is to provide results for all 201 possible values of travel time to work in 1-minute increments. It begins with 0 for people who are not a worker or work from home and ends with a 200-minute travel time to work. This is likely more detail than what you need for your analysis. Recoding the variable allows you to define higher-level categories to get results for commuting, such as 15-min increments instead of 1-min increments. For example, this query provides results for the number of males and females with that have commute times within one of these 8 categories: 0 (not a worker or work from home), 1-14 min, 15-29 min, 30-44 min, 45-59 min, 60-74 min, 75-89 min, or 90+ min
IMPORTANT: The process to recode variables is complex and is described in detail in the appendix. We are considering ways to simplify the process to recode variables in the microdata API. If we implement a simplified syntax in the future, it will break the current way of recoding variables and users will need to update their microdata API queries to the new syntax for all of their queries that use recoded variables. To stay informed of these important API changes, please sign up for Census Data API email updates.
Only recoded continuous variables can be placed in the columns or rows of the microdata API query; otherwise, you will receive an error message. For example, if you try to place household income (HINCP) in the columns/rows without recoding it, you will get an error message: api.census.gov/data/2019/acs/acs1/pums?tabulate=weight(PWGTP)&col+HINCP
This is done because there is no way to present meaningful information to you without requiring you to define your desired categories up front. In the 2019 ACS 1-Year PUMS, HINCP values can range from a minimum of -$59,999 to a maximum of $9,999,999, which is much more than 1,000 possible values.
You can also recode categorical variables to create higher-level categories instead of getting results for the detailed categories that are provided by default. For example, consider the poverty level of persons variable (PERLIS) from the 2020 Current Population Survey Annual Social and Economic Supplement (CPS ASEC) microdata API dataset. PERLIS provides 5 detailed categories of the poverty level of a person:
- -1 = Not in Poverty Universe
- 1 = Below Poverty Level
- 2 = 100-124 Percent of the Poverty Level
- 3 = 125-149 Percent of the Poverty Level
- 4 = 150 and Above the Poverty Level
You may not need this much detail in your analysis and may be interested in combining some of these categories together. For example, you may want to combine values 2, 3, and 4 together to create a “Not in Poverty” category. You can use the microdata API recode functionality to do this. See the appendix for details.
Related Information
-
How-to Materials for Using the Microdata AccessDo you have questions on how to use Microdata Access? Check out our step-by-step guidance to learn how to use Microdata Access to create your own tabulations.
-
Microdata AccessCreate custom tables using public use microdata with the Microdata Access Tool (MDAT).