IDB Interactive Tool Help Page
Welcome to the International Database (IDB)!
This user guide will explain how to use the interactive data tool for accessing and querying population data. For more background information about the IDB, including methodology, definitions, and release notes, please visit the IDB overview page .
- Selection/Filtering menu
-
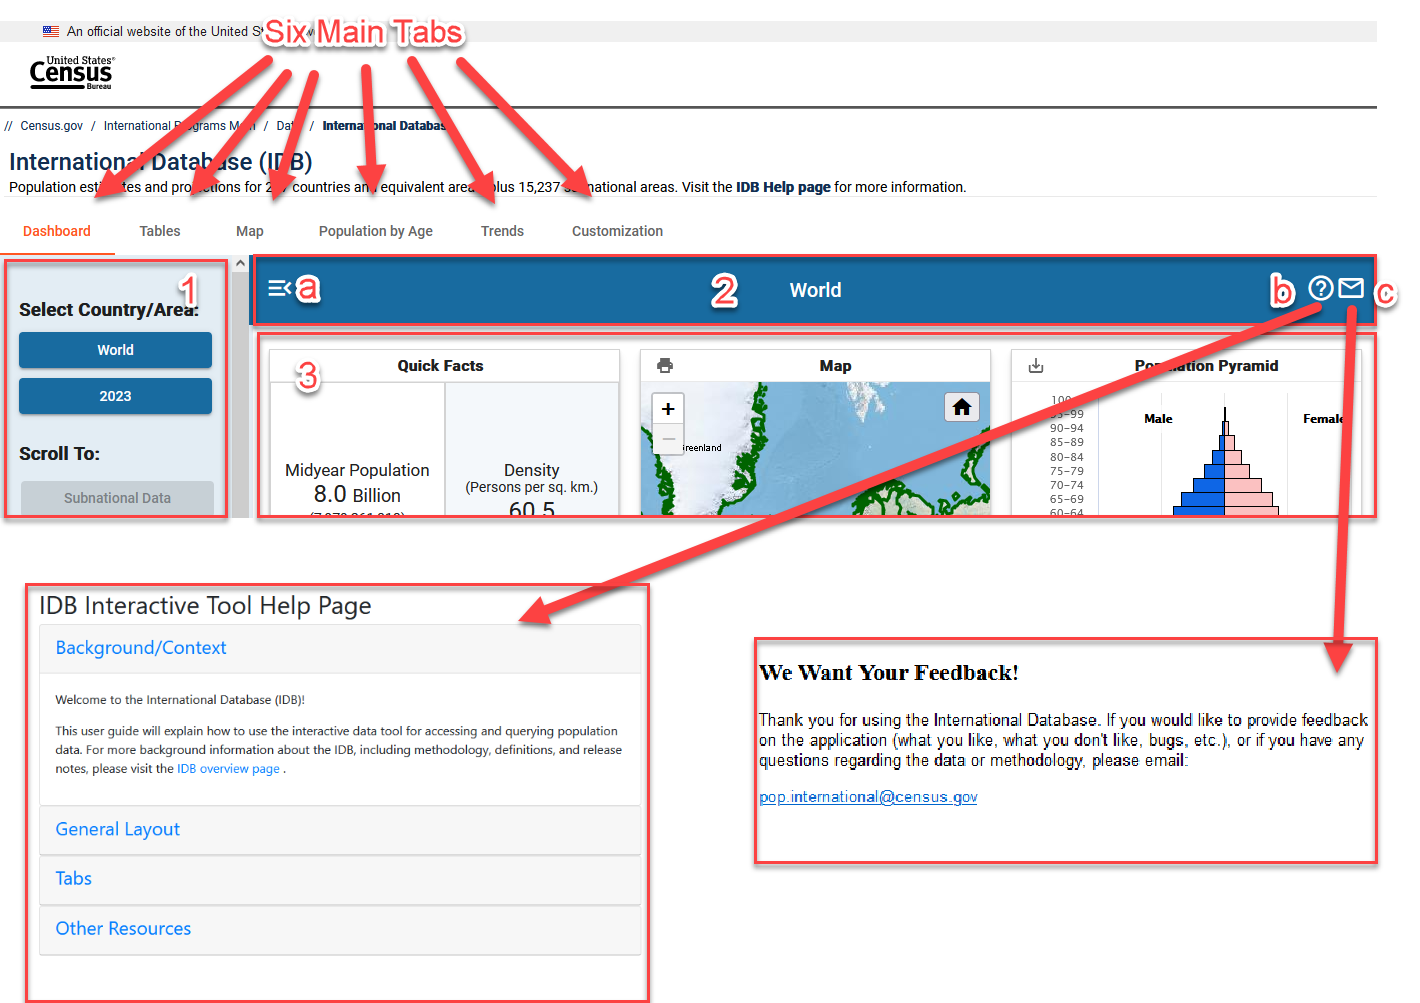
Header section displays the name of a selected country/area as heading text. Header section has three
buttons:
- The Show/Hide menu button allows users to toggle the visibility of the Selection/Filtering menu. When the menu is hidden, the main display area increases to full width.
- Click Help button to display IDB help page.
- Submit feedback button allows users to submit feedback.
- Main display area: displays the views when users make selection(s) from the Selection/Filtering menu.
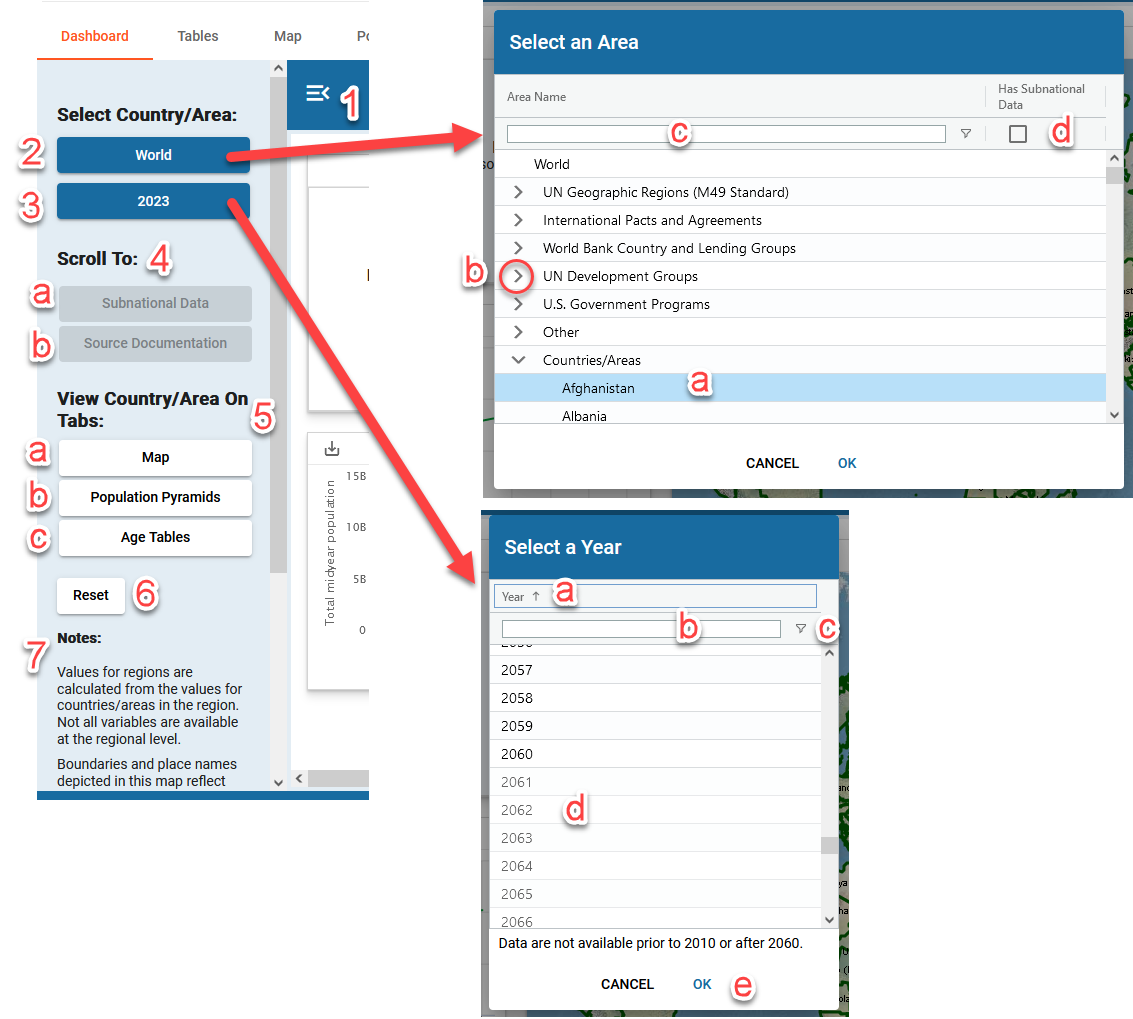
Dashboard
On this tab, users can quickly view demographic facts and visuals about the world, individual regions, or individual countries/areas. For some countries, users can see data at subnational administrative levels. For additional data and features, navigate to other pages by selecting the Tables, Map, Population by Age, or Trends tabs.
The world is initially selected in this tab.
Selection/Filtering Menu
|
|
Dashboard Display Area
National/Regional
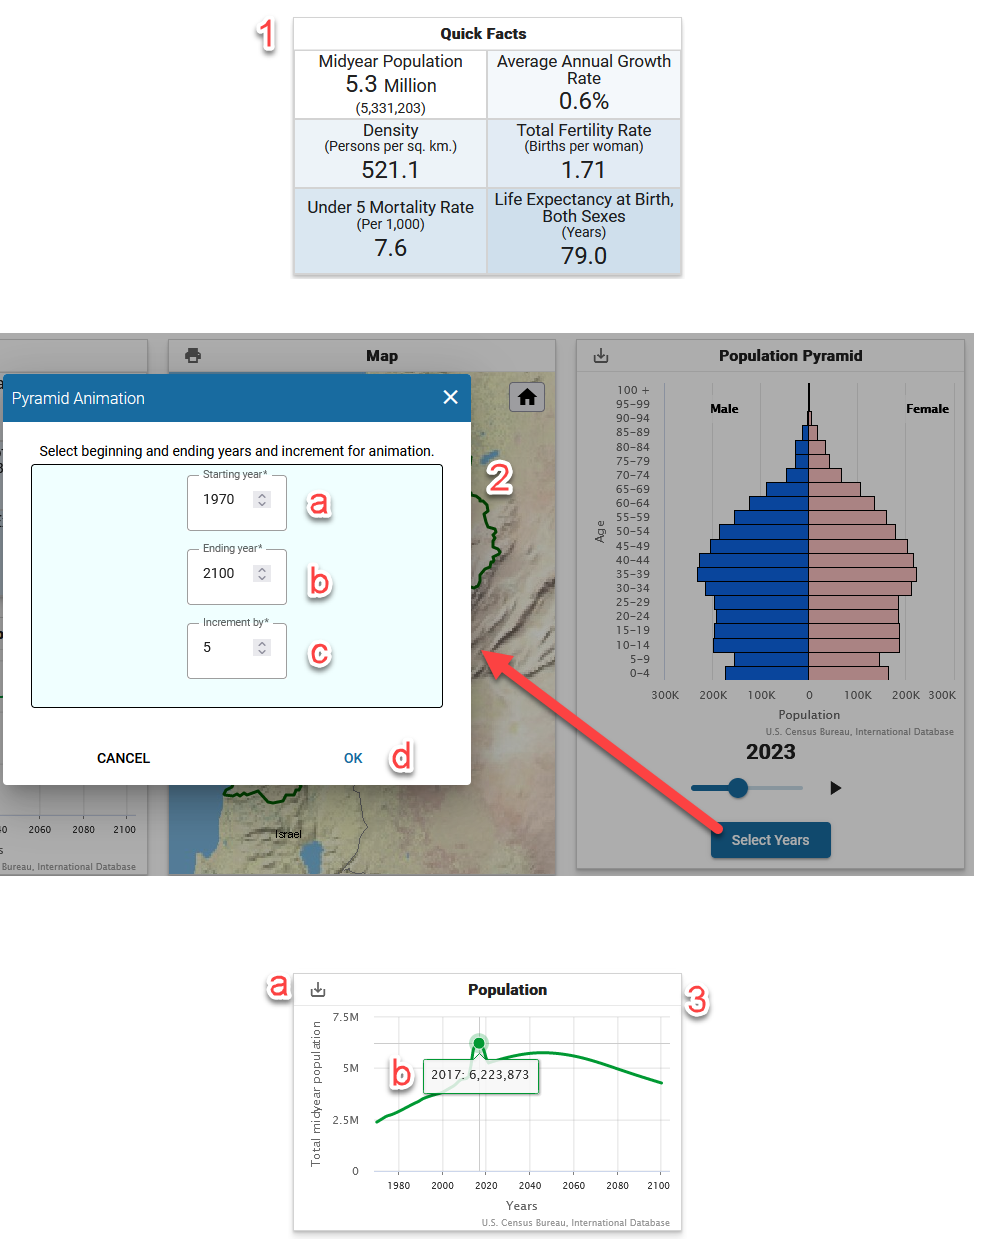
The main section of the Dashboard will display various cards, depending on whether a Region or a Country/Area is selected. these cards can include Quick Facts, a Map, a Population Pyramid, and several different trend graphs.
|
|
 button to start the animation. Click the
  to pause the animation.
Subnational
|
For countries/areas where subnational data are available, the dashboard will contain both a map and a table of subnational data. Subnational data currently available are population, sex ratio and dependency ratios. Users can utilize the links above the table to download data and view the subnational webpage for more information. Above the map the user may select the admin level and measure. Note: only the available admin levels and measures are shown. Either the map or the table can be expanded, allowing for additional space to view the data and map. |

|
|
A user may select a subnational area on the map to see its corresponding data in the table. Similarly, a user can select a subnational area in the table and view it on the map. |

|
|

|
|

|
|

|
|

|
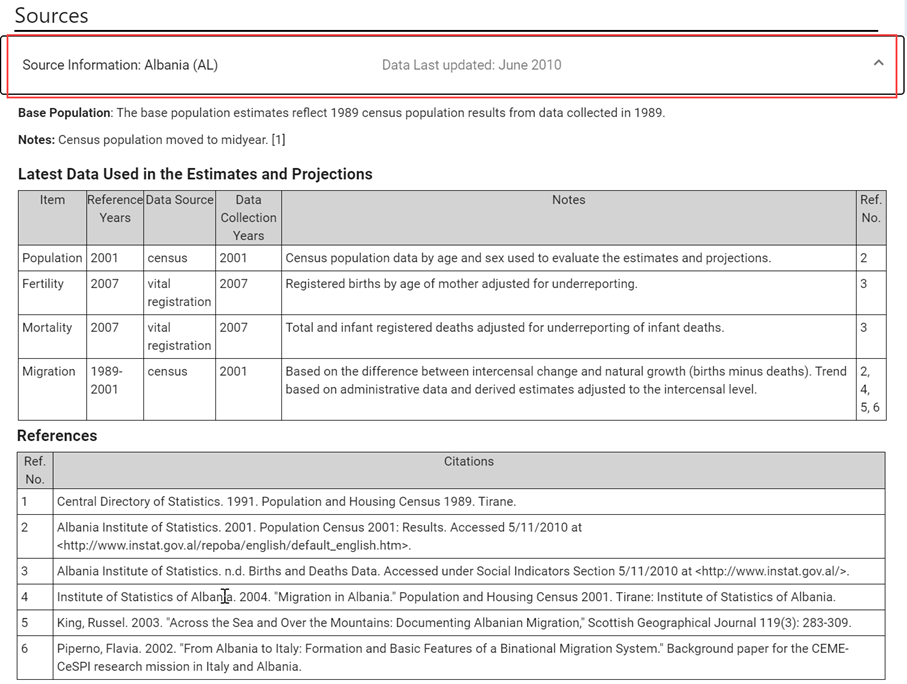
Sources
Sources section is available for every country/area, but not for regions. Sources for subnational boundaries and estimates are available at the subnational data webpage.
|
Tables
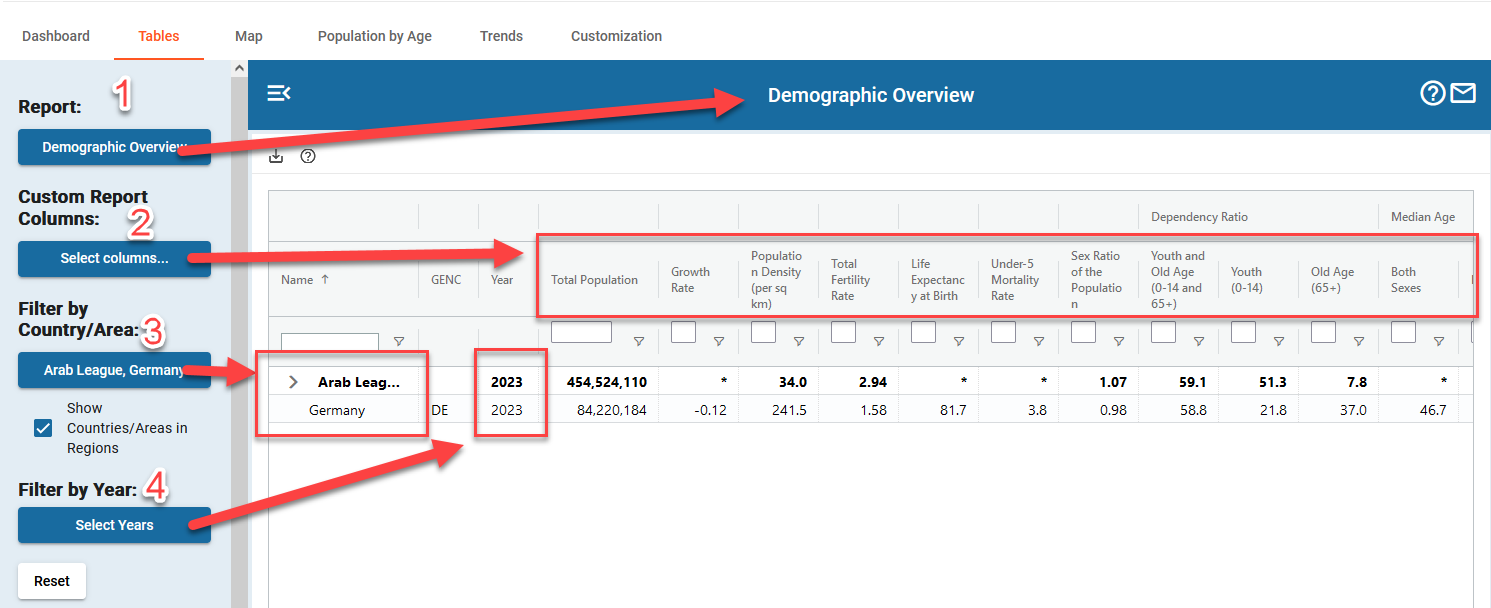
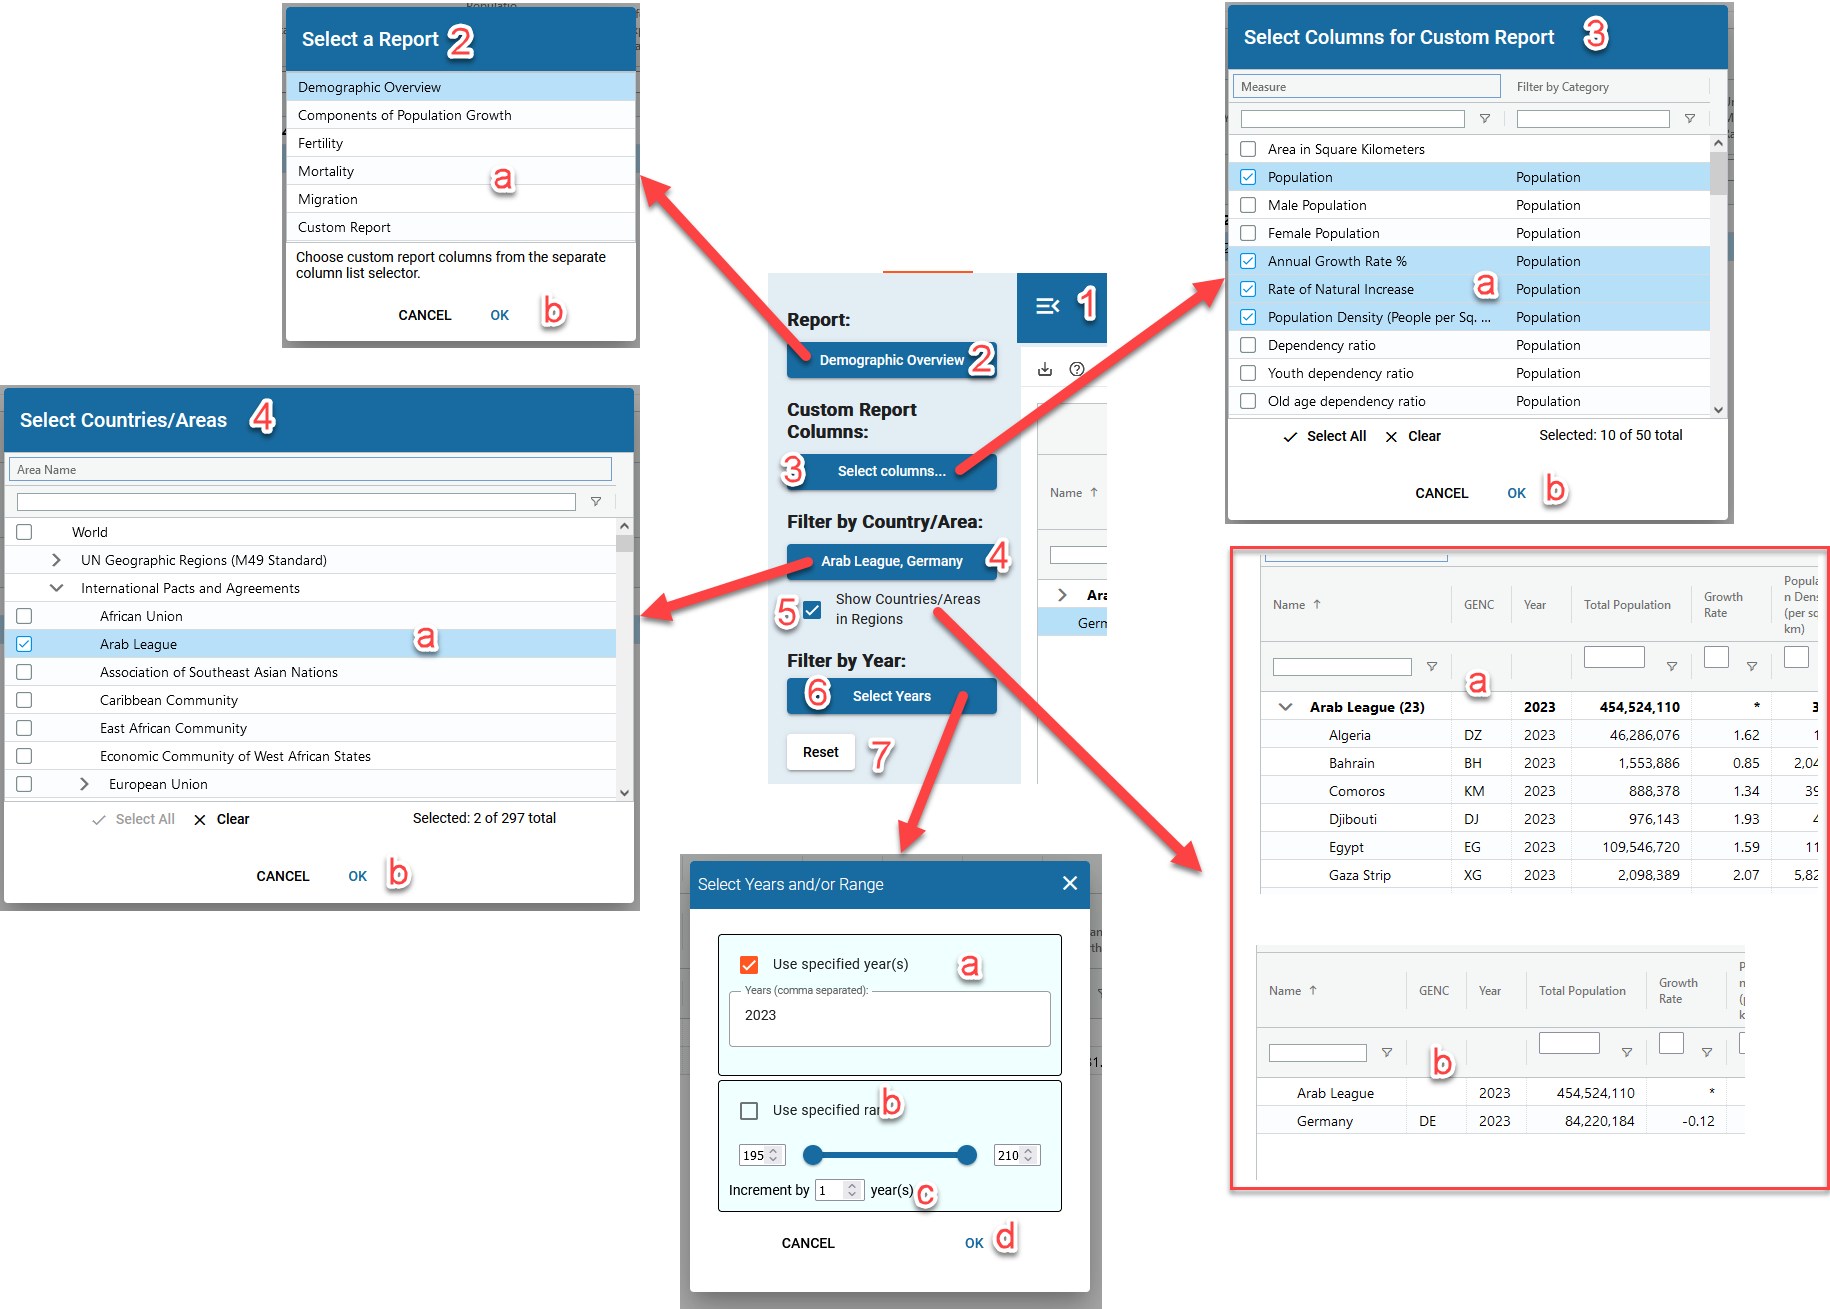
In this tab, users can display tables of demographic data for multiple regions and countries/areas for a single year or multiple years. Several pre-built reports are available, or users can generate custom reports.
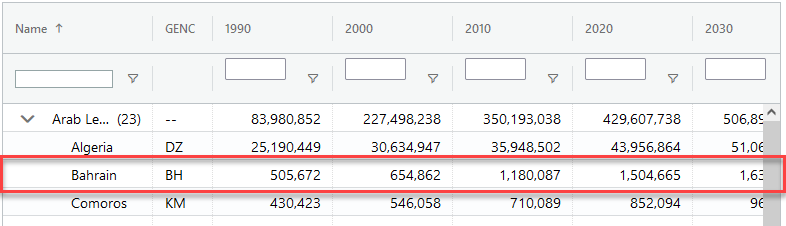
Initially, this tab is displayed as follows:- The report "Demographic Overview" is selected.
- The measures that correspond to "Demographic Overview" (Total Population, Growth Rate, Population Density, etc. in this screenshot).
- "Filter by Country/Area" displays the selected regions and countries/areas (Arab League and Germany in this screenshot) in the "Name" column of the data table.
- "Filter by Year" displays only the selected year(s) (2024 in this screenshot) in the table.
Selection/Filtering Menu
|
|||
|
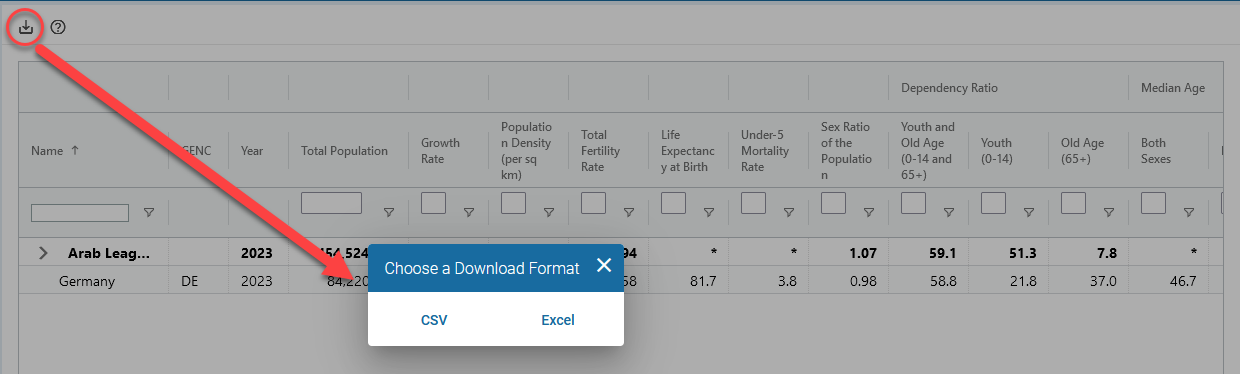
Table
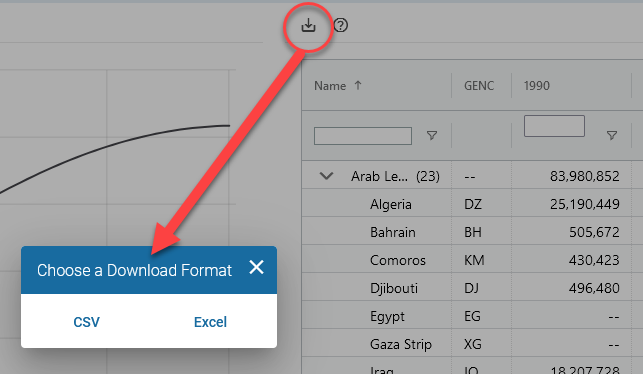
- Click on download button to open a pop-up window prompting users to “Choose a Download Format” of
either CSV or Excel.
-
Users can hover their mouse over the the column headers in any table to view data definitions. This can be helpful when the user is unfamiliar with the definitions of the dataset.

-
You can change the order of columns by dragging the column header left or right. You can resize columns by dragging the separator to the right of the column header. Double-clicking that separator automatically resizes the column to fit its widest contents (usually the column header text).
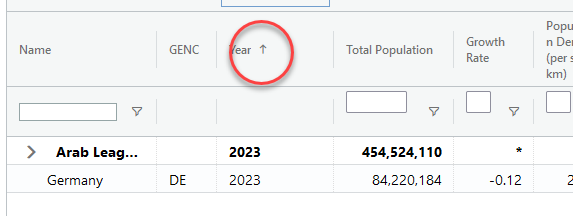
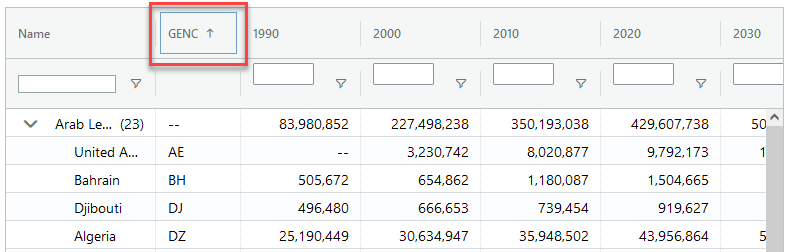
- Click on a column header to sort a column in ascending or descending order.
-
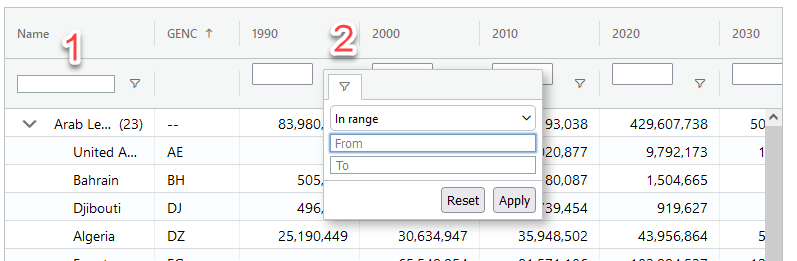
Filter
- Users can directly enter filter condition into filter input box as follows:
-
> (Greater than)
for example: > 100000.
-
< (Less than) for example: < 100000.
-
- (In range)
for example: 100000-200000.
-
> (Greater than)
-
Or click on the filter icon:
- Click on filter icon to open the filter dropdown.
- Click on the arrow-down button to choose “In range”, “Greater than”, “Less than” etc.
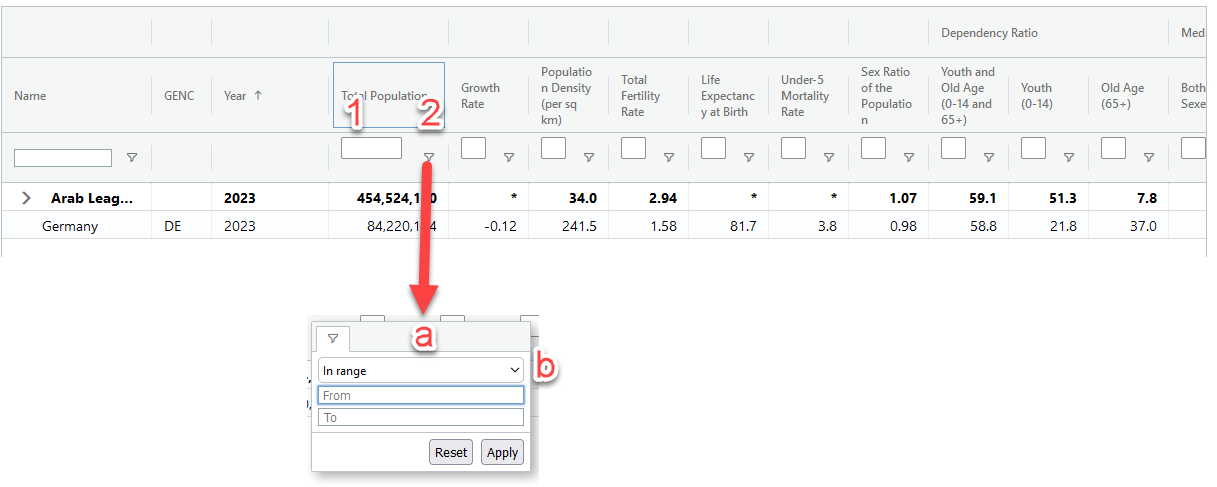
- Users can directly enter filter condition into filter input box as follows:
Map
Selection Menu
|
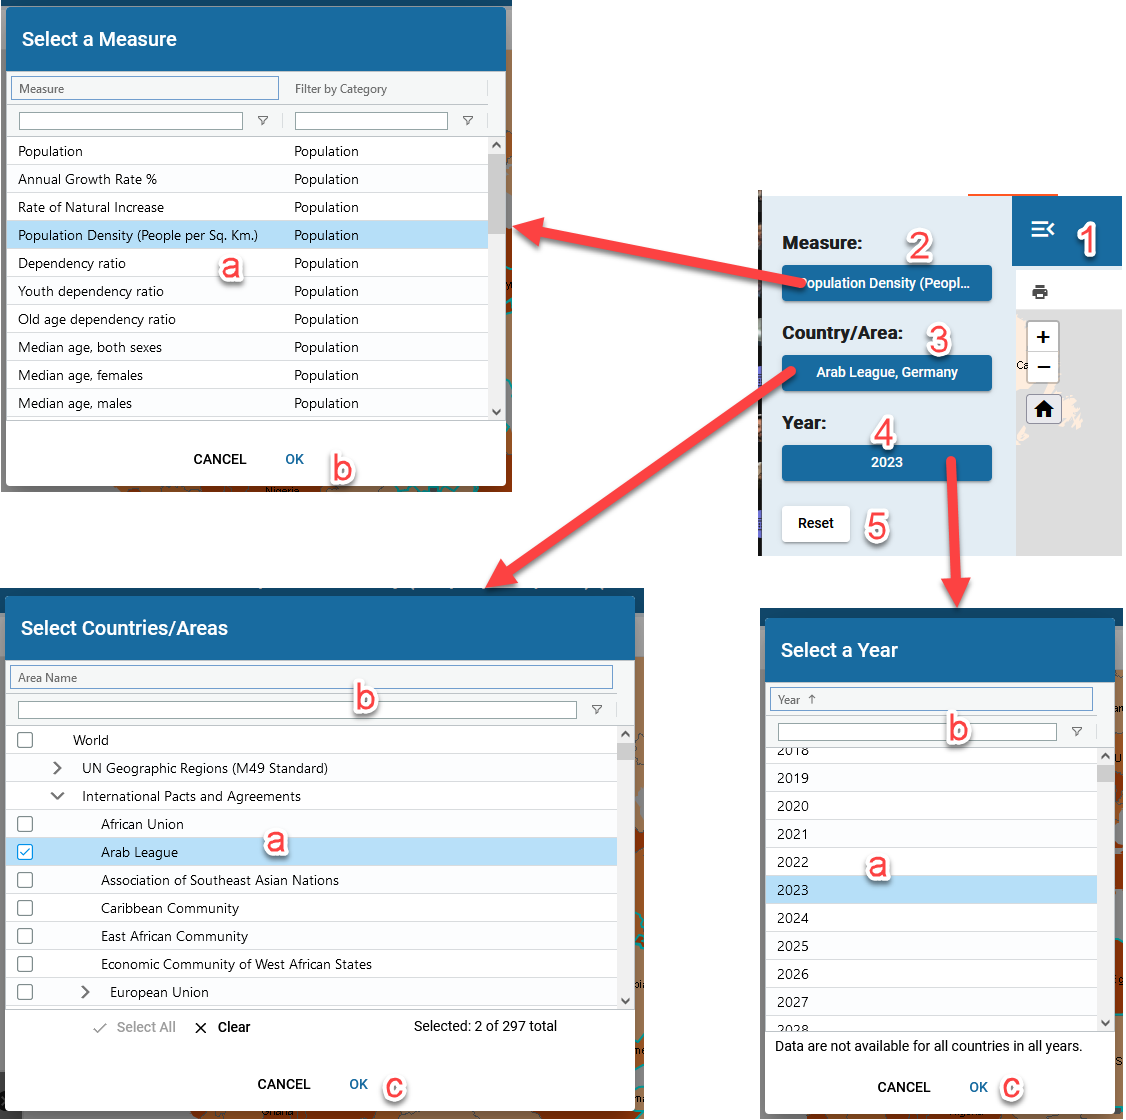
|
Map Display Area and Functionality
|
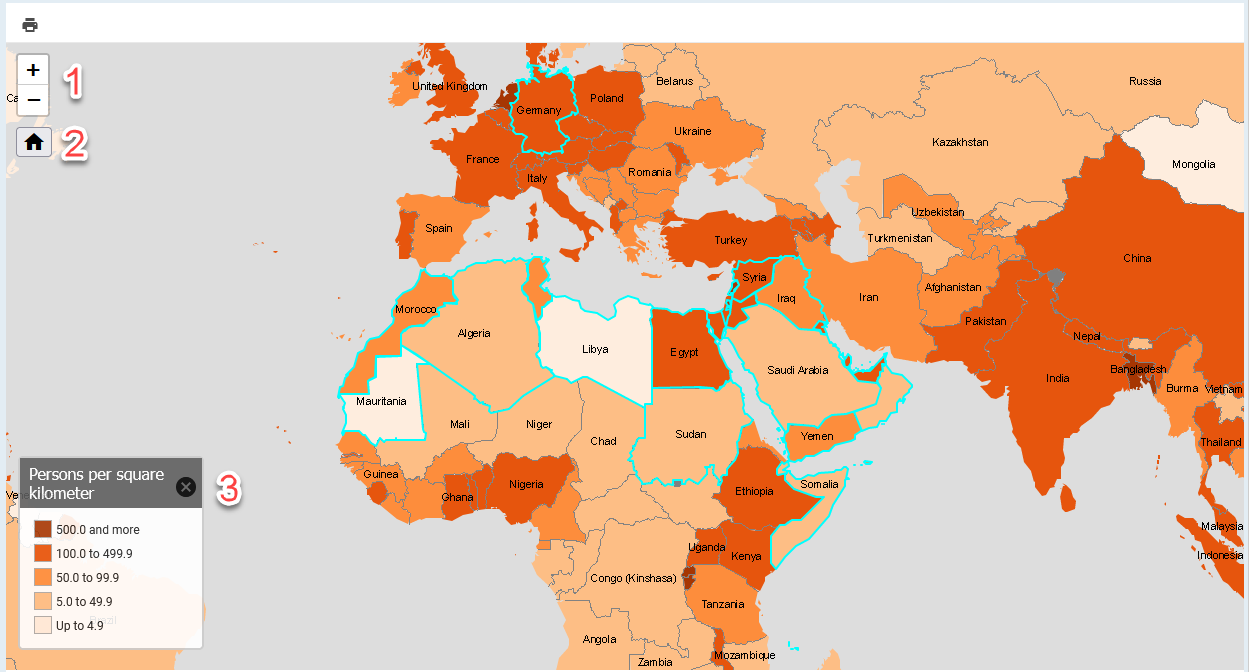
|
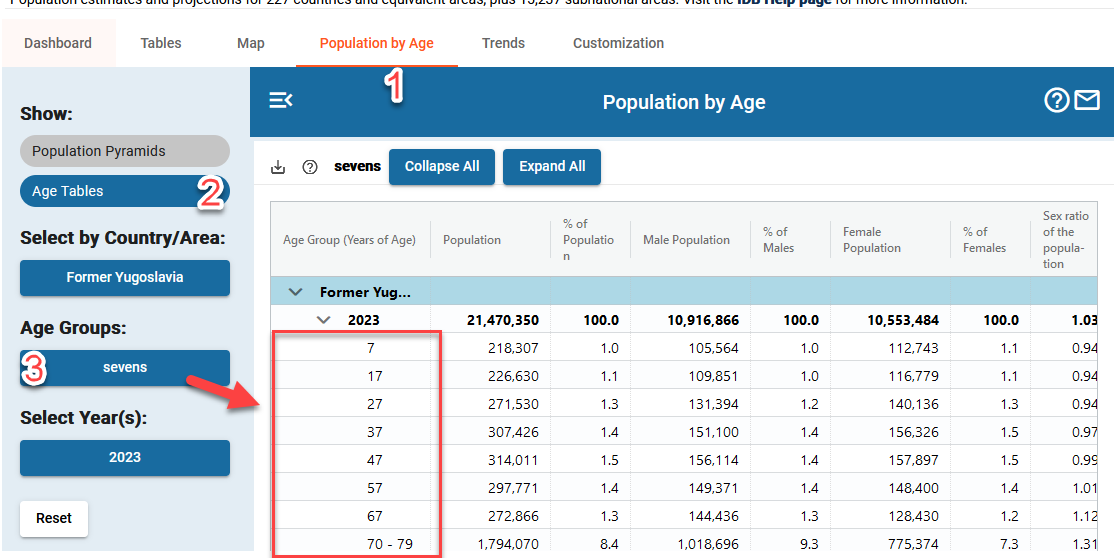
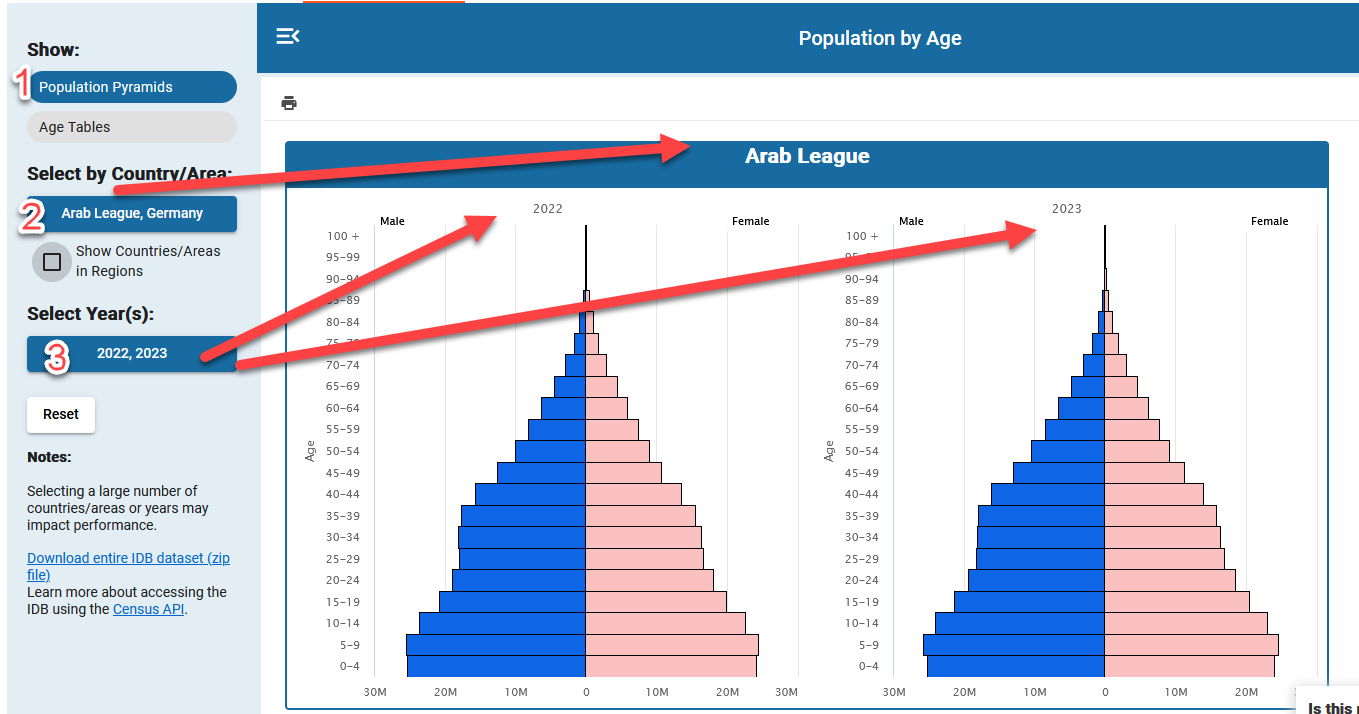
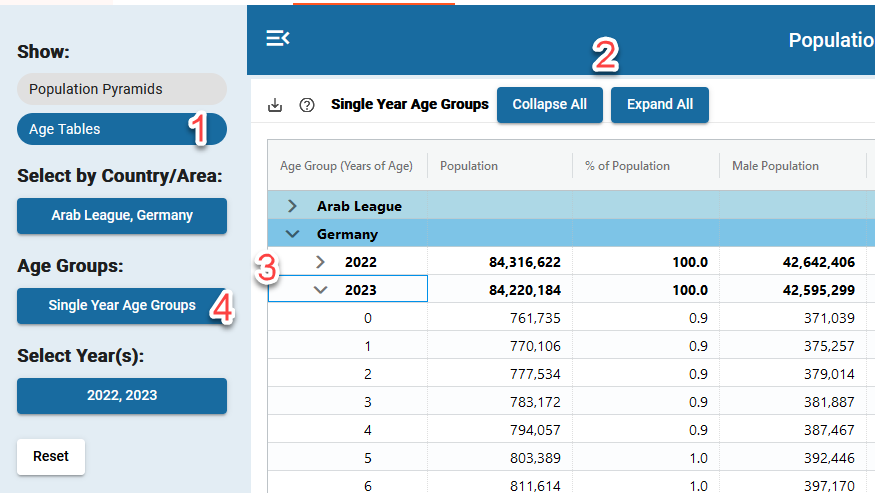
Population By Age
In this tab, users can view the population datatable or pyramid for a single country/area or multiple countries/areas, and for a single year or multiple years.
Selection Menu
|
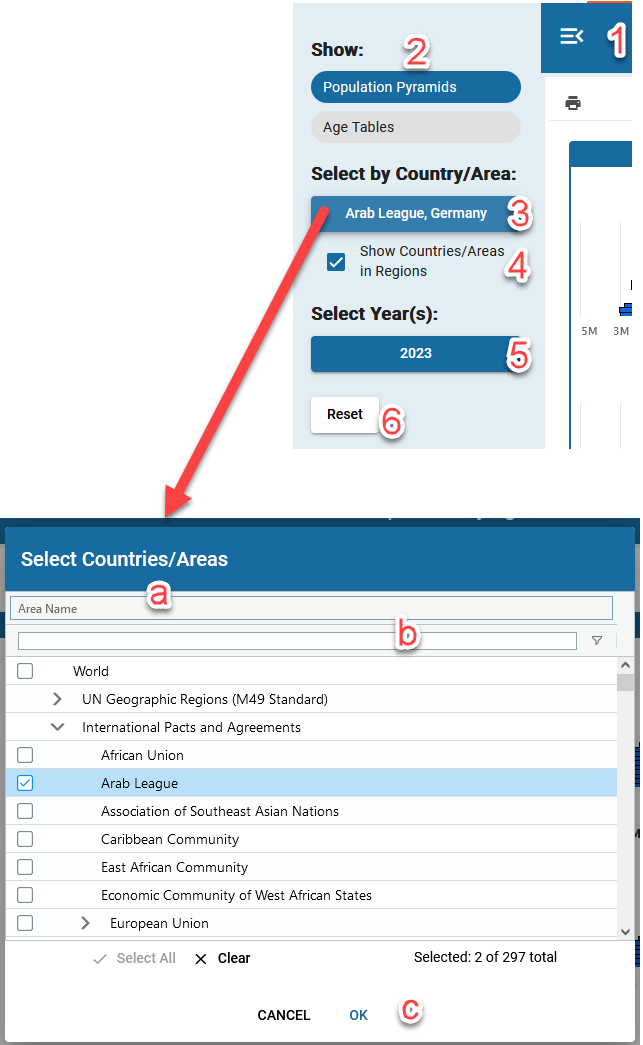
|
Population Pyramids
Note that if more countries/areas and/or years are selected, it will take more time to load the pyramids.
|
|
Tables
Display table of selected countries, selected years, and selected age groups.
|
|
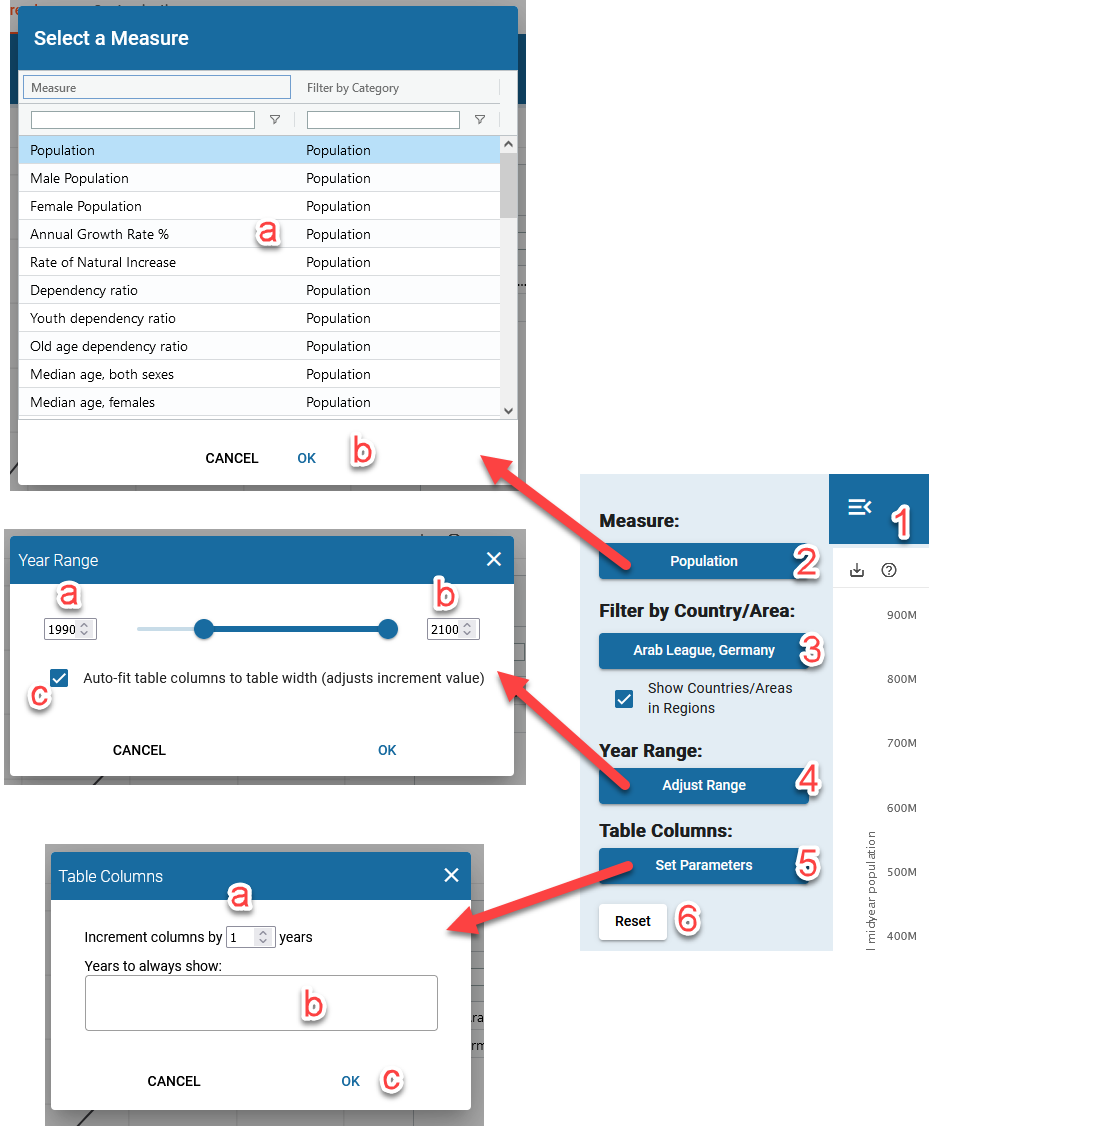
Trends
In this tab, users can view trends over time for one or multiple regions and countries/areas for specific demographic indicators. Users can adjust the years selected to limit the amount of data displayed.
Selection/Filter Menu
|
|
Chart
-
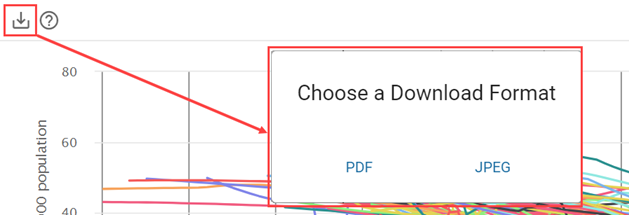
Download button. Users will be prompted to "Choose a Download Format" of either PDF or JPEG.
-
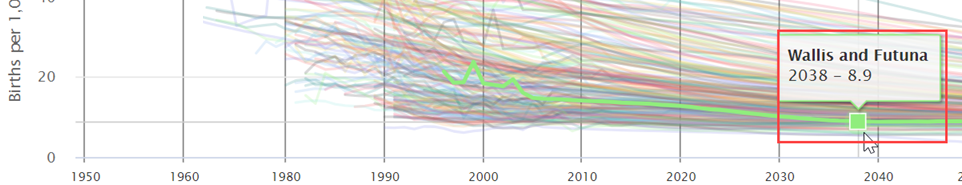
Info window displays the data of a chart point/line. Hover over a point/line to see the info window.
-
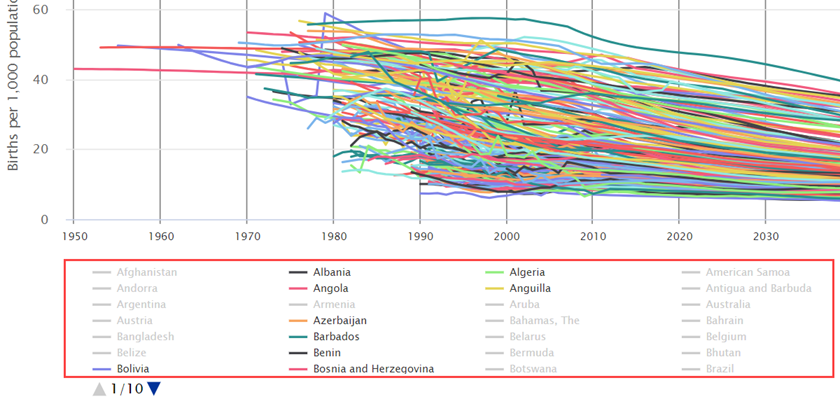
Click a country/area name on chart legend to remove that country/area from the chart
(the country/area becomes grayed out). Click the country/area once more to show it again on the chart.
Table
-
Double clicking a row brings users
to the Dashboard tab with the selected country/area from this table's row. Note that double clicking Region rows will have no effect.
-
Click Download button to open a small popup window, users will be prompted to "Choose a Download
Format" of either CSV or Excel.
-
Click on column header to sort a column in ascending or descending order.
-
Filter
-
Users can directly enter a filter condition into the filter input box as follows:
- > (Greater than): for example: > 100000.
- < (Less than): for example: < 100000.
- - (In range): for example: 100000-200000.
- Or use the filter dialog box by clicking on the filter icon next to the text box. The filter dialog allows for more specific filtering.
-
Users can directly enter a filter condition into the filter input box as follows:
Customization
In this tab, users can create custom regions and custom age groups. The user-created region can be viewed on all tabs by selecting it from the country/area filters. The user-created age groups are viewable only on the Age Tables in the Population by Age tab.
Users are able to share their custom regions and age groups with others in two ways: copy and pasting the URL, and saving the custom regions and/or age groups to a file, which can then be shared with other users.
Viewing Regions and Age Groups
Users can also use the "Customization" page to view pre-built Regions and Age Groups, as well as any custom groups created or imported into the system.
|


|
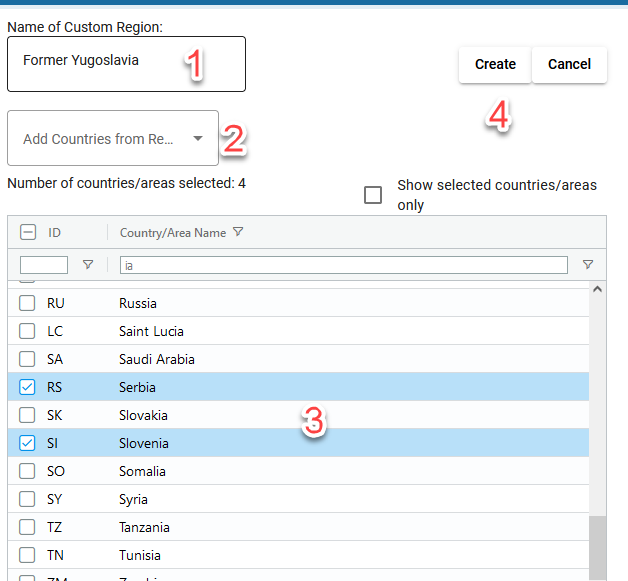
Creating Custom Regions
-
Clicking the "Create New Region" button starts the process of creating a custom region
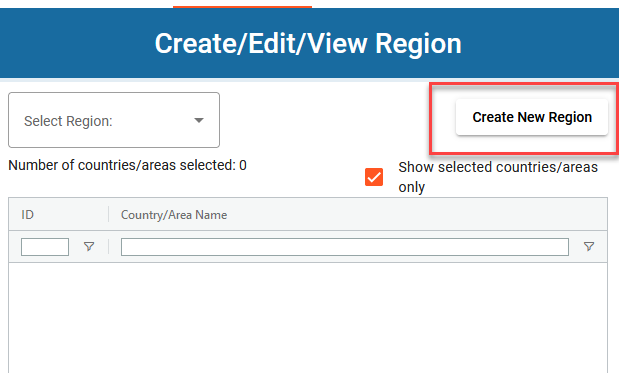
-
Once this button has been pressed, there are more steps and options for the user:
- First, the user must enter a name for their custom region.
- The user may or may not add countries/areas from an already-existing region. This can be helpful if the region closely resemebles another region; this allows the user to take an existing region, and add or remove countries/areas to/from it.
- To add or remove countries/areas to/from the custom region, the user checks or unchecks the checkbox in the table. The table is filterable, like all the tables in the application.
- Selecting the "Show selected countries/areas only" checkbox will filter the list to currently selected countries/areas. Users can use this feature to review selections, and remove any items before completing their custom region.
- Lastly the user must click the "Create" button to finalize the new custom region. Once this is done, the region will be viewable across the appliction.
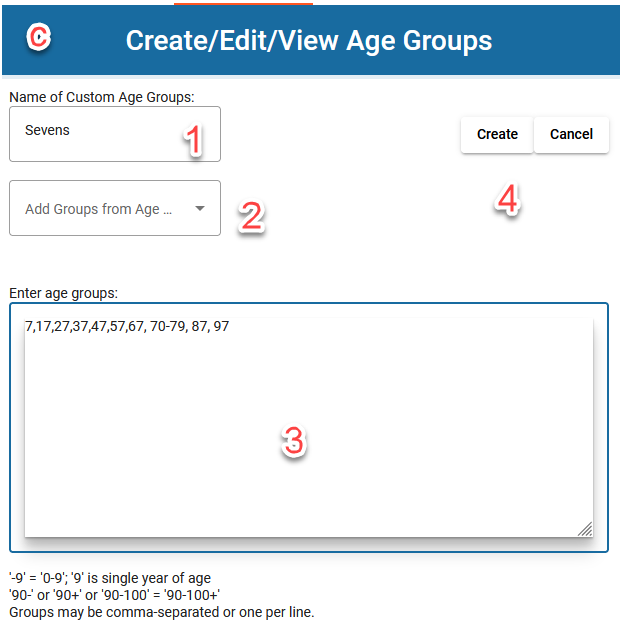
Creating Custom Age Groups
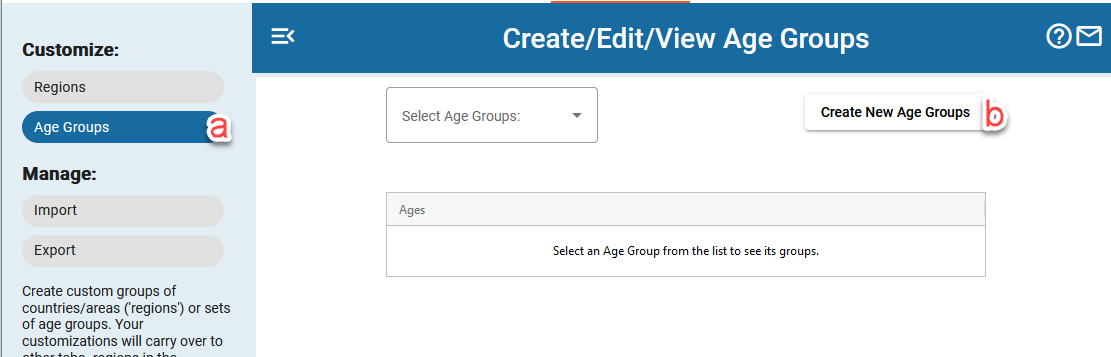
- To create a custom age group, the user must first select "Age Groups" in the side bar.
- Next, the user must click the "Create New Age Groups" button.
-
Once this button has been pressed, there are more steps and options for the user:
- First, the user must enter a name for their custom age groups.
- The user may or may not add age groups from an already-existing age grouping.
- To add age groups to the new custom grouping, the user enters them in the text box. Seperating each group with a comma, users can add individual years (i.e. 7, 17) and spans of years (i.e. 18-20, 20-30).
- Lastly the user must click the "Create" button to finalize. Once this is done, the age groups will be viewable in the Population by Age tables.
Saving and Loading Customizations
Saving/Exporting
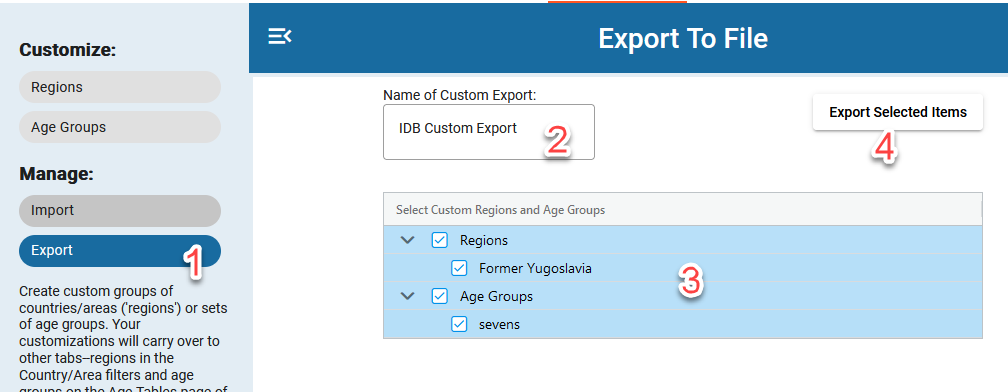
- To save the current customizations to a file, the user must first select the "Export" button in the sidebar.
- Next, the user must name the export file.
- The user can then pick which customizations they wish to save using the checkboxes in the table.
-
Lastly, the user must click "Export Selected Items". This will download the save file in the form of a JSON file,
which can be shared and loaded by other users.
-
Note: Avoid making directly edits to the exported JSON file, as any alterations could easily invalidate the file. This could prevent the file from being properly imported back into the app.
-
Loading/Importing
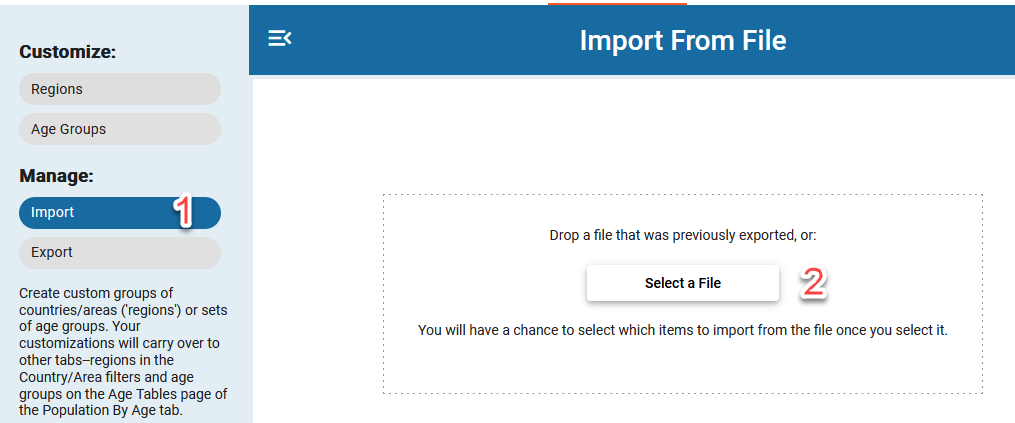
- To load previously saved customizations, the user must first select the "Import" option in the sidebar.
- Next, the user can either drag and drop the JSON file from their computer into the import box, or they can click the "Select a File" button to manually select the file in a file explorer.
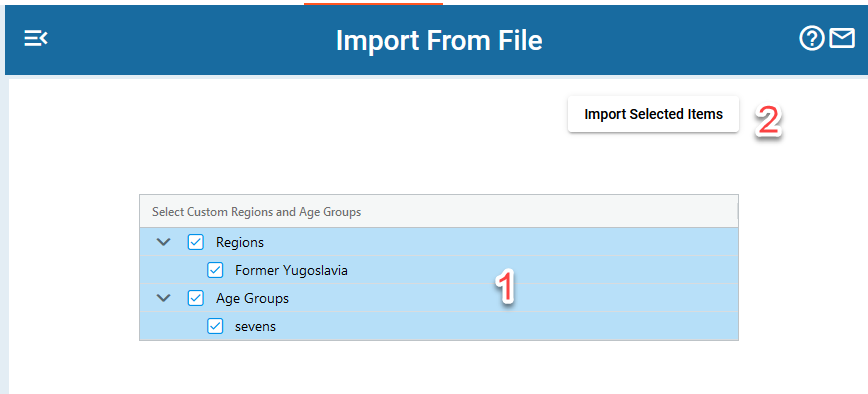
- Once the file is selected, a list will appear containing all of the available customizations. The user can check the boxes of which custom regions and/or custom age groups they want to import.
- Once the user has made their selections, clicking "Import Selected Items" will load them into the IDB Application, allowing them to be viewed.
Viewing Customizations in IDB
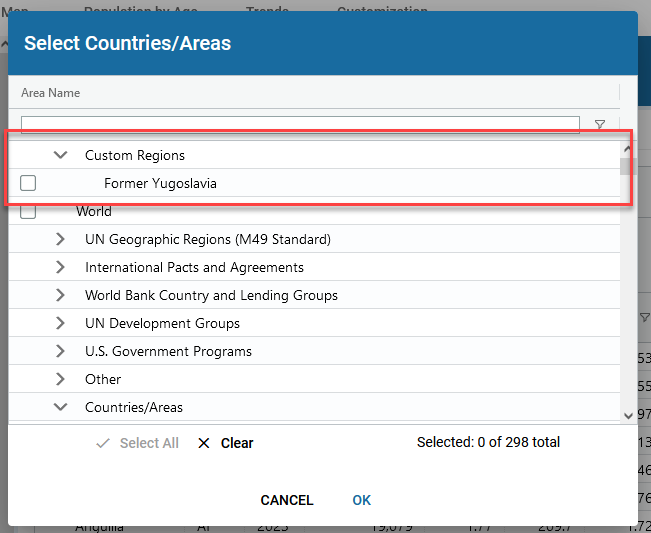
Custom Regions
To view a custom region in the application, the user must select the region like they would any other region. Custom regions will appear at the top of the "Filter by Country/Area" dialogs:
Custom Age Groups
To view a custom age group, the user must:
- First, navigate to the Population by Age tab.
- Next, select Age Tables in the sidebar.
- Lastly, select the new custom age group. The age groups will now be displayed in the table.