
Official websites use .gov
A .gov website belongs to an official government organization in the United States.
Secure .gov websites use HTTPS
A lock (
) or https:// means you’ve safely connected to the .gov website. Share sensitive information only on official, secure websites.

Topics
Data & Maps
Surveys & Programs
Resource Library

Changes in Children’s Health Coverage Varied by Poverty Status From 2018 to 2020
In 2020, 4.3 million children under the age of 19 — 5.6% of all children — were without health coverage for the entire calendar year, according to a report released today.
While this was not statistically different from the percentage of children who were uninsured in 2018, a closer analysis reveals that the changes in uninsured status between 2018 and 2020 affected children in poverty more than those living above the poverty level.
The changes in uninsured status between 2018 and 2020 affected children in poverty more than those living above the poverty level.
As noted in the report, data for 2018 were collected in 2019 before the COVID-19 pandemic and the pandemic’s associated changes to data collection. The 2020 data were collected in 2021, when many of the COVID-19 pandemic-related data collection changes were lifted.
Children may receive health insurance coverage through a variety of sources, including as a dependent on a parent’s private plan or through public programs such as Medicaid or the Children’s Health Insurance Program (CHIP).
In 2020, the percentage of all children with private insurance and the percentage of all children with public insurance was not statistically different from 2018.
Yet, there were differences based on children’s poverty status and whether they lived in states that expanded Medicaid.
Children’s Health Insurance Coverage and Poverty Status
Family income-to-poverty ratio provides a measure of a family’s economic resources. This measure compares family income to a poverty threshold based on the age and number of people in the family.
People are classified as being in poverty if their family income is less than the poverty threshold. In 2020, the poverty threshold for a family of two adults and two children was $26,246 annually.
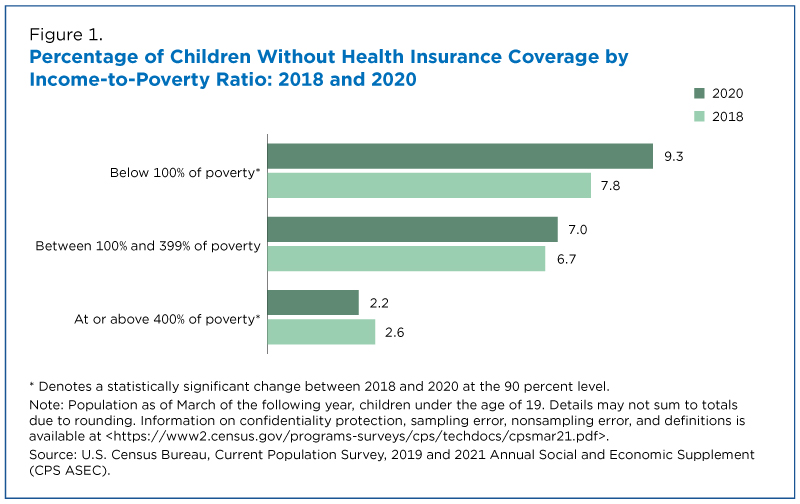
For children in poverty, the uninsured rate in 2020 was 9.3%, compared with 7.0% for those with family incomes within 100% and 399% of poverty and 2.2% for those with incomes 400% of poverty or higher (Figure 1).
Between 2018 and 2020, the uninsured rate increased for children in poverty by 1.6 percentage points, while children with family incomes 400% of poverty or higher ($104,984 annual income for a family of two adults and two children) experienced a drop in their uninsured rate by 0.4 percentage points.
Among children in poverty, 77.4% were covered through public health insurance programs in 2020 (Figure 2). Yet, a 3.4 percentage point decline in public coverage between 2018 and 2020 likely contributed to rising uninsured rates for this group.
Private coverage for children in poverty did not change significantly during this period.
However, children with family incomes between 100% and 399% of poverty experienced significant changes in both private coverage and public coverage through programs like Medicaid and CHIP.
Private coverage declined by 2.0 percentage points to 54.9% between 2018 and 2020, while public coverage increased by 1.7 percentage points to 42.3%. For this group, the decline in private coverage was offset by an increase in the percentage of children covered by safety net programs.
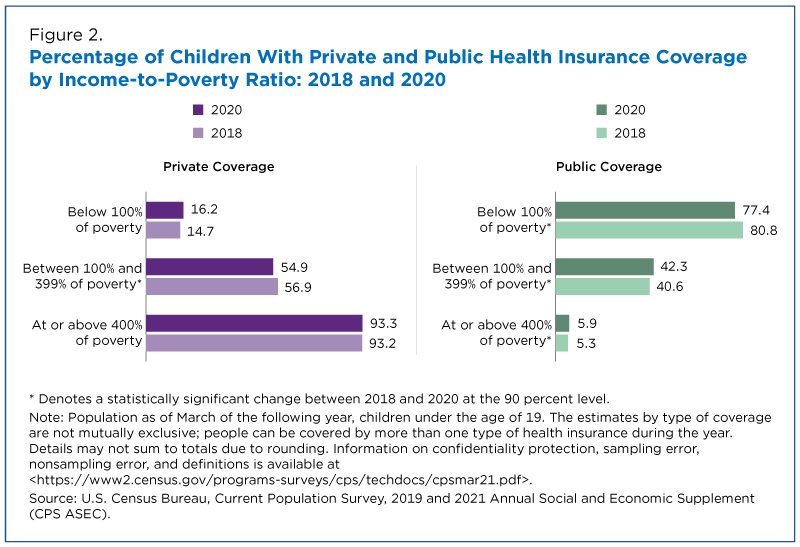
There was no significant change in private coverage rates for children under the age of 19 with family incomes of 400% of poverty or higher. However, the percentage of children in this group with public coverage increased by 0.7 percentage points to 5.9%, contributing to the drop in the uninsured rate for this group.
Children’s Health Coverage and State Medicaid Expansion
The Patient Protection and Affordable Care Act offered the option for states to expand Medicaid eligibility to those living below 138% of poverty. As of Jan. 1, 2020, 35 states and the District of Columbia had expanded Medicaid, while 15 did not.
In 2020, the uninsured rate was lower for children living in expansion states (4.0%) than for children living in nonexpansion states (8.5%) (Figure 3).
Between 2018 and 2020, the uninsured rate did not significantly change for children living in either expansion or nonexpansion states. However, changes occurred across years in private and public coverage for those living in expansion and nonexpansion states.
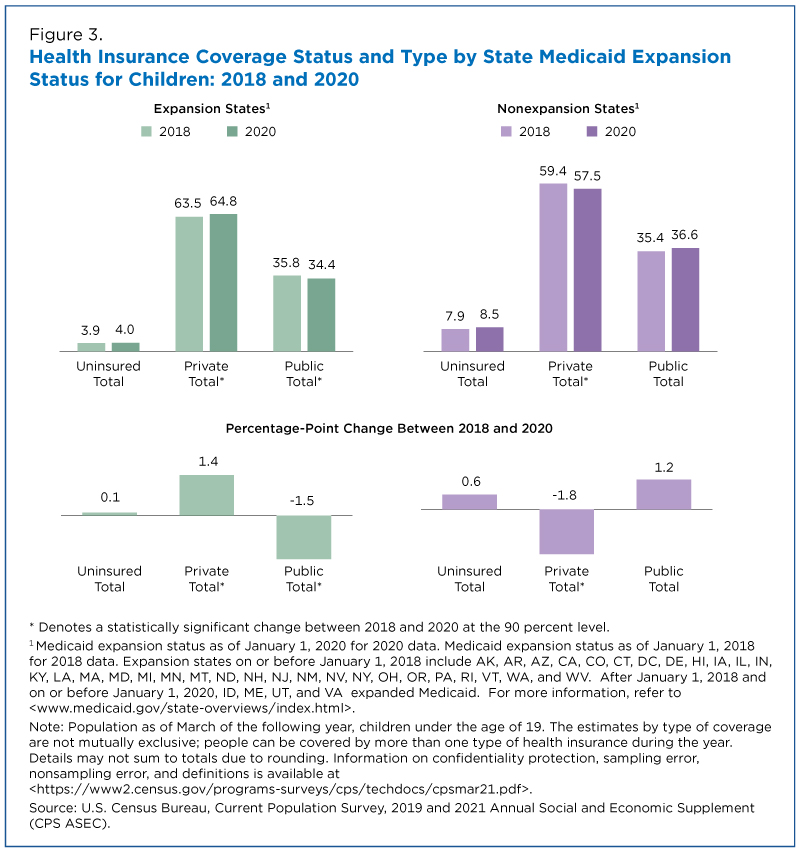
For children living in nonexpansion states, the change in public coverage between 2018 and 2020 was not significant.
But for children covered by private insurance in nonexpansion states, the percentage dropped by 1.8 percentage points to 57.5%. This decline in private coverage contributed to the rise in the uninsured rate for children in nonexpansion states.
The opposite occurred for children in expansion states: private coverage increased by 1.4 percentage points between 2018 and 2020, to 64.8%, while the percentage of children with public coverage fell by 1.5 percentage points during this period.
There was no significant change in the number of children with public coverage in expansion states between 2018 and 2020.
Eligibility Changes
Although these results may seem surprising, they could reflect a change in the proportion of children eligible for public coverage in expansion states.
In some expansion states, children may be eligible for coverage through Medicaid and CHIP even if their family incomes exceed the poverty level.
The percentage of children living in poverty and the percentage of children with family incomes between 100% and 399% of poverty in expansion states decreased by 0.9 percentage points and 2.1 percentage points, respectively (Figure 4).

Lisa N. Bunch is a survey statistician and Amogh U. Bandekar is an intern with the Census Bureau’s Health and Disability Statistics Branch.
America Counts Story
Who Was Lifted Out of Poverty by Stimulus Payments?
Supplemental Poverty Measure shows that the first two rounds of stimulus payments during the pandemic helped pull 11.7 million people out of poverty in 2020.
America Counts Story
Did Unemployment Insurance Lower Official Poverty Rates in 2020?
Expanded unemployment insurance benefits and eligibility during the pandemic lowered the overall poverty rate by 1.4 percentage points to 11.4% in 2020.
America Counts Story
Pandemic Earnings Decline but Increase for Full-Time, Yearly Workers
How could earnings for full-time, year-round workers go up while earnings fell for all workers? There were fewer low-wage full-time, year-round workers.
America Counts Story
Private Health Coverage of Adults Drops From Early 2019 to Early 2021
In early 2020, a decline in the number of working-age adults with private health insurance was offset by an increase in public health insurance programs.
America Counts Story
Understanding Equity Through Census Bureau Data
U.S. Census Bureau surveys and programs provide insight into social, economic and housing equity gaps in the United States.
Page Last Revised - June 10, 2022
✕
Is this page helpful?
 Yes
Yes
 No
No
 Yes
Yes
 No
No✕
NO THANKS
255 characters maximum
 255 characters maximum reached
✕
Thank you for your feedback.
Comments or suggestions?

Comments or suggestions?