Tabbed Page Component
The Tabbed Page Component creates custom tabs to display full page content under each tab. In order to use this component you must submit a Jira ticket to CNMP requesting it be enabled for a specific page.
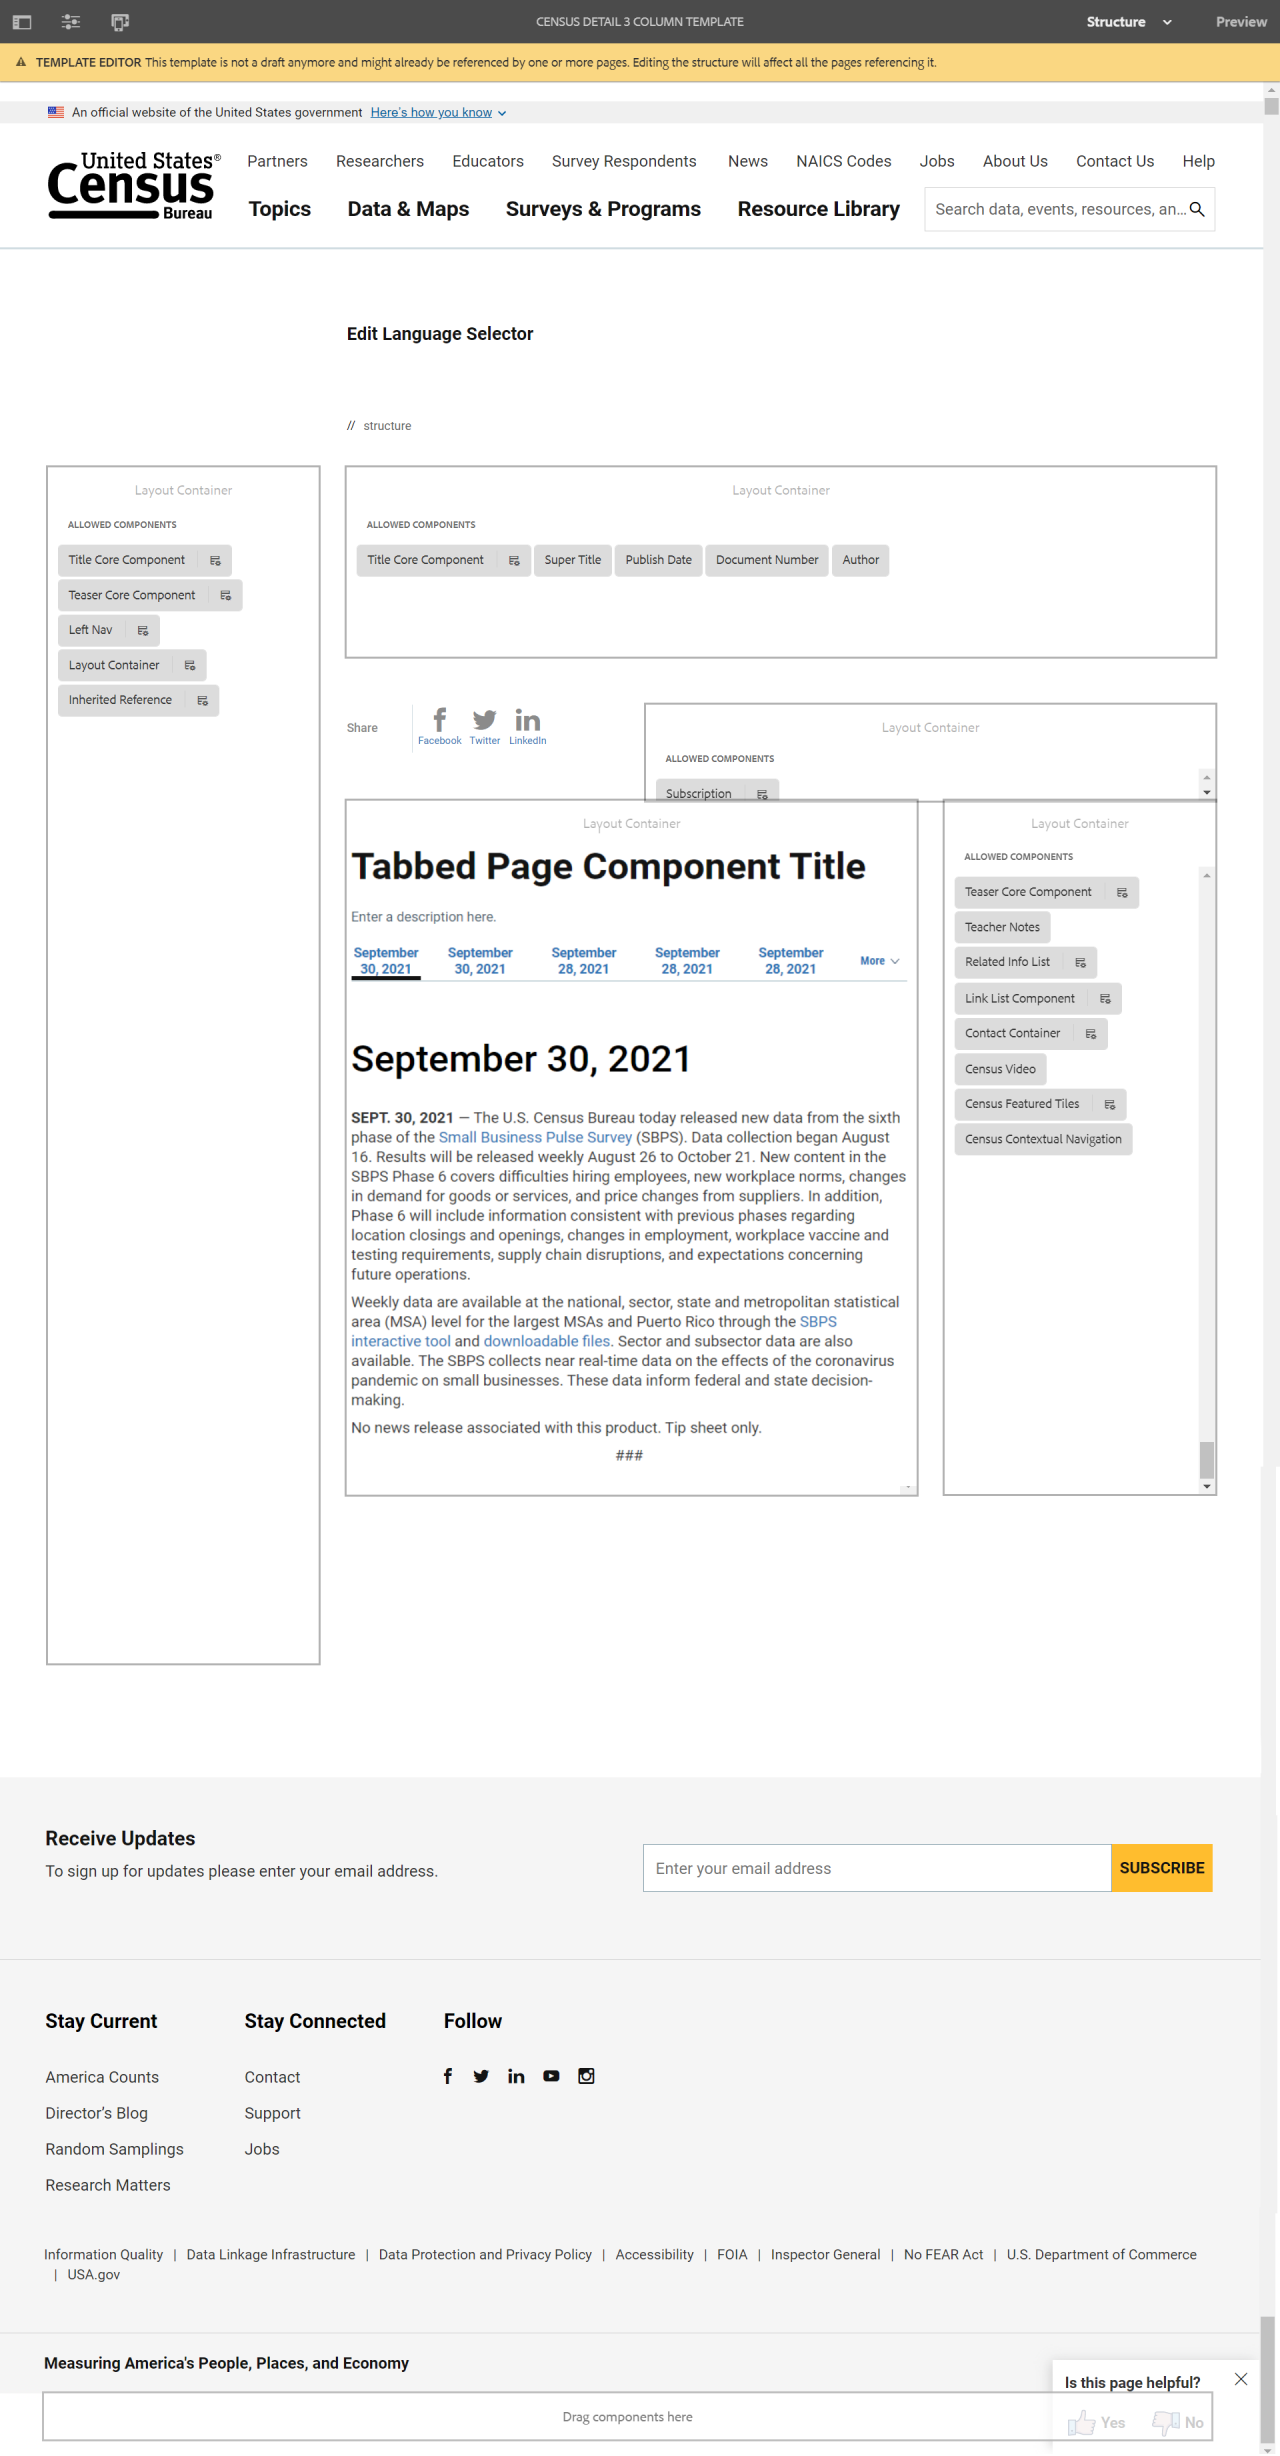
The Tabbed Page Component displays full page content under each tab. Users navigate between the tabs to access the page content. The component displays one page per tab.
The difference between this component and the tab component, is this component uses the standard sorting choices (building the tab order) of publication date, collection year or month, and reference year or month.
Example
View on public site:

Examples by Template
When to Use
Tabbed Page Component is useful for pages designed to display a high volume of previews for related datasets, releases, reports, interactive visuals, and other such pages. Tabs provide a manner by which to organize these related materials.
An author should use the Tabbed Page Component when they have a set of pages, releases, or data that lends to being organized by a preset order to parse items.
Usage
In contrast to the Tab Component, the Tabbed Page Component does not rely on the author to manually order the tabs; instead, it offers preset manners by which to order the tabs. Tabs can be built by collection month/year, by reference month/year, or by publication date and can be sorted manually or from oldest to newest or newest to oldest.
Content authors should use the Tabbed Page Component when they have a set of pages, releases, or data that tends to be organized by a preset order to parse items.
Web Recommendation
Individual pages that are in tabs should have redirects to their tabbed versions. While not required for these pages it is strongly recommended.
This way users can only see the tabbed version of the page. The redirect is found under Page Properties > Advanced tab.
Tabbed Page Component Title
SEPT. 30, 2021 — Today the U.S. Census Bureau released 2019 Business Dynamics Statistics (BDS) data in the Census API and on data.census.gov. This is in addition to the data released September 22 in CSV format on the BDS website. The BDS data are an annual time series covering the years 1978 to 2019. The data provide measures of business dynamics (such as job creation and destruction, establishment births and deaths, and firm startups and shutdowns) for the economy overall and aggregated by establishment and firm characteristics.
The 2019 data are also now available in the BDS Explorer. The data tool provides access to the entire BDS dataset via line charts, bar charts and thematic maps. The application's intuitive dashboard allows for the construction of tables and charts to compare and sort measures of business dynamism.
To learn more, visit BDS Explorer and BDS.
No news release associated with this product. Tip sheet only.
###
Configure Dialog
The configure dialog allows the content author to define multiple tabs. See below for more about the Tab Component dialog.
Tab: Page Tab
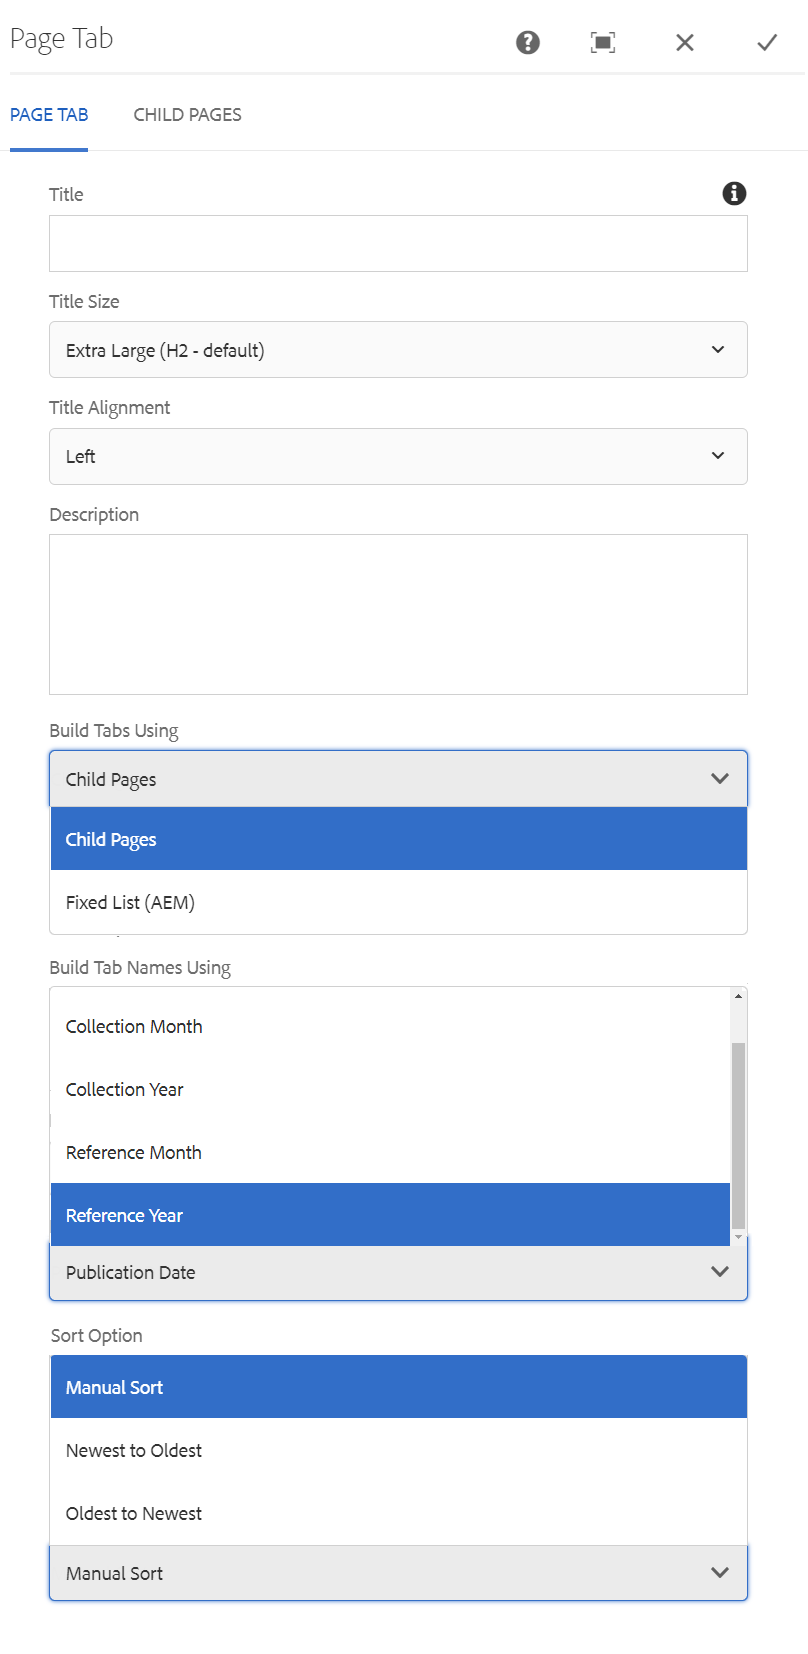
- Title – If you'd like to add a Section Title, insert it here.
- Title Size – Size of the title text. (H2 default)
- Title Alignment – Overrides the default alignment of the title text.
- Description – If you'd like to add a description, insert it here.
- Build Tabs Using – Choose between Child Pages or Fixed List (AEM)
- Build Tab Names Using – Choose between Publication Date, Collection Month, Collection Year, Reference Month, or Reference Year.
- Sort Option – Choose between Manual Sort, Newest to Oldest, or Oldest to Newest.
Tab: Child Pages
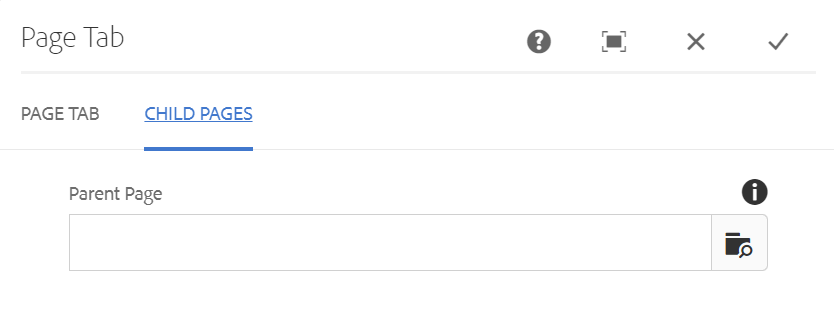
- Parent Page – Allows you to select a page to list its child pages (i.e., pages nested under the selected page).
Tab: Fixed List (AEM)
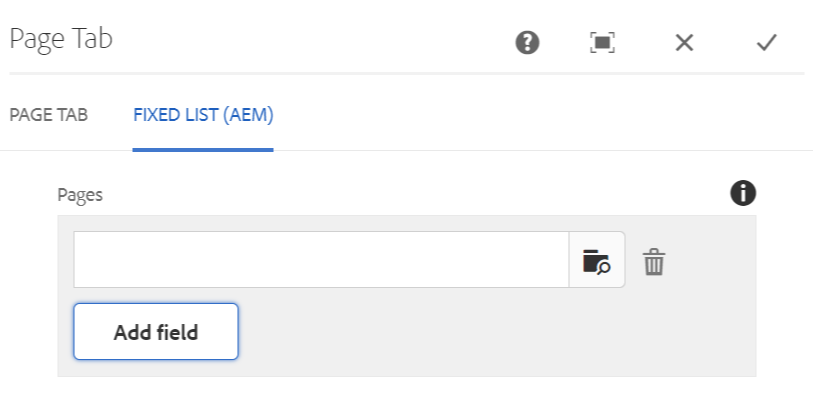
- Add Field – Allows you to select specific AEM pages to build tabs.
Developer Resources
Expand the section below to see the Tabbed Page Component HTML output.
 Yes
Yes
 No
NoComments or suggestions?