Tabbed Page Component
The Tabbed Page Component creates custom tabs to display full page content under each tab. In order to use this component you must submit a Jira ticket to CNMP requesting it be enabled for a specific page.
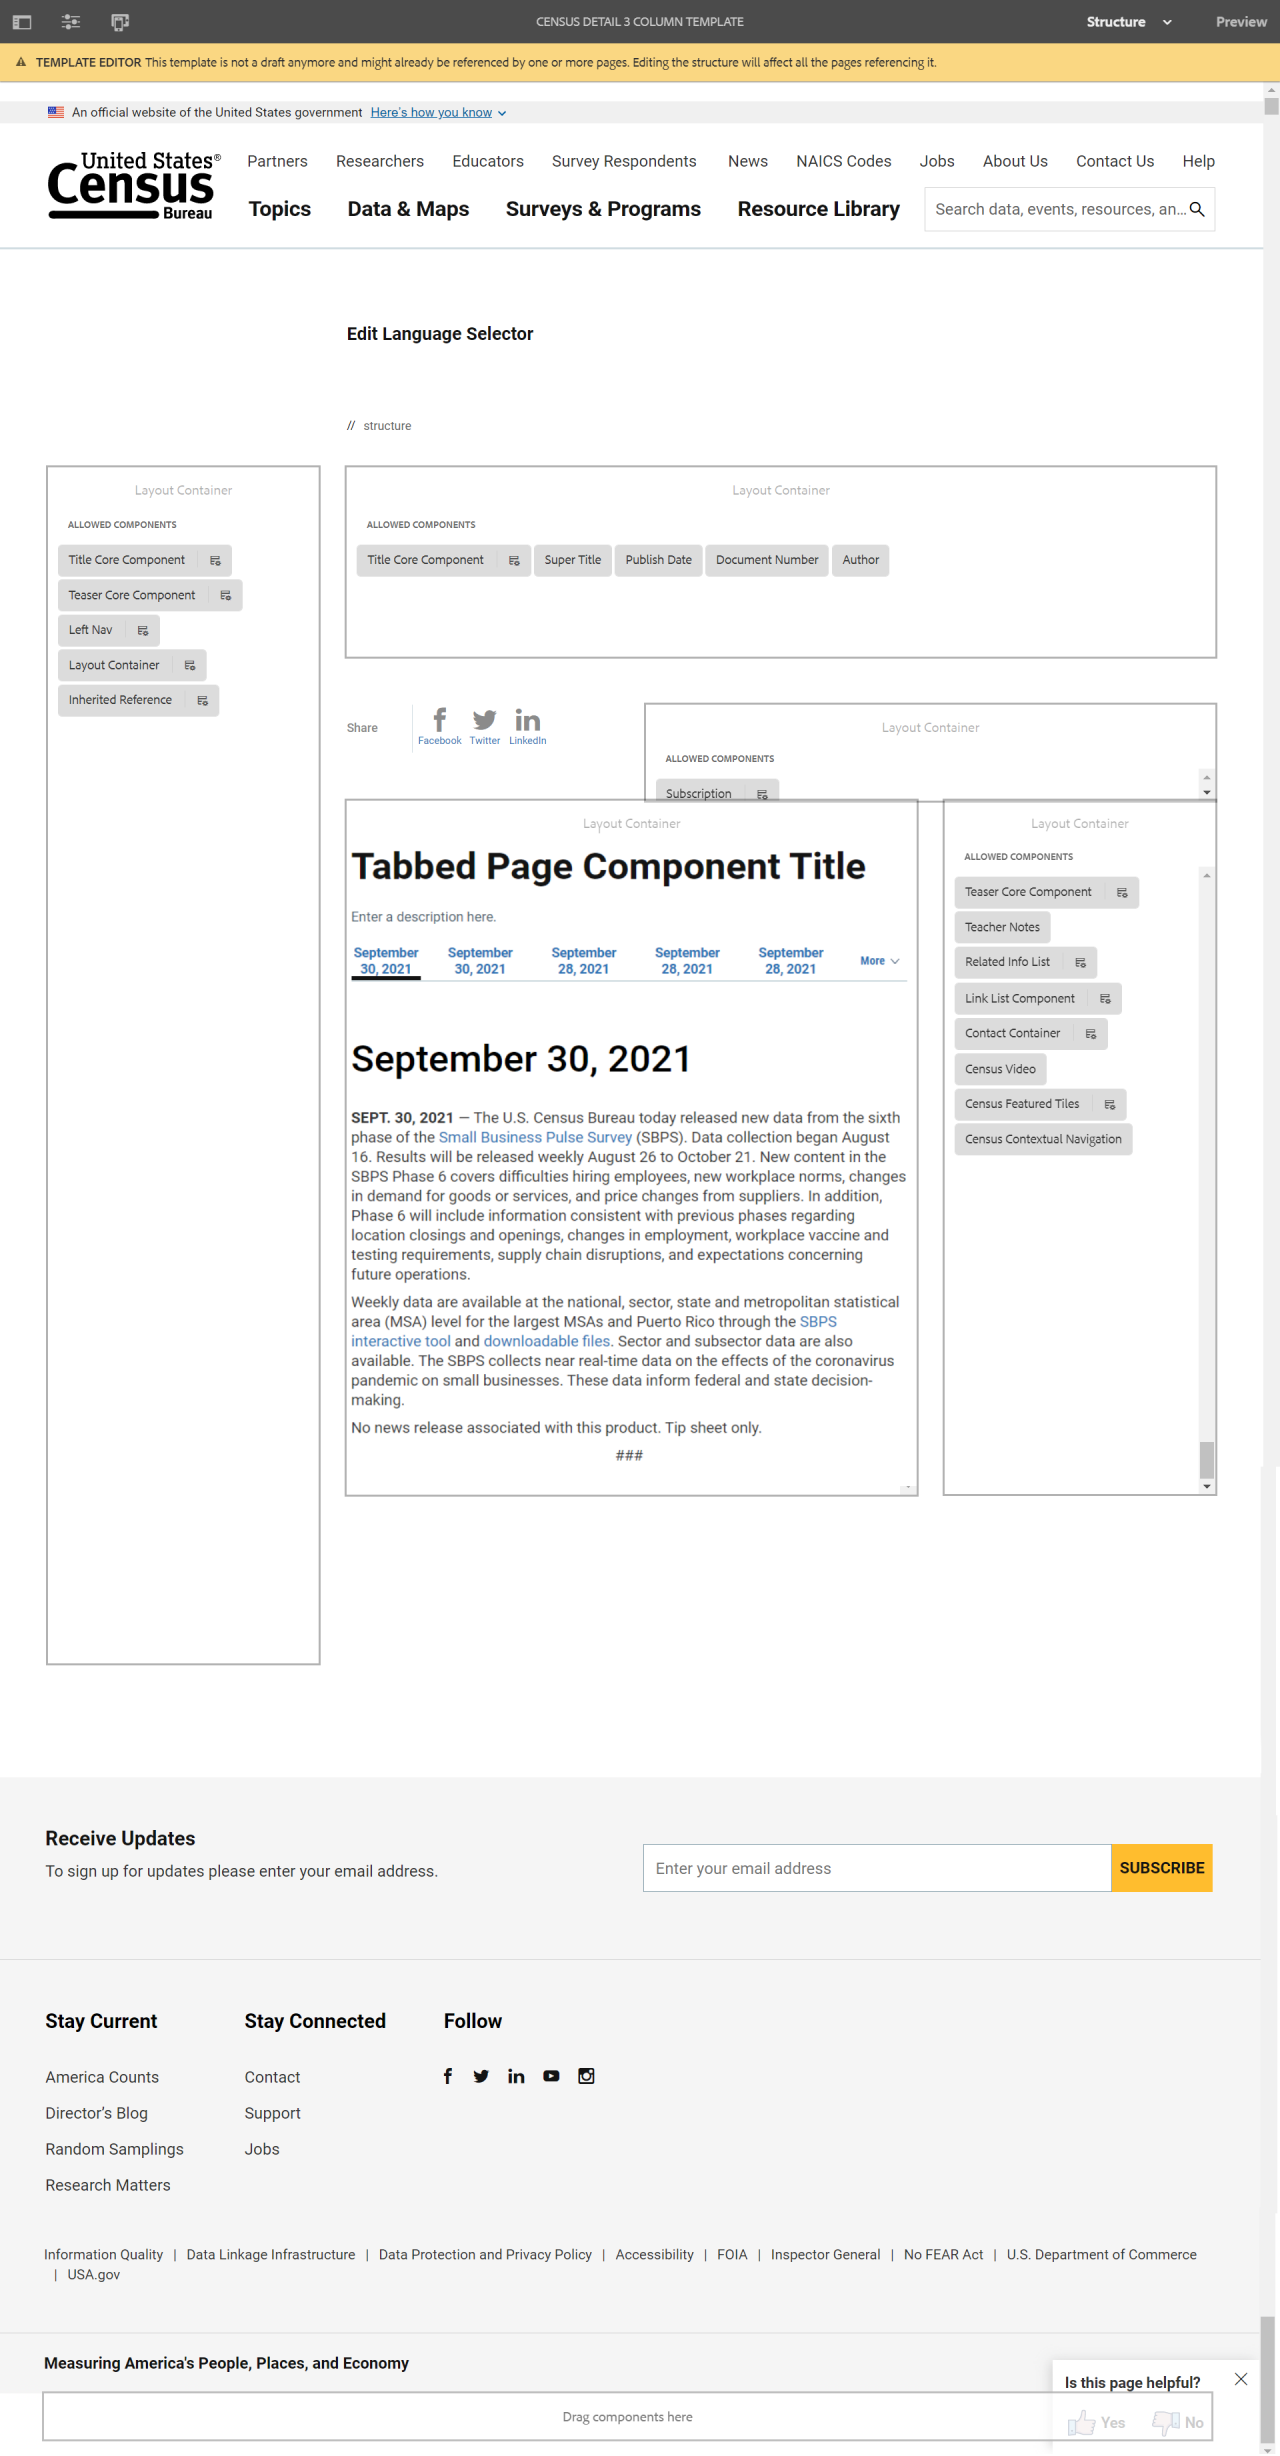
The Tabbed Page Component displays full page content under each tab. Users navigate between the tabs to access the page content. The component displays one page per tab.
The difference between this component and the tab component, is this component uses the standard sorting choices (building the tab order) of publication date, collection year or month, and reference year or month.
Example
View on public site:

Examples by Template
When to Use
Tabbed Page Component is useful for pages designed to display a high volume of previews for related datasets, releases, reports, interactive visuals, and other such pages. Tabs provide a manner by which to organize these related materials.
An author should use the Tabbed Page Component when they have a set of pages, releases, or data that lends to being organized by a preset order to parse items.
Usage
In contrast to the Tab Component, the Tabbed Page Component does not rely on the author to manually order the tabs; instead, it offers preset manners by which to order the tabs. Tabs can be built by collection month/year, by reference month/year, or by publication date and can be sorted manually or from oldest to newest or newest to oldest.
Content authors should use the Tabbed Page Component when they have a set of pages, releases, or data that tends to be organized by a preset order to parse items.
Web Recommendation
Individual pages that are in tabs should have redirects to their tabbed versions. While not required for these pages it is strongly recommended.
This way users can only see the tabbed version of the page. The redirect is found under Page Properties > Advanced tab.
Tabbed Page Component Title
NOV. 23, 2021 — The U.S. Census Bureau today released new data tables from the 2020 Service Annual Survey (SAS). The SAS table package provides statistics on revenue, payroll, sources of revenue, expenses, exports, inventory, revenue from electronic sources and other selected industry-specific data for service industries.
The data are accompanied by supporting materials including a data visualization. A summary brief is also scheduled to be released soon. The data visualization provides revenue statistics for all sectors covered by the Service Annual Survey. The visualization has data from 2018, 2019 and 2020, as well as the annual percent change of these estimates. This brief presents revenue and expense estimates at the sector level and select subsector or industry group levels published in the 2020 Service Annual Survey. Data are based on the 2012 North American Industry Classification System (NAICS).
These data come from a sample of approximately 78,000 service businesses with paid employees. Administrative records data or imputed values supplement the survey to account for nonresponse, nonemployers and certain other businesses. The Census Bureau has conducted the SAS annually since 1982.
For more information, including confidentiality protection, sampling error, nonsampling error and definitions, visit the Census Bureau’s Service Annual Survey website.
No news release associated with this product. Tip sheet only.
###
Configure Dialog
The configure dialog allows the content author to define multiple tabs. See below for more about the Tab Component dialog.
Tab: Page Tab
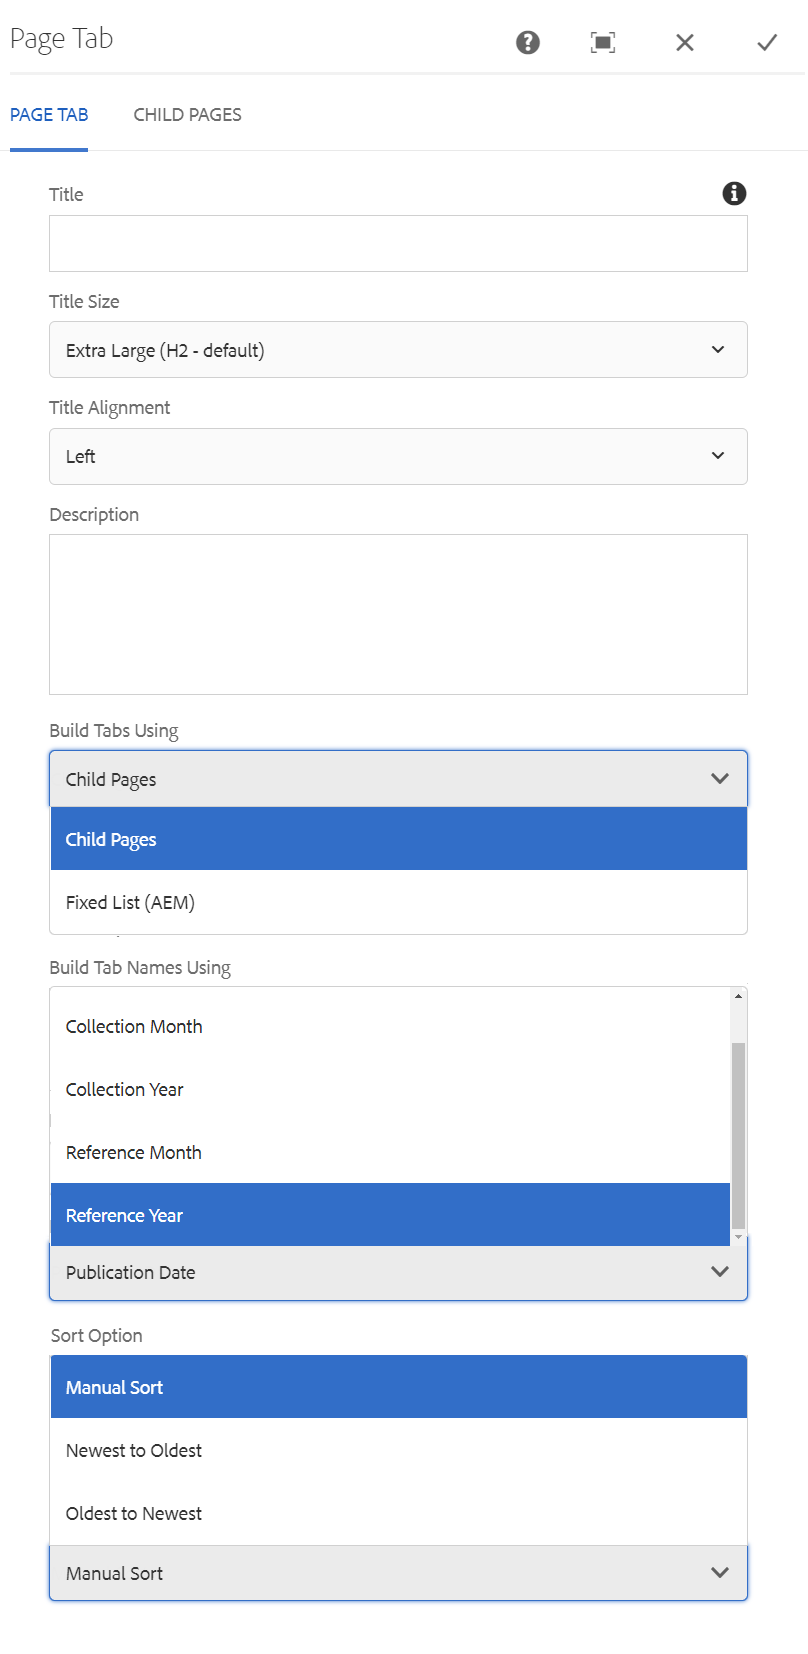
- Title – If you'd like to add a Section Title, insert it here.
- Title Size – Size of the title text. (H2 default)
- Title Alignment – Overrides the default alignment of the title text.
- Description – If you'd like to add a description, insert it here.
- Build Tabs Using – Choose between Child Pages or Fixed List (AEM)
- Build Tab Names Using – Choose between Publication Date, Collection Month, Collection Year, Reference Month, or Reference Year.
- Sort Option – Choose between Manual Sort, Newest to Oldest, or Oldest to Newest.
Tab: Child Pages
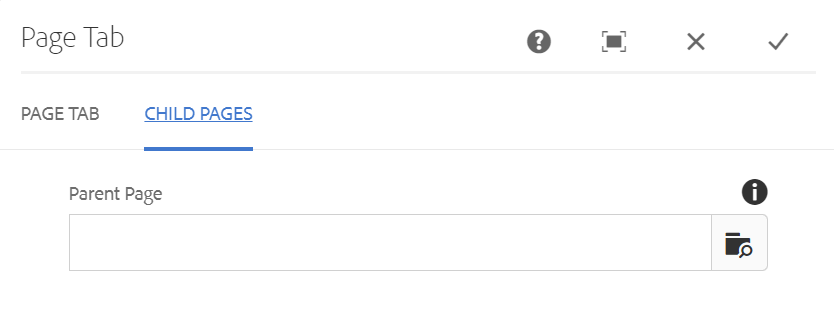
- Parent Page – Allows you to select a page to list its child pages (i.e., pages nested under the selected page).
Tab: Fixed List (AEM)
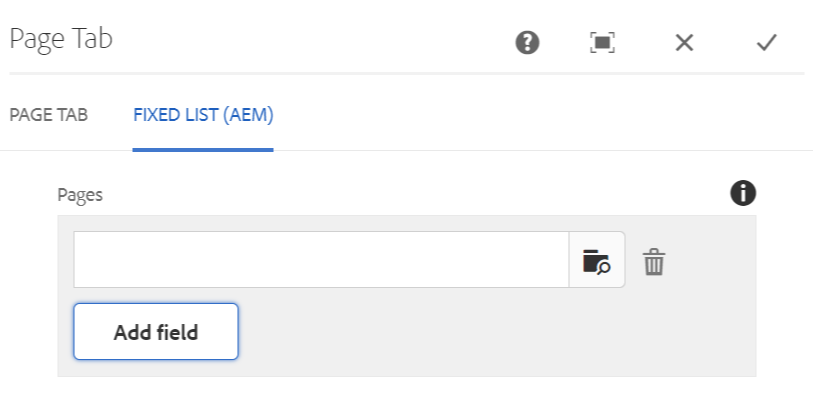
- Add Field – Allows you to select specific AEM pages to build tabs.
Developer Resources
Expand the section below to see the Tabbed Page Component HTML output.
 Yes
Yes
 No
NoComments or suggestions?