Tabbed Page Component
The Tabbed Page Component creates custom tabs to display full page content under each tab. In order to use this component you must submit a Jira ticket to CNMP requesting it be enabled for a specific page.
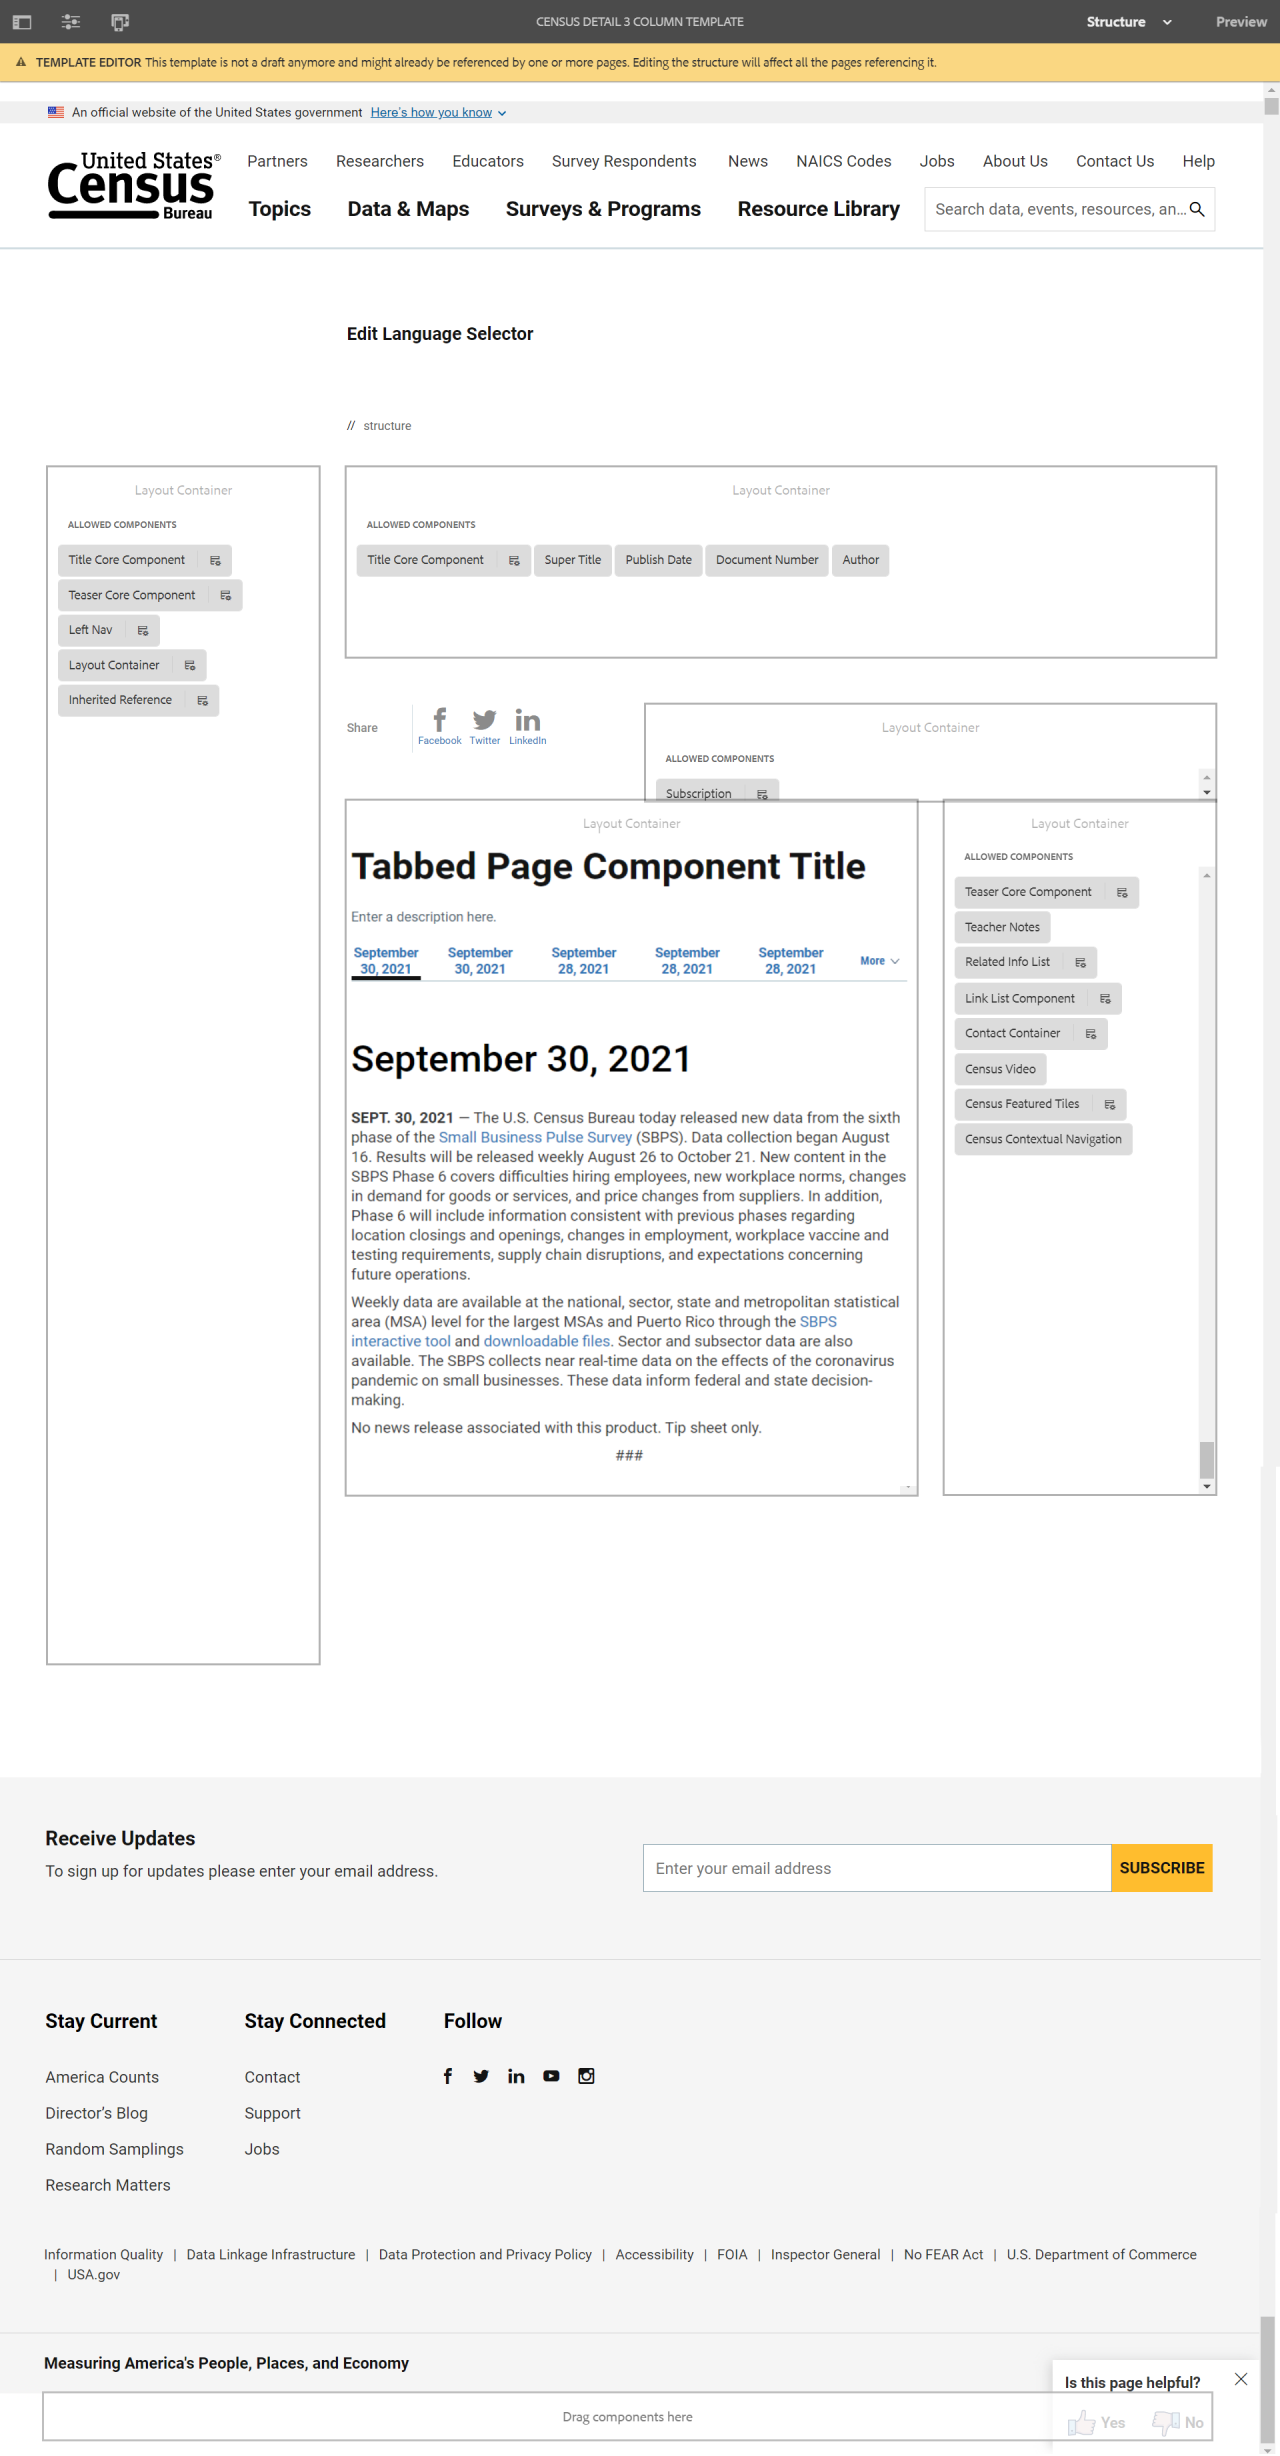
The Tabbed Page Component displays full page content under each tab. Users navigate between the tabs to access the page content. The component displays one page per tab.
The difference between this component and the tab component, is this component uses the standard sorting choices (building the tab order) of publication date, collection year or month, and reference year or month.
Example
View on public site:

Examples by Template
When to Use
Tabbed Page Component is useful for pages designed to display a high volume of previews for related datasets, releases, reports, interactive visuals, and other such pages. Tabs provide a manner by which to organize these related materials.
An author should use the Tabbed Page Component when they have a set of pages, releases, or data that lends to being organized by a preset order to parse items.
Usage
In contrast to the Tab Component, the Tabbed Page Component does not rely on the author to manually order the tabs; instead, it offers preset manners by which to order the tabs. Tabs can be built by collection month/year, by reference month/year, or by publication date and can be sorted manually or from oldest to newest or newest to oldest.
Content authors should use the Tabbed Page Component when they have a set of pages, releases, or data that tends to be organized by a preset order to parse items.
Web Recommendation
Individual pages that are in tabs should have redirects to their tabbed versions. While not required for these pages it is strongly recommended.
This way users can only see the tabbed version of the page. The redirect is found under Page Properties > Advanced tab.
Tabbed Page Component Title

FEB. 18, 2021 — Today the U.S. Census Bureau released data from the 2019 Annual Survey of Manufactures.
The U.S. manufacturing sector’s value of shipments decreased 2.7%, from $5.9 trillion in 2018 to $5.7 trillion in 2019.
Other highlights include:
- The total value of shipments for the Petroleum Refineries industry (NAICS 324110) was $547.4 billion. This was a 12.4% decrease from 2018.
- The total value of shipments for the Iron and Steel Mills and Ferroalloy Manufacturing industry (NAICS 331110) was $93.7 billion. This was a 8.6% decrease from 2018.
- Among states and equivalents, manufacturing shipments in 2019 ranged from $438.5 million in the District of Columbia to $599.8 billion in Texas.
The 2019 Annual Survey of Manufactures provides manufacturing statistics that are crucial to accurate estimates of domestic production and productivity and to making sound decisions on economic trade policies. Companies, business analysts and trade associations use these data in planning investments, production and marketing. These data are published annually, except in years ending in 2 and 7, at which time they are included in the manufacturing sector of the economic census.
The 2019 General Statistics for Industry Groups and Industries table presents data at the two- through six-digit NAICS levels on statistics such as employment, payroll, cost of materials, operating expenses, value of shipments, value added, and inventories.
The Geographic Area Statistics Summary Statistics for Industry Groups and Industries and Supplemental Statistics tables present manufacturing data for the United States and states at the two- through four-digit NAICS levels and supplemental statistics for the United States and each state at the two-digit NAICS level.
No news release associated with this product. Tip sheet only.
The statistics in this report are estimated from sample surveys and are subject to sampling variability as well as nonsampling error including bias and variance from response, nonreporting and undercoverage. For more information about the Annual Survey of Manufactures methodology, visit www.census.gov/programs-surveys/asm/technical-documentation/methodology.html.
###
Configure Dialog
The configure dialog allows the content author to define multiple tabs. See below for more about the Tab Component dialog.
Tab: Page Tab
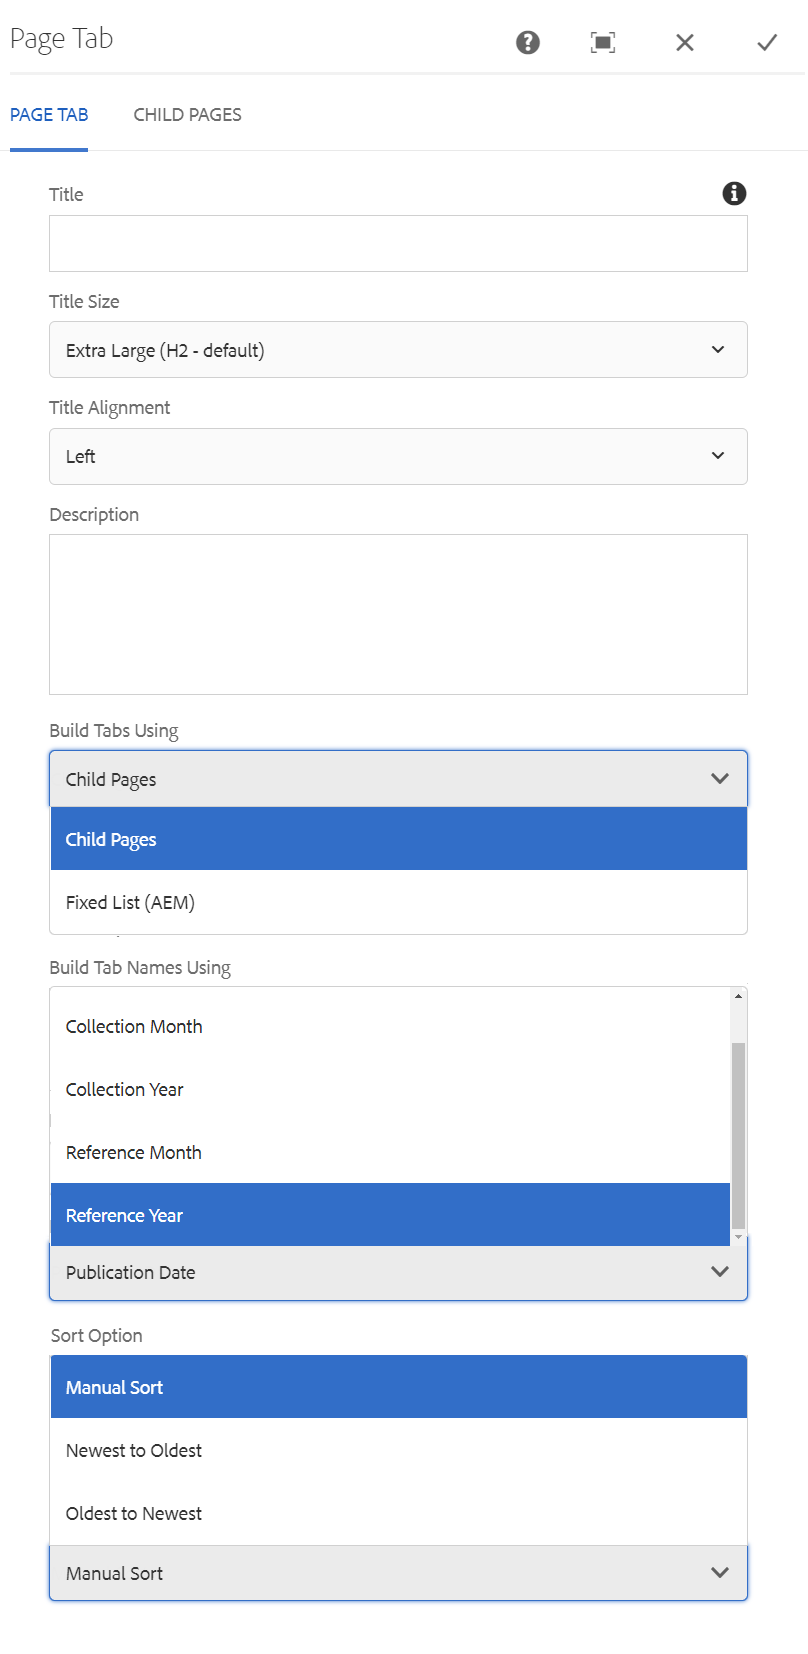
- Title – If you'd like to add a Section Title, insert it here.
- Title Size – Size of the title text. (H2 default)
- Title Alignment – Overrides the default alignment of the title text.
- Description – If you'd like to add a description, insert it here.
- Build Tabs Using – Choose between Child Pages or Fixed List (AEM)
- Build Tab Names Using – Choose between Publication Date, Collection Month, Collection Year, Reference Month, or Reference Year.
- Sort Option – Choose between Manual Sort, Newest to Oldest, or Oldest to Newest.
Tab: Child Pages
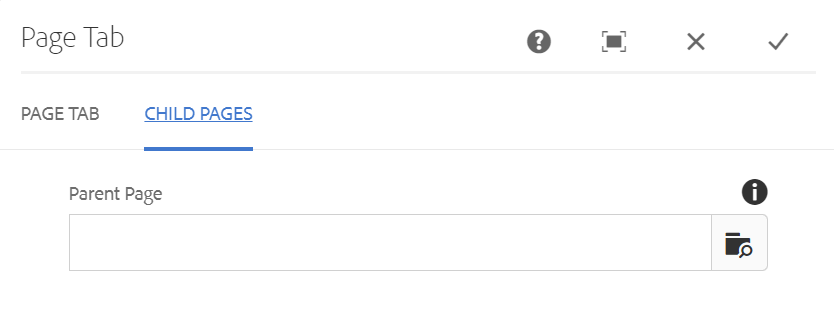
- Parent Page – Allows you to select a page to list its child pages (i.e., pages nested under the selected page).
Tab: Fixed List (AEM)
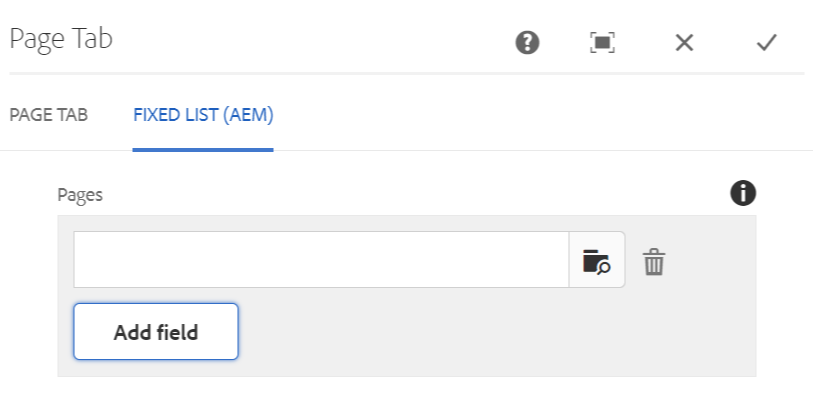
- Add Field – Allows you to select specific AEM pages to build tabs.
Developer Resources
Expand the section below to see the Tabbed Page Component HTML output.
 Yes
Yes
 No
NoComments or suggestions?