Tabbed Page Component
The Tabbed Page Component creates custom tabs to display full page content under each tab. In order to use this component you must submit a Jira ticket to CNMP requesting it be enabled for a specific page.
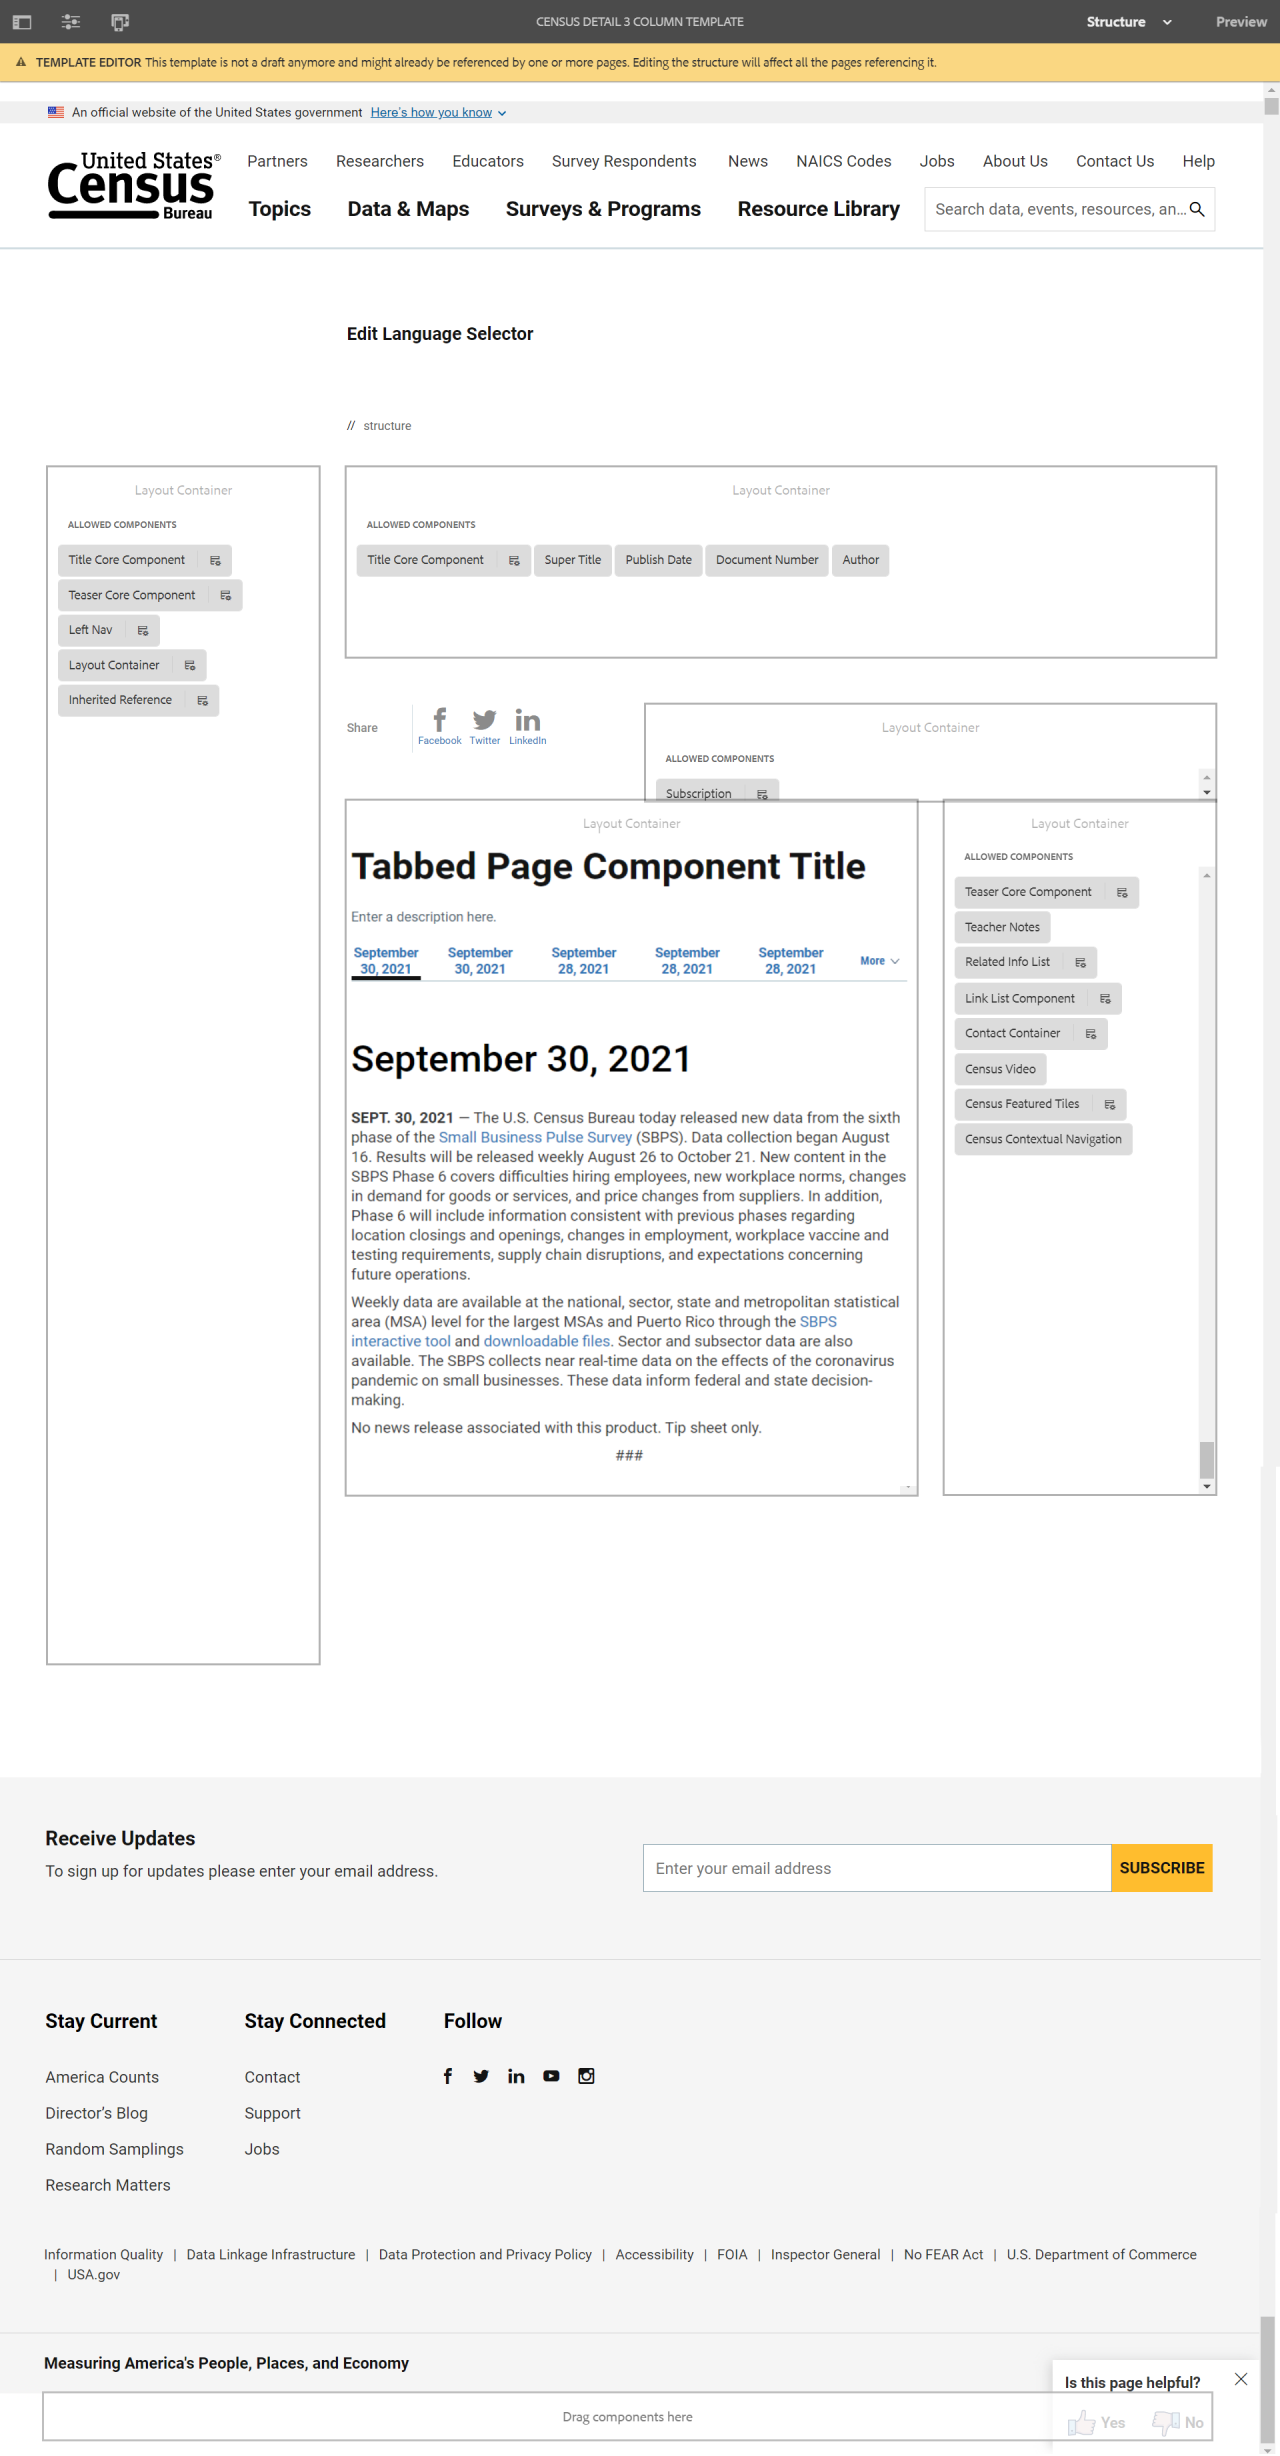
The Tabbed Page Component displays full page content under each tab. Users navigate between the tabs to access the page content. The component displays one page per tab.
The difference between this component and the tab component, is this component uses the standard sorting choices (building the tab order) of publication date, collection year or month, and reference year or month.
Example
View on public site:

Examples by Template
Census 3 Column
When to Use
Tabbed Page Component is useful for pages designed to display a high volume of previews for related datasets, releases, reports, interactive visuals, and other such pages. Tabs provide a manner by which to organize these related materials.
An author should use the Tabbed Page Component when they have a set of pages, releases, or data that lends to being organized by a preset order to parse items.
Usage
In contrast to the Tab Component, the Tabbed Page Component does not rely on the author to manually order the tabs; instead, it offers preset manners by which to order the tabs. Tabs can be built by collection month/year, by reference month/year, or by publication date and can be sorted manually or from oldest to newest or newest to oldest.
Content authors should use the Tabbed Page Component when they have a set of pages, releases, or data that tends to be organized by a preset order to parse items.
Web Recommendation
Individual pages that are in tabs should have redirects to their tabbed versions. While not required for these pages it is strongly recommended.
This way users can only see the tabbed version of the page. The redirect is found under Page Properties > Advanced tab.
Tabbed Page Component Title
December 21, 2021
Estimates Show Slowest Growth on Record for the Nation’s Population
DEC. 21, 2021 — According to the U.S. Census Bureau’s Vintage 2021 national and state population estimates and components of change released today, the population of the United States grew in the past year by 392,665, or 0.1%, the lowest rate since the nation’s founding. The slow rate of growth can be attributed to decreased net international migration, decreased fertility, and increased mortality due in part to the COVID-19 pandemic.
“Population growth has been slowing for years because of lower birth rates and decreasing net international migration, all while mortality rates are rising due to the aging of the nation’s population,” said Kristie Wilder, a demographer in the Population Division at the Census Bureau. “Now, with the impact of the COVID-19 pandemic, this combination has resulted in a historically slow pace of growth.”

Since April 1, 2020 (Census Day), the nation’s population increased from 331,449,281 to 331,893,745, a gain of 444,464, or 0.13%.
Between July 1, 2020, and July 1, 2021, the nation’s growth was due to natural increase (148,043), which is the number of excess births over deaths, and net international migration (244,622). This is the first time that net international migration (the difference between the number of people moving into the country and out of the country) has exceeded natural increase for a given year.
The voting-age resident population, adults age 18 and over, grew to 258.3 million, comprising 77.8% of the population in 2021.
The South, with a population of 127,225,329, was the most populous of the four regions (encompassing 38.3% of the total national population) and was the only region that had positive net domestic migration of 657,682 (the movement of people from one area to another within the United States) between 2020 and 2021. The Northeast region, the least populous of the four regions with a population of 57,159,838 in 2021, experienced a population decrease of -365,795 residents due to natural decrease (-31,052) and negative net domestic migration (-389,638).
The West saw a gain in population (35,868) despite losing residents via negative net domestic migration (-144,941). Growth in the West was due to natural increase (143,082) and positive net international migration (38,347).
Between 2020 and 2021, 33 states saw population increases and 17 states and the District of Columbia lost population, 11 of which had losses of over 10,000 people. This is a historically large number of states to lose population in year.
Also released today were national- and state-level estimates of the components of population change, which include tables on births, deaths and migration.
Puerto Rico Population Estimates
Puerto Rico’s population decreased by 17,954 people (-0.5%) between 2020 and 2021 after seeing a slight increase from 2019 to 2020. This decrease in Puerto Rico’s population was largely due to natural decrease (-14,173) and negative net international migration (-3,781).
State Highlights
- With a population of 29,527,941 in 2021, Texas had the largest annual and cumulative numeric gain, increasing by 310,288 (1.1%) and 382,436 (1.3%), respectively.
- While gaining population through net international migration (27,185), the growth in Texas in the last year was primarily due to gains from net domestic migration (170,307) and natural increase (113,845).
- Idaho had the fastest annual and cumulative population increase, growing by 2.9% (53,151) in the last year, and by 3.4% (61,817) since April 1, 2020.
- Idaho made modest gains from natural increase (4,398) and net international migration (413); however, the main driver of its fast increase was net domestic migration (48,876).
- New York had the largest annual and cumulative numeric population decline, decreasing by 319,020 (1.6%) and 365,336 (1.8%), respectively.
- New York’s declining population in the last year was attributed to negative domestic migration (-352,185).
- Over the past year, the District of Columbia’s population declined by 2.9%, or 20,043 residents, to a population of 670,050 in 2021. This was the largest annual percent decrease in the nation.
- The decline in the District of Columbia’s population can be attributed to negative net domestic migration (-23,030), which was large enough to offset gains from natural increase (2,171) and net international migration (1,128).
- Three states had populations above 20 million in 2021: California (39,237,836), Texas (29,527,941) and Florida (21,781,128). New York dropped below 20 million people in the last year, decreasing from 20,154,933 to 19,835,913.
Components of Change Highlights
- The largest net domestic migration gains were in Florida (220,890), Texas (170,307) and Arizona (93,026).
- All 50 states and the District of Columbia saw positive net international migration. Florida (38,590), Texas (27,185) and New York (18,307) had the largest population gains from net international migration.
- Twenty-five states experienced natural decrease in 2021, where there were more deaths than births. This was attributed to further decreases in fertility combined with increased mortality. Florida had the highest natural decrease at -45,248, followed by Pennsylvania (-30,878) and Ohio (-15,811).
- In 2021, 20 states and the District of Columbia lost residents via net domestic migration. Largest domestic migration losses were in California (-367,299), New York (-352,185) and Illinois (-122,460).
The Population Estimates Program uses current data on births, deaths and migration to calculate population change since the most recent decennial census date and produce a time series of estimates of population, demographic components of change, and housing units. The annual time series of estimates begins with the most recent decennial census date and extends to the vintage year. This is the first release of population estimates data developed from a base population that integrates the 2020 Census, Vintage 2020 estimates, and 2020 Demographic Analysis estimates. Comparisons to previous years are not recommended.
###
Table 1.
| Top 10 Most Populous States: 2021 | ||||
| Rank | Geographic Area | April 1, 2020 (Estimates Base) |
July 1, 2020 | July 1, 2021 |
| 1 | California | 39,538,223 | 39,499,738 | 39,237,836 |
| 2 | Texas | 29,145,505 | 29,217,653 | 29,527,941 |
| 3 | Florida | 21,538,187 | 21,569,932 | 21,781,128 |
| 4 | New York | 20,201,249 | 20,154,933 | 19,835,913 |
| 5 | Pennsylvania | 13,002,700 | 12,989,625 | 12,964,056 |
| 6 | Illinois | 12,812,508 | 12,785,245 | 12,671,469 |
| 7 | Ohio | 11,799,448 | 11,790,587 | 11,780,017 |
| 8 | Georgia | 10,711,908 | 10,725,800 | 10,799,566 |
| 9 | North Carolina | 10,439,388 | 10,457,177 | 10,551,162 |
| 10 | Michigan | 10,077,331 | 10,067,664 | 10,050,811 |
Table 2.
| Top 10 States in Numeric Growth, 2020 to 2021 | |||||
| Rank | Geographic Area | April 1, 2020 (Estimates Base) |
July 1, 2020 | July 1, 2021 | Numeric Growth |
| 1 | Texas | 29,145,505 | 29,217,653 | 29,527,941 | 310,288 |
| 2 | Florida | 21,538,187 | 21,569,932 | 21,781,128 | 211,196 |
| 3 | Arizona | 7,151,502 | 7,177,986 | 7,276,316 | 98,330 |
| 4 | North Carolina | 10,439,388 | 10,457,177 | 10,551,162 | 93,985 |
| 5 | Georgia | 10,711,908 | 10,725,800 | 10,799,566 | 73,766 |
| 6 | South Carolina | 5,118,425 | 5,130,729 | 5,190,705 | 59,976 |
| 7 | Utah | 3,271,616 | 3,281,684 | 3,337,975 | 56,291 |
| 8 | Tennessee | 6,910,840 | 6,920,119 | 6,975,218 | 55,099 |
| 9 | Idaho | 1,839,106 | 1,847,772 | 1,900,923 | 53,151 |
| 10 | Nevada | 3,104,614 | 3,114,071 | 3,143,991 | 29,920 |
Table 3.
| Top 10 States in Percent Growth, 2020 to 2021 | |||||
| Rank | Geographic Area | April 1, 2020 (Estimates Base) |
July 1, 2020 | July 1, 2021 | Percent Growth |
| 1 | Idaho | 1,839,106 | 1,847,772 | 1,900,923 | 2.9% |
| 2 | Utah | 3,271,616 | 3,281,684 | 3,337,975 | 1.7% |
| 3 | Montana | 1,084,225 | 1,086,193 | 1,104,271 | 1.7% |
| 4 | Arizona | 7,151,502 | 7,177,986 | 7,276,316 | 1.4% |
| 5 | South Carolina | 5,118,425 | 5,130,729 | 5,190,705 | 1.2% |
| 6 | Delaware | 989,948 | 991,886 | 1,003,384 | 1.2% |
| 7 | Texas | 29,145,505 | 29,217,653 | 29,527,941 | 1.1% |
| 8 | Florida | 21,538,187 | 21,569,932 | 21,781,128 | 1.0% |
| 9 | Nevada | 3,104,614 | 3,114,071 | 3,143,991 | 1.0% |
| 10 | South Dakota | 886,667 | 887,099 | 895,376 | 0.9% |
Table 4.
| Top 10 States (or Equivalent)in Numeric Decline, 2020 to 2021 | |||||
| Rank | Geographic Area | April 1, 2020 (Estimates Base) |
July 1, 2020 | July 1, 2021 | Numeric Decline |
| 1 | New York | 20,201,249 | 20,154,933 | 19,835,913 | -319,020 |
| 2 | California | 39,538,223 | 39,499,738 | 39,237,836 | -261,902 |
| 3 | Illinois | 12,812,508 | 12,785,245 | 12,671,469 | -113,776 |
| 4 | Massachusetts | 7,029,917 | 7,022,220 | 6,984,723 | -37,497 |
| 5 | Louisiana | 4,657,757 | 4,651,203 | 4,624,047 | -27,156 |
| 6 | Pennsylvania | 13,002,700 | 12,989,625 | 12,964,056 | -25,569 |
| 7 | District of Columbia | 689,545 | 690,093 | 670,050 | -20,043 |
| 8 | Michigan | 10,077,331 | 10,067,664 | 10,050,811 | -16,853 |
| 9 | New Jersey | 9,288,994 | 9,279,743 | 9,267,130 | -12,613 |
| 10 | Ohio | 11,799,448 | 11,790,587 | 11,780,017 | -10,570 |
Table 5.
| Top 10 States (or Equivalent) in Percent Decline, 2020 to 2021 | |||||
| Rank | Geographic Area | April 1, 2020 (Estimates Base) |
July 1, 2020 | July 1, 2021 | Percent Decline |
| 1 | District of Columbia | 689,545 | 690,093 | 670,050 | -2.9% |
| 2 | New York | 20,201,249 | 20,154,933 | 19,835,913 | -1.6% |
| 3 | Illinois | 12,812,508 | 12,785,245 | 12,671,469 | -0.9% |
| 4 | Hawaii | 1,455,271 | 1,451,911 | 1,441,553 | -0.7% |
| 5 | California | 39,538,223 | 39,499,738 | 39,237,836 | -0.7% |
| 6 | Louisiana | 4,657,757 | 4,651,203 | 4,624,047 | -0.6% |
| 7 | Massachusetts | 7,029,917 | 7,022,220 | 6,984,723 | -0.5% |
| 8 | North Dakota | 779,094 | 778,962 | 774,948 | -0.5% |
| 9 | West Virginia | 1,793,716 | 1,789,798 | 1,782,959 | -0.4% |
| 10 | Mississippi | 2,961,279 | 2,956,870 | 2,949,965 | -0.2% |
Configure Dialog
The configure dialog allows the content author to define multiple tabs. See below for more about the Tab Component dialog.
Tab: Page Tab
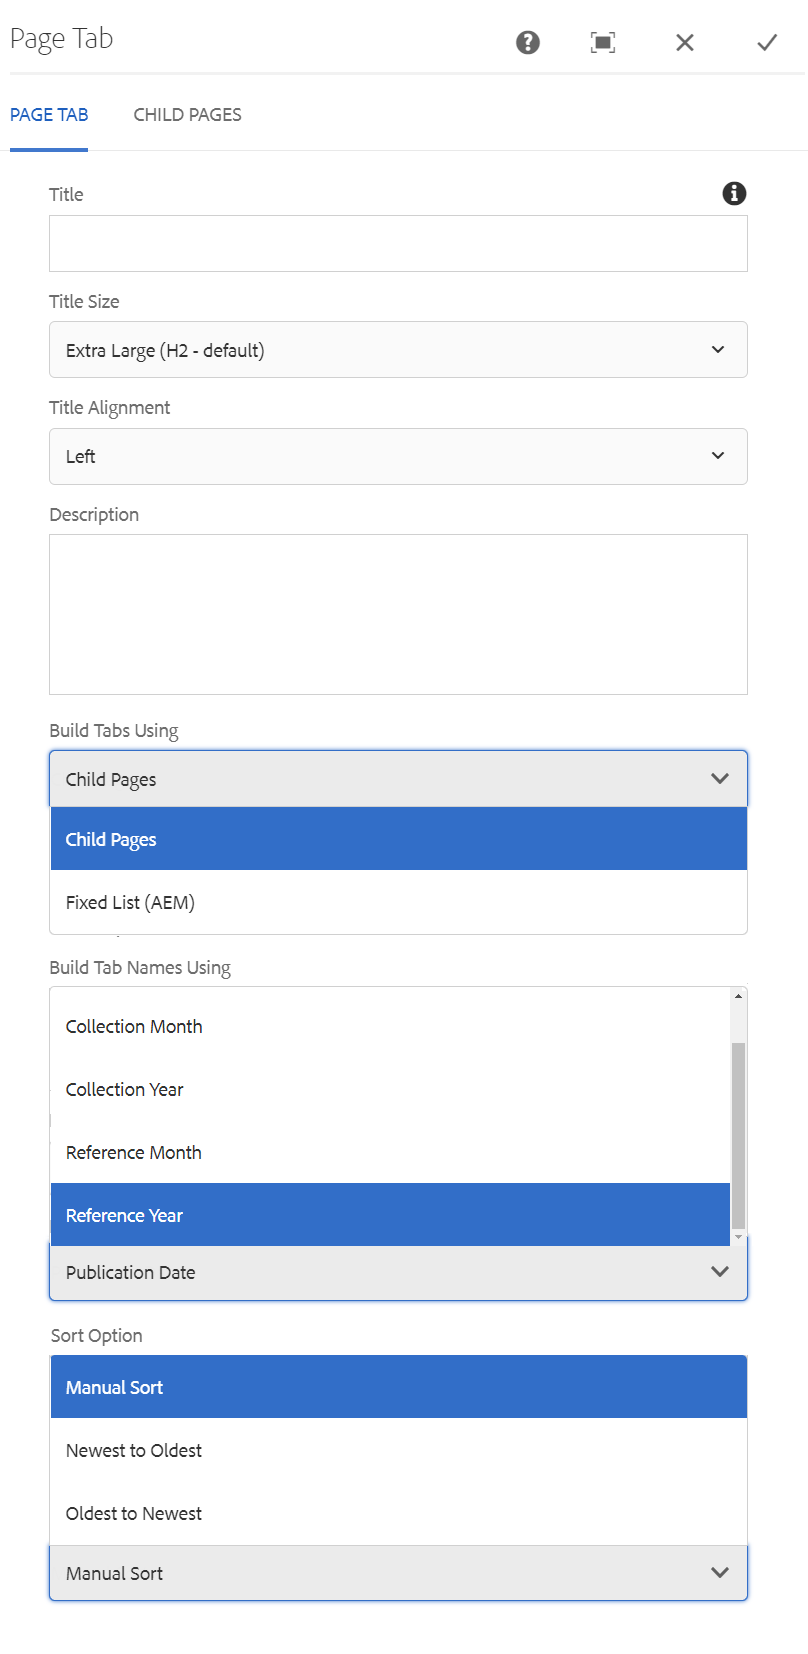
- Title – If you'd like to add a Section Title, insert it here.
- Title Size – Size of the title text. (H2 default)
- Title Alignment – Overrides the default alignment of the title text.
- Description – If you'd like to add a description, insert it here.
- Build Tabs Using – Choose between Child Pages or Fixed List (AEM)
- Build Tab Names Using – Choose between Publication Date, Collection Month, Collection Year, Reference Month, or Reference Year.
- Sort Option – Choose between Manual Sort, Newest to Oldest, or Oldest to Newest.
Tab: Child Pages

- Parent Page – Allows you to select a page to list its child pages (i.e., pages nested under the selected page).
Tab: Fixed List (AEM)

- Add Field – Allows you to select specific AEM pages to build tabs.
Developer Resources
Expand the section below to see the Tabbed Page Component HTML output.