Tabbed Page Component
The Tabbed Page Component creates custom tabs to display full page content under each tab. In order to use this component you must submit a Jira ticket to CNMP requesting it be enabled for a specific page.
The Tabbed Page Component displays full page content under each tab. Users navigate between the tabs to access the page content. The component displays one page per tab.
The difference between this component and the tab component, is this component uses the standard sorting choices (building the tab order) of publication date, collection year or month, and reference year or month.
Example
View on public site:

Examples by Template
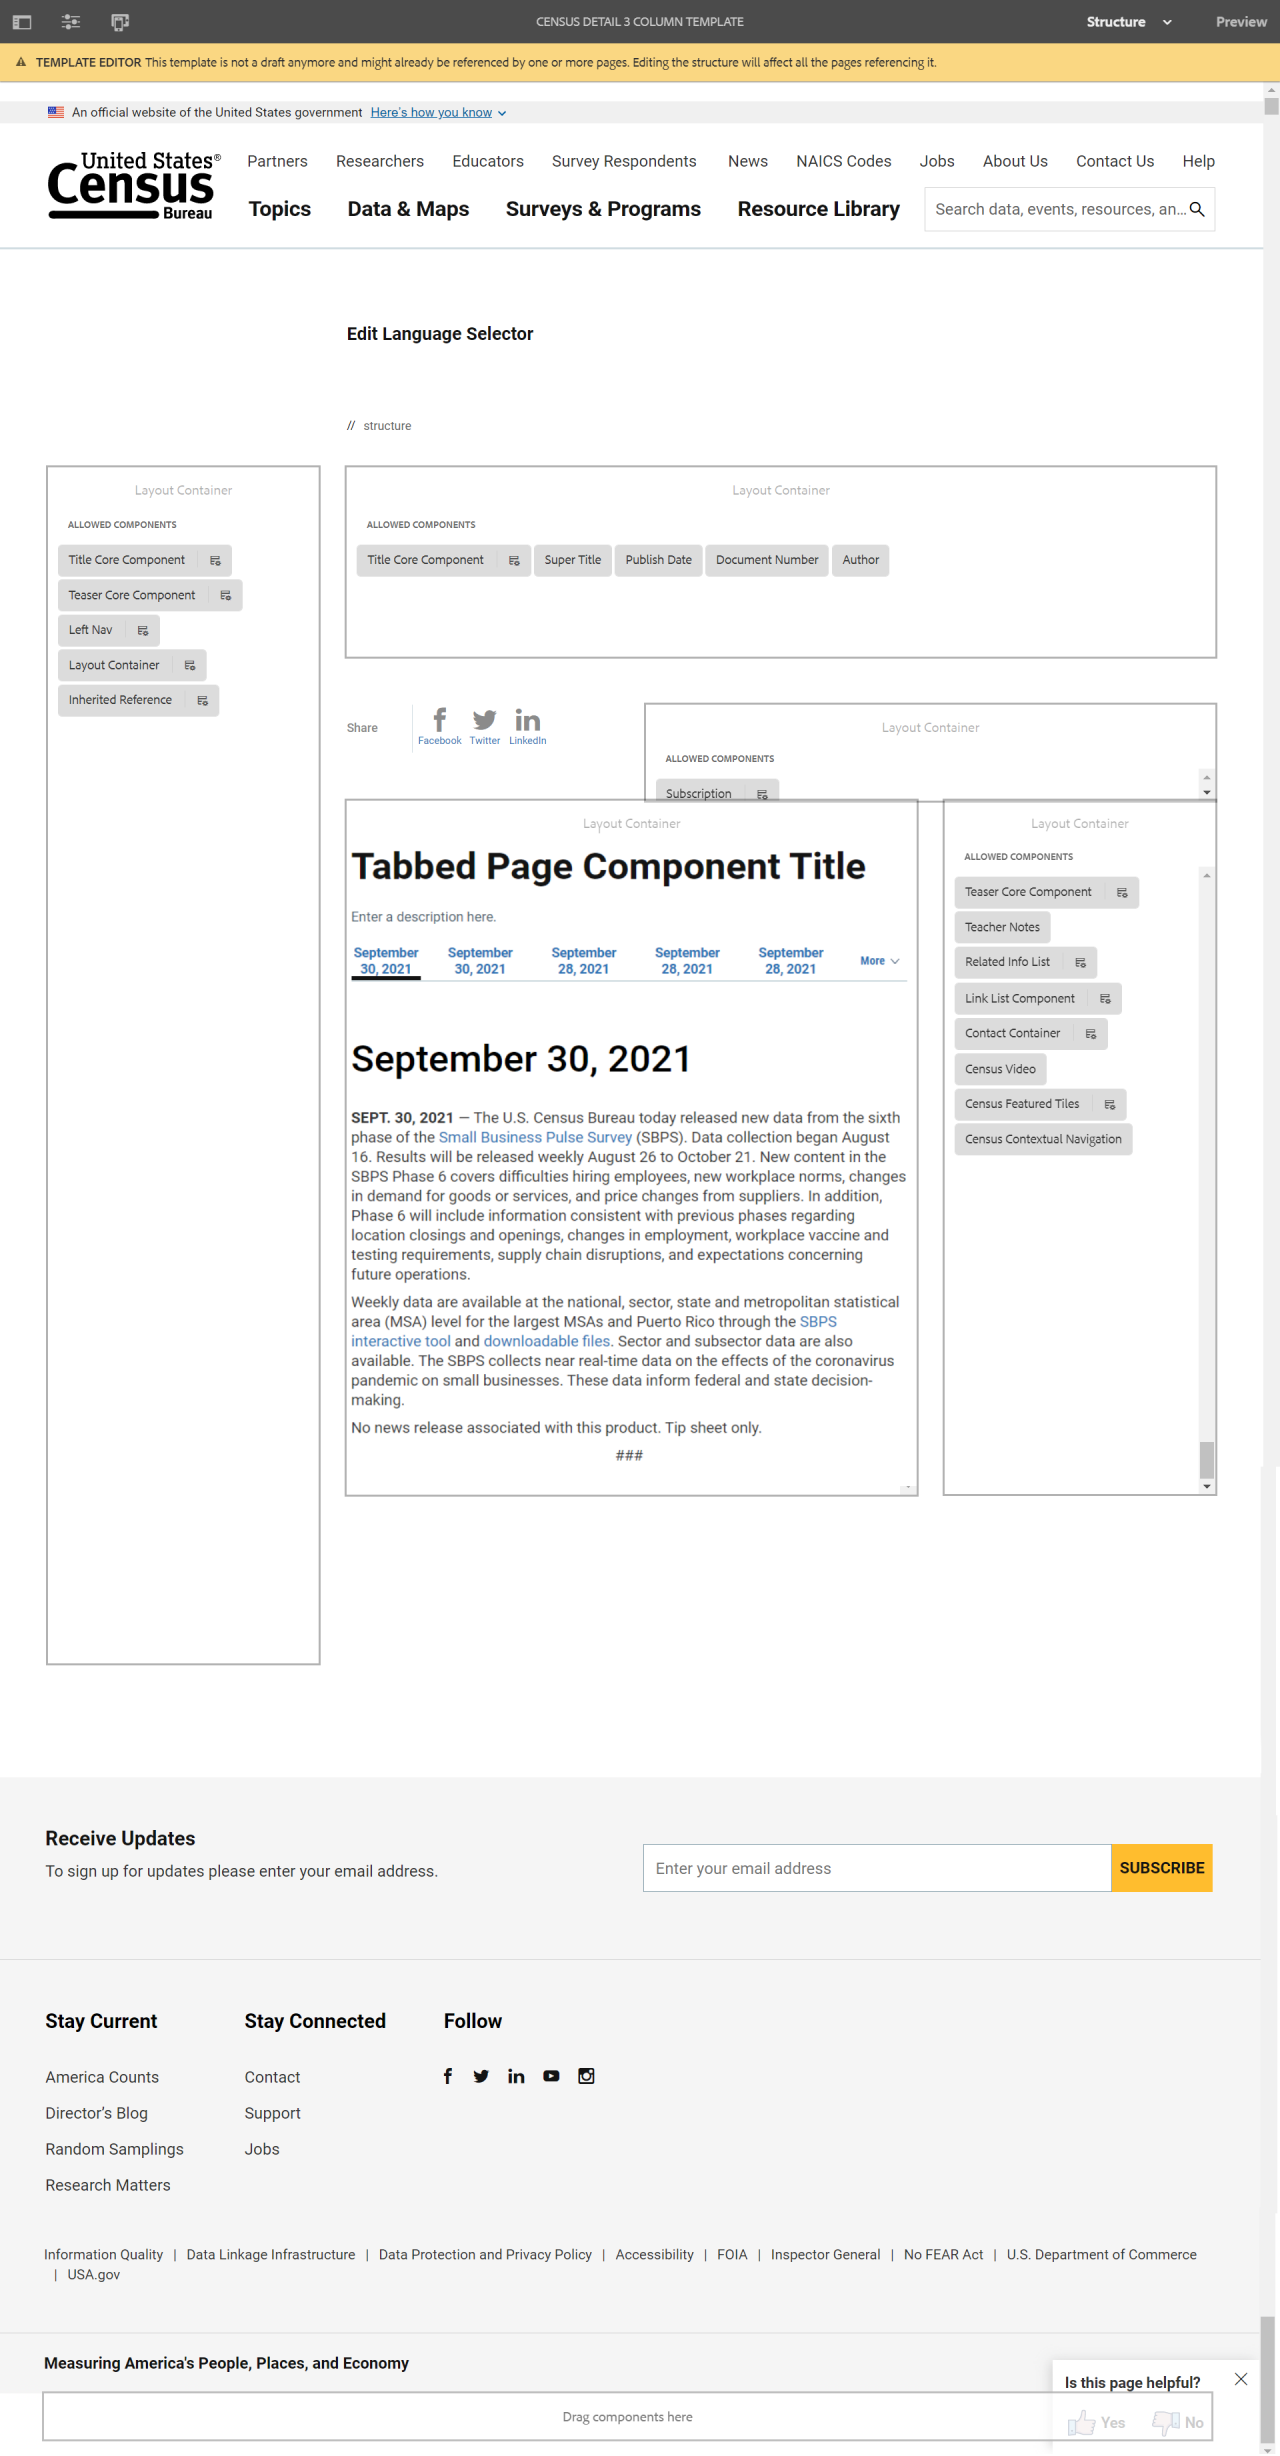
Census 3 Column
When to Use
Tabbed Page Component is useful for pages designed to display a high volume of previews for related datasets, releases, reports, interactive visuals, and other such pages. Tabs provide a manner by which to organize these related materials.
An author should use the Tabbed Page Component when they have a set of pages, releases, or data that lends to being organized by a preset order to parse items.
Usage
In contrast to the Tab Component, the Tabbed Page Component does not rely on the author to manually order the tabs; instead, it offers preset manners by which to order the tabs. Tabs can be built by collection month/year, by reference month/year, or by publication date and can be sorted manually or from oldest to newest or newest to oldest.
Content authors should use the Tabbed Page Component when they have a set of pages, releases, or data that tends to be organized by a preset order to parse items.
Web Recommendation
Individual pages that are in tabs should have redirects to their tabbed versions. While not required for these pages it is strongly recommended.
This way users can only see the tabbed version of the page. The redirect is found under Page Properties > Advanced tab.
Tabbed Page Component Title
April 26, 2021
APRIL 26, 2021 — Today the U.S. Census Bureau released information about the quality of the 2020 Census from two methods: (1) analyses that compare the first census results to other ways of measuring the population, and (2) metrics that provide insight into the census operations.
The Census Bureau accelerated plans for releasing this information because of increased interest in how COVID-19 and its impact on operations may have impacted the quality of the 2020 Census. This is the first time that the Census Bureau has released such detailed analyses and operational quality metrics on the same day as the first population counts.
“Despite all the challenges of the pandemic, the completeness and accuracy of these first 2020 Census results are comparable with recent censuses,” said Census Bureau Acting Director Ron Jarmin. “We had numerous quality checks built into collecting the data, and we have conducted one of the most comprehensive reviews in recent census history during data processing. We are confident that today’s 2020 Census results meet our high data quality standards.”
Comparing to Population Benchmarks
The report A Preliminary Analysis of U.S. and State-Level Results From the 2020 Census compares the 2020 Census population counts to three other population benchmarks — previous decennial census results, estimates from the Census Bureau’s Population Estimates Program, and the 2020 Demographic Analysis estimates.
The report analyzes the differences between the 2020 Census counts and each of the benchmarks. The analyses show that these first results from the 2020 Census are in line with the three sets of benchmarks:
- Growth since 2010 is consistent with growth patterns measured by the census in recent decades.
- The national census count is very close to the April 1, 2020, population estimate from the Census Bureau’s Population Estimates Program.
- The national census count falls between the low and middle estimates of the 2020 Demographic Analysis, meaning it fits within the range of plausible estimates of the population on April 1, 2020.
The findings are also discussed in the Comparisons to Benchmarks as a Measure of Quality blog.
Operational Metrics
The operational metrics released today include information on how people responded to the 2020 Census, as well as how the Census Bureau accounted for addresses that did not respond. These metrics add to the unprecedented number of data quality indicators the Census Bureau has already provided on 2020 Census data collection.
New metrics are available for the nation, all 50 states, the District of Columbia and Puerto Rico in an interactive dashboard as well as a downloadable table.
These metrics show by state the percentage of addresses in the 2020 Census that the Census Bureau determined were occupied, vacant or nonexistent. That status was determined by:
- Self-response: A household member responded online, by phone or by mail on their own.
- Nonresponse Followup: A census taker collected a response from a household member or a proxy respondent, such as a neighbor, building manager or landlord.
- Group quarters: The Census Bureau collected the response through the Group Quarters Enumeration (GQE) operation, which counts people living in places such as college dormitories, prisons and nursing homes.
- Unresolved: The Census Bureau used imputation to assign a status and population count for addresses that remained unresolved after concluding data collection operations. Imputation is a statistical technique that fills in missing information using other available information.
The operational metrics also show how the Census Bureau resolved households through the Nonresponse Followup operation, such as through an interview with a member of the household, or a proxy, or through the use of administrative records. Finally, the metrics provide the percent of vacant addresses and the percent of deleted (i.e., nonexistent) addresses resolved with a proxy interview or by using administrative records, respectively.
The dashboard and the downloadable table provide comparable metrics from the 2010 Census. It is important to note there will be differences between the two decades across geographies. Many differences result from changes in how the 2020 Census was conducted compared to the 2010 Census. For example, the 2020 Census invited people to respond online.
While no single number can definitively quantify the quality of the census, looking at these metrics collectively and comparing them with past censuses provides an important perspective to consider. Preliminary analyses of the operational metrics are available in the Examining Operational Quality Metrics blog.
Looking Ahead
The Census Bureau will continue to evaluate the 2020 Census and release additional quality metrics and assessments in the months and years to come. The Census Bureau will use these assessments to prepare and innovate for the 2030 Census.
For more information, visit our 2020 Census Quality and Data Processing Press Kit with materials from today’s data release.
###
Configure Dialog
The configure dialog allows the content author to define multiple tabs. See below for more about the Tab Component dialog.
Tab: Page Tab
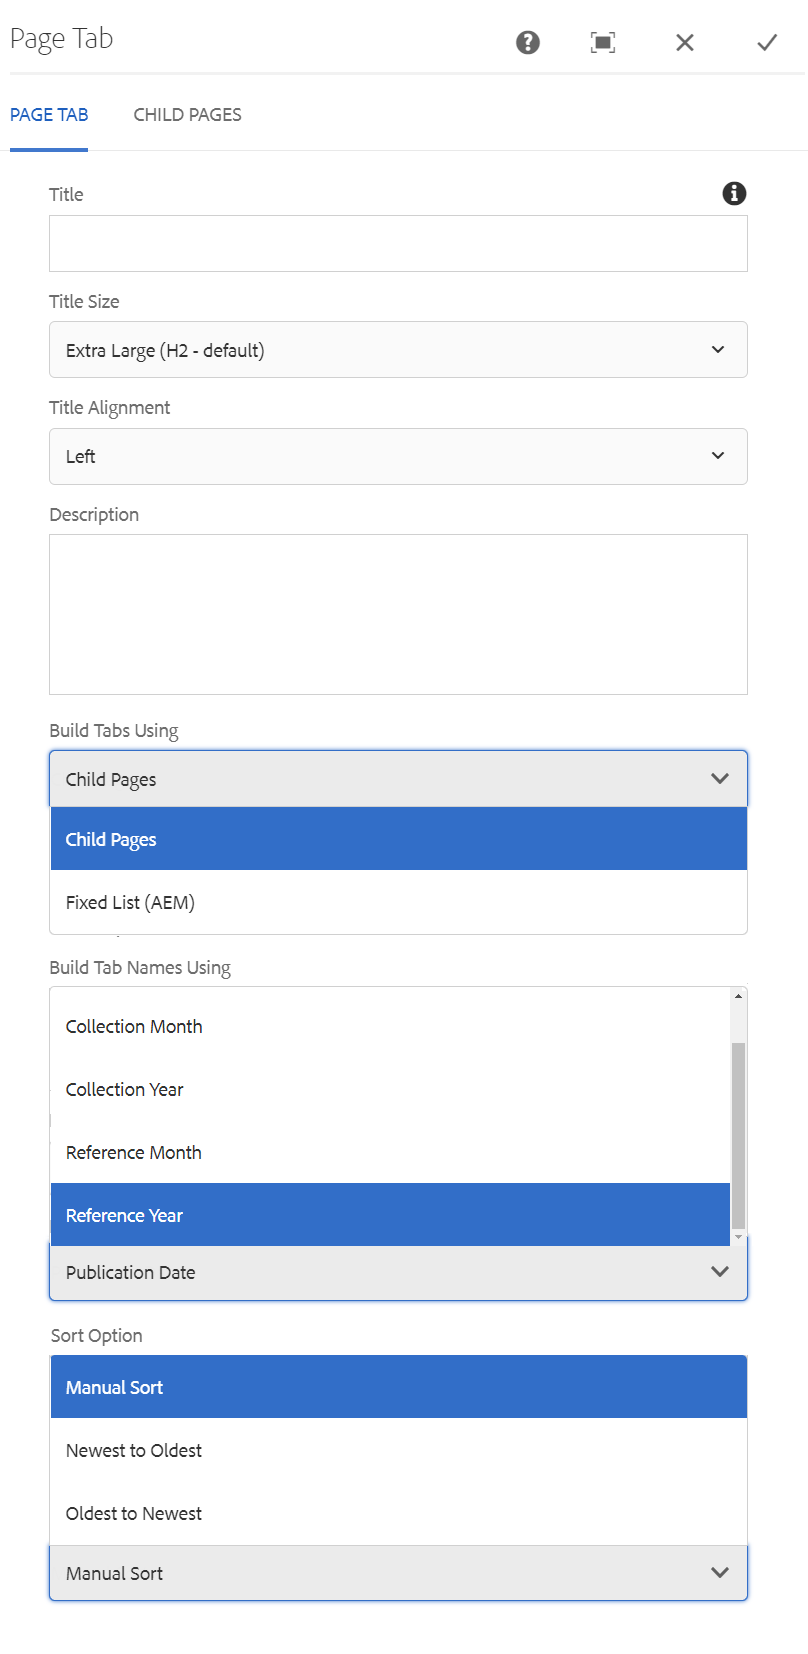
- Title – If you'd like to add a Section Title, insert it here.
- Title Size – Size of the title text. (H2 default)
- Title Alignment – Overrides the default alignment of the title text.
- Description – If you'd like to add a description, insert it here.
- Build Tabs Using – Choose between Child Pages or Fixed List (AEM)
- Build Tab Names Using – Choose between Publication Date, Collection Month, Collection Year, Reference Month, or Reference Year.
- Sort Option – Choose between Manual Sort, Newest to Oldest, or Oldest to Newest.
Tab: Child Pages
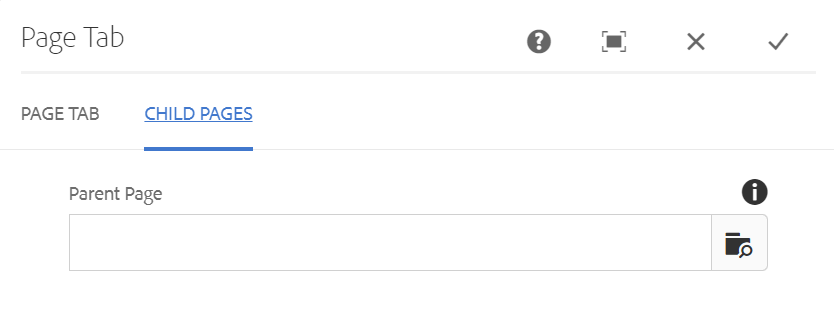
- Parent Page – Allows you to select a page to list its child pages (i.e., pages nested under the selected page).
Tab: Fixed List (AEM)
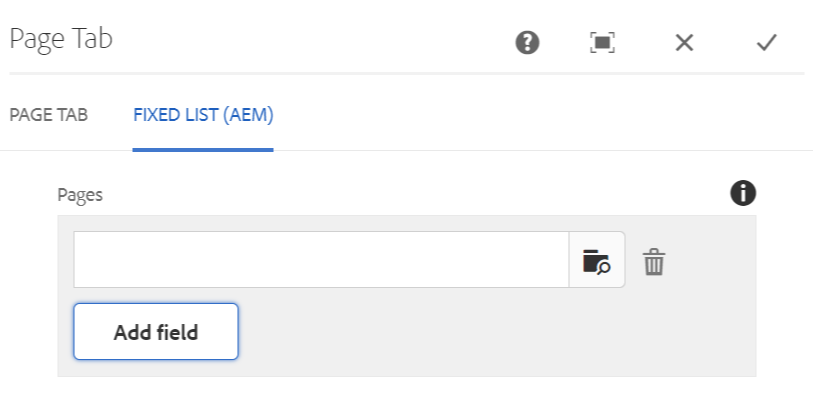
- Add Field – Allows you to select specific AEM pages to build tabs.
Developer Resources
Expand the section below to see the Tabbed Page Component HTML output.